


A Rejection Block Trading is a price zone where the price touches but cannot break through, resulting in a reversal. This phenomenon usually occurs at significant market highs or lows and sometimes after liquidity has been collected.
Traders utilize this area to identify potential price reversal points for entering or exiting trades.
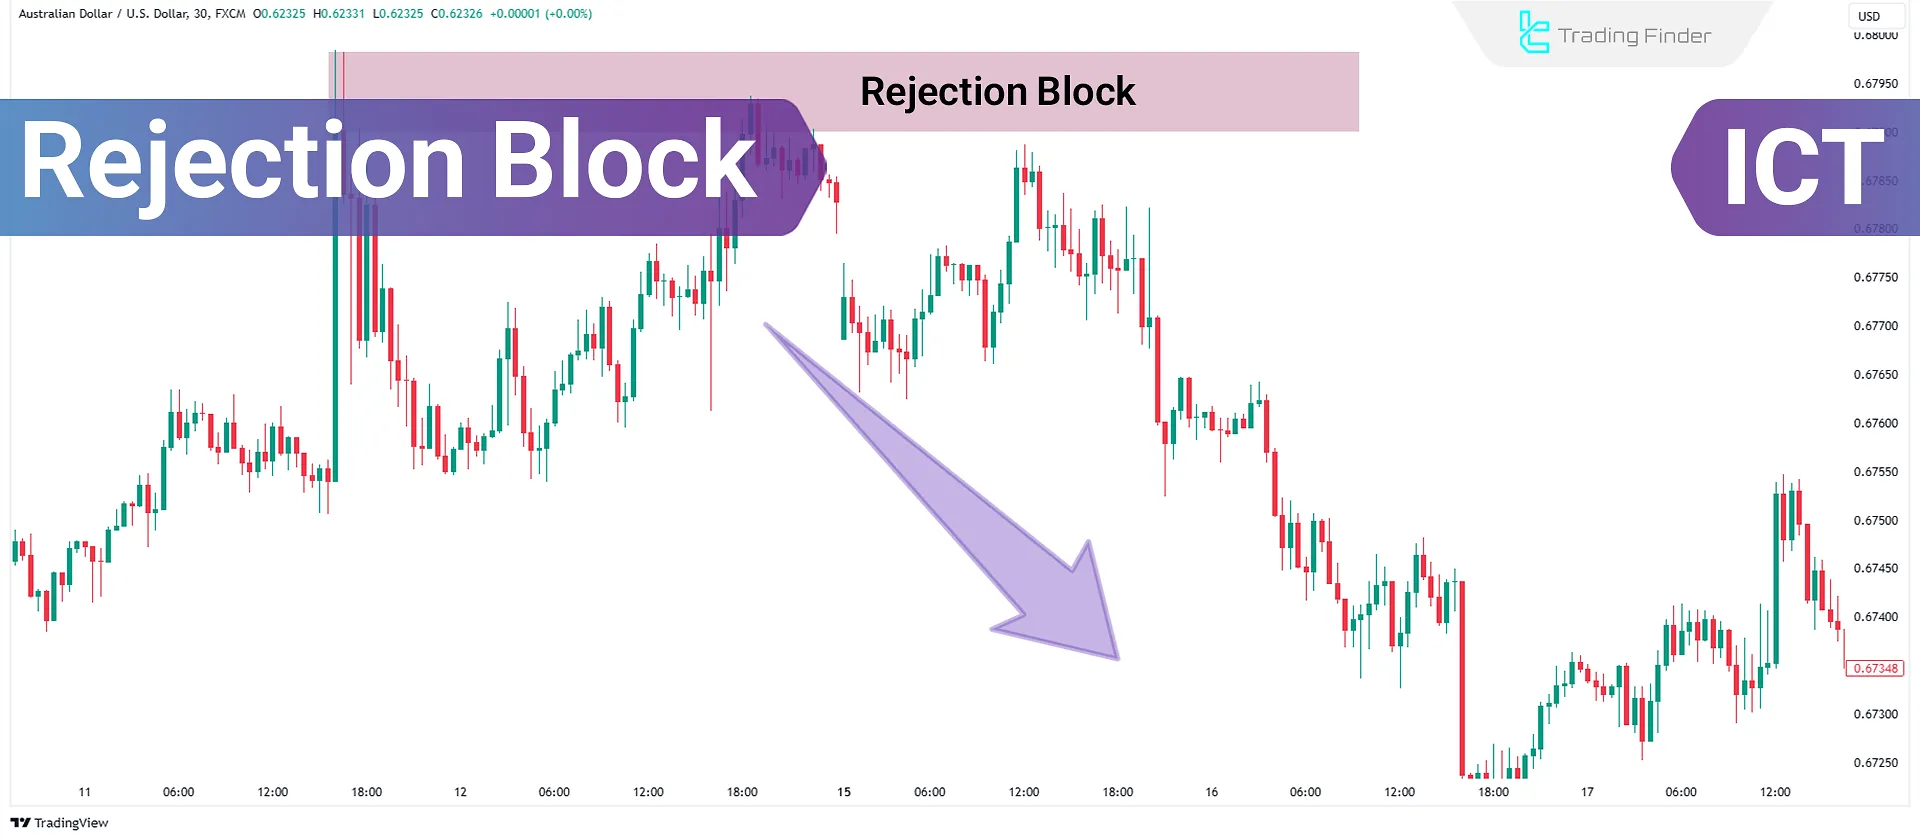
What is a Rejection Block?
A Rejection Block forms when the price touches previous market highs or lows and absorbs the liquidity in those areas. Long wicks appear on the chart at this point, indicating a reversal from that zone. These long wicks are the Rejection Blocks, which traders use to identify price reversal points.
Visual tutorial on rejection blocks from the Writo-Finance website:
Advantages and Disadvantages of Rejection Blocks
The structure of a rejection block usually forms after liquidity has been absorbed at market highs or lows and is used to identify precise reversal points. Table of advantages and disadvantages of rejection blocks:
Advantages | Disadvantages |
Provides precise entry points at deep retracement levels (80–90% Fibonacci) | Possibility of fake-outs or false reversals after rejection |
Small stop loss and easy risk management | Requires additional confirmations such as market structure or volume |
High risk-to-reward ratio | Difficult to identify for beginner traders |
Shows price weakness in breaking key levels | Potential delay in entry until full reversal confirmation |
Usable across all financial markets (Forex, stocks, crypto) | Lower effectiveness in low-volatility or low-liquidity markets |
Compatible with and complementary to ICT concepts such as Order Blocks and FVG | No absolute certainty in price reversals |
How to Identify Rejection Block
To accurately identify a rejection block ICT, specific analytical steps must be followed to properly assess the validity of the zone.
This process includes examining liquidity zones, candlestick behavior, and price reactions across multiple timeframes, which together determine the strength and accuracy of the reversal signal.
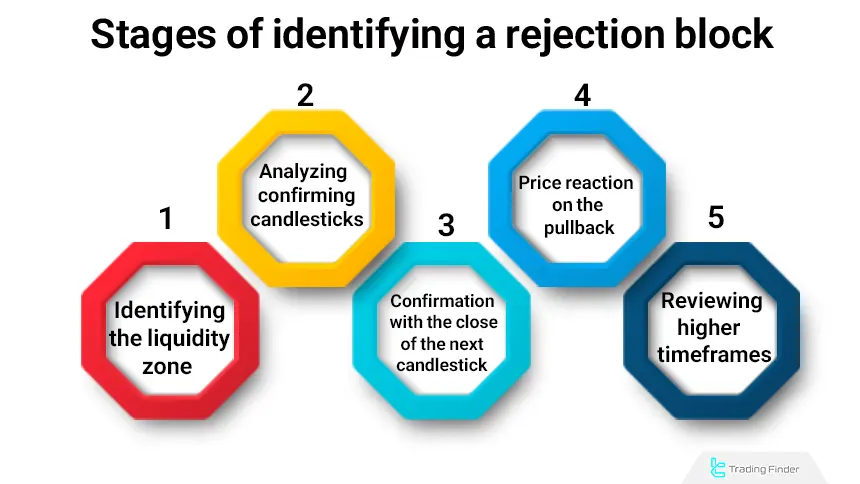
#1 Identifying the Liquidity Zone or Key Level
Identify levels with a high probability of liquidity concentration, including structural highs and lows, order blocks, or premium and discount zones. Rejection blocks usually form in these areas.
#2 Analyzing Candlestick Confirmation
Look for candles with long wicks in the direction of the prior trend and a close in the opposite direction. This type of close indicates the entry of opposing orders and price rejection from the current level.
#3 Confirmation with the Close of the Next Candle
If the next candle also closes in the opposite direction (for example, after a strong bullish candle, a bearish candle closes), the probability of a rejection block forming increases.
This reaction shows the active participation of strong buyers or sellers preventing price continuation in the previous direction.
#4 Observing Price Reaction on the Pullback
When price returns to the rejection block zone and is rejected again, its validity can be confirmed. This reaction is usually accompanied by reduced momentum and the formation of indecision candles.
#5 Reviewing Higher Timeframes
Rejection blocks that form on higher timeframes (such as 1H or 4H) generally have greater strength and reliability and can act as new support or resistance zones.
This is because larger amounts of liquidity are involved on higher timeframes, and institutional decisions have a more direct impact on price direction.
Rejection Block Confirmations
A rejection block alone is not a definitive entry signal, and to increase analytical accuracy, it should be combined with supporting tools. These confirmations evaluate the validity of the price reversal and reduce the probability of fake-outs or incomplete reversals.
When aligned with market structure, liquidity context, and clear price reaction, a rejection block becomes significantly more reliable for trade execution.
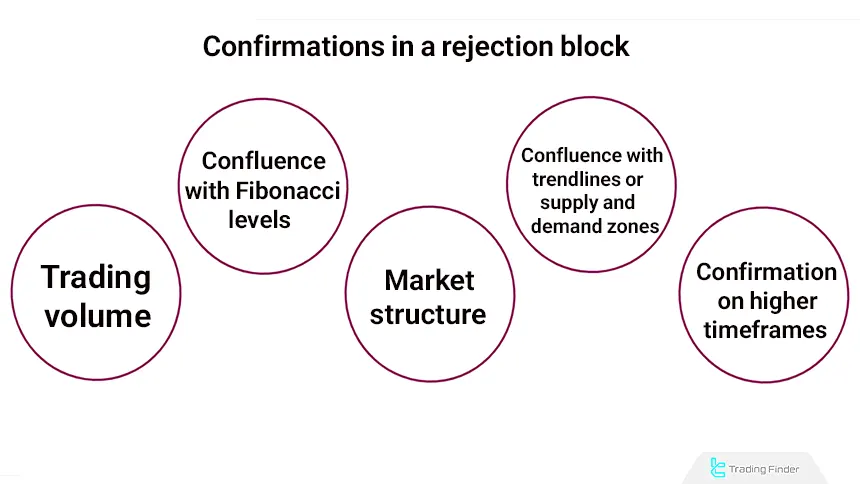
Volume Analysis
An increase in volume on the rejection candle or the following candle indicates the presence of effective liquidity and smart money participation. In bullish trends, high volume on a lower rejection candle can confirm buyer strength.
Fibonacci Confluence
If a rejection block forms within the 78.6% to 88.6% Fibonacci zone, the probability of a valid reversal increases. These levels are typically considered deep liquidity zones and areas of price exhaustion.
Market Structure Shift
A break in market structure (Break of Structure or Change of Character) after the formation of a rejection block is one of the strongest confirmations. This indicates a real change in order flow.
At this stage, the trader can use the structure break aligned with the rejection block zone as final confirmation of a market phase shift and the start of the dominant order flow.
Confluence with Trendlines or Supply and Demand Zones
The formation of a rejection block at the confluence of a valid trendline or a historical supply/demand zone significantly increases the probability of a strong price reaction. In such cases, overlapping technical factors lead to increased order concentration in that area.
Confirmation on Higher Timeframes (Higher Timeframe Alignment)
If the direction of the rejection block aligns with the overall structure of the higher timeframe, the validity of the signal increases substantially. In the ICT methodology, timeframe alignment is one of the core principles.
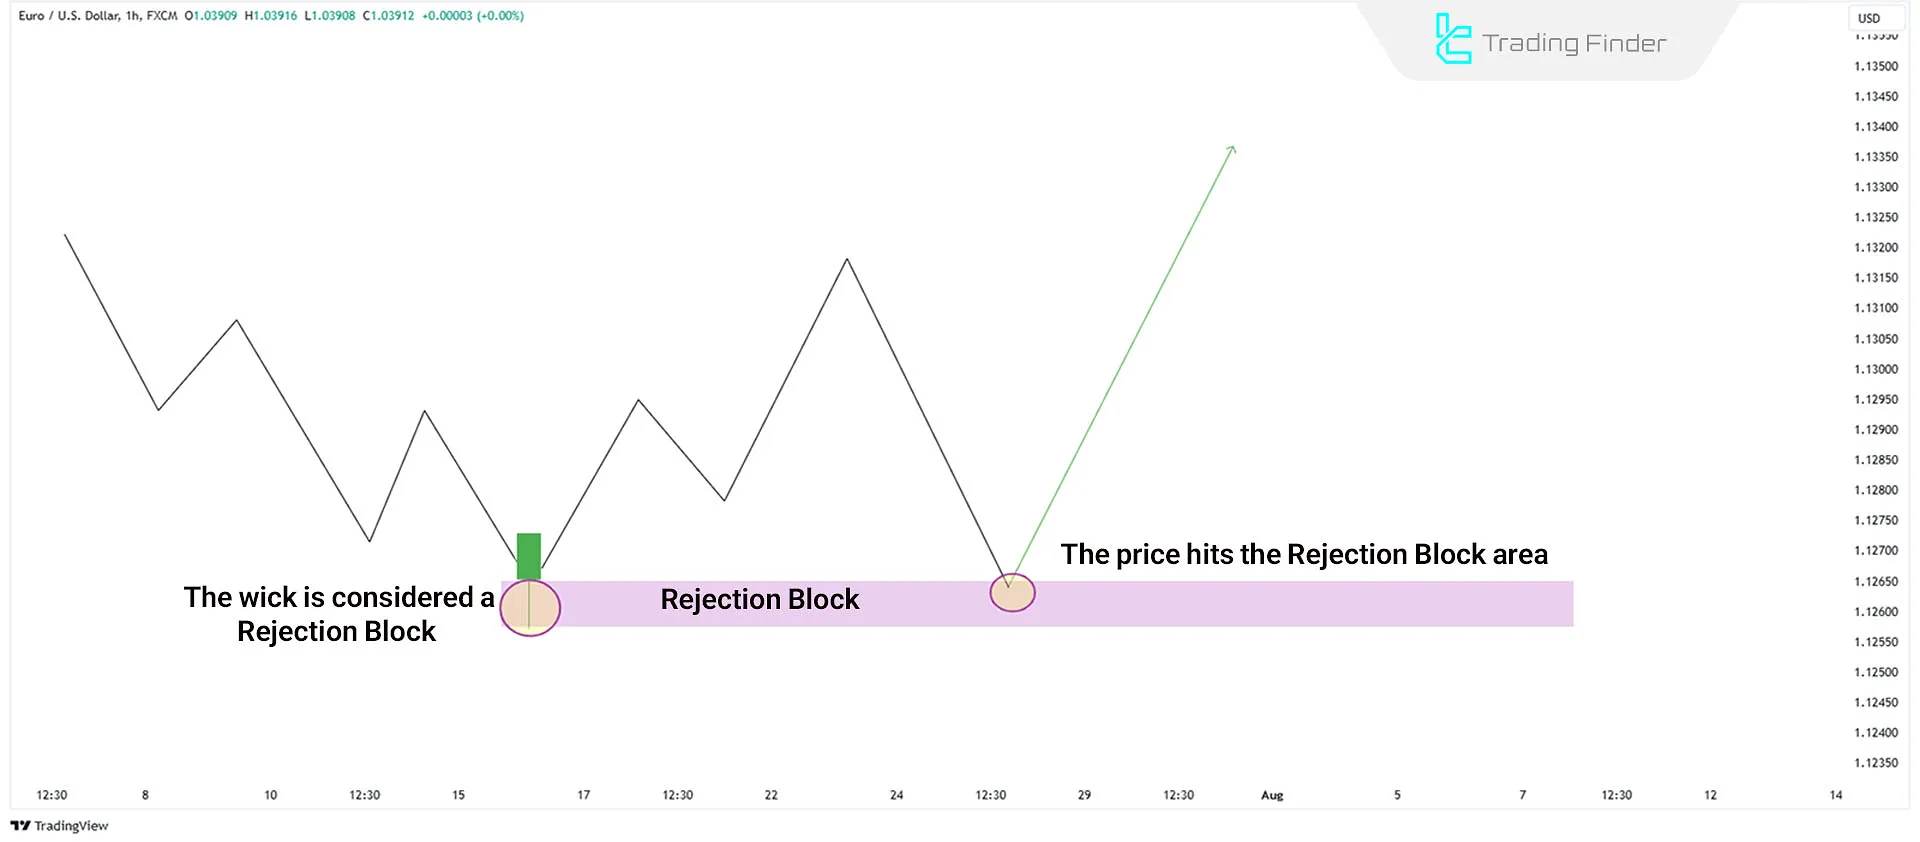
Example of a Bullish Rejection Block
To identify trading setups using a Bullish Rejection Block, follow these steps:
- A candlestick with a long lower wick may form when the price touches previous market lows and absorbs their liquidity. This indicates reluctance for further price decline and signals the start of an upward trend;
- The long lower wick is identified as the Rejection Block in this case;
- If the price revisits below the body of the candlestick in the block (to hunt sell-side stops), this creates an opportunity for a buy trade;
- To limit losses if the price falls, set a stop loss between 10 and 20 pips below the Rejection Block.
Example of a Bearish Rejection Block
To identify trading setups using a Bearish Rejection Block, follow these steps:
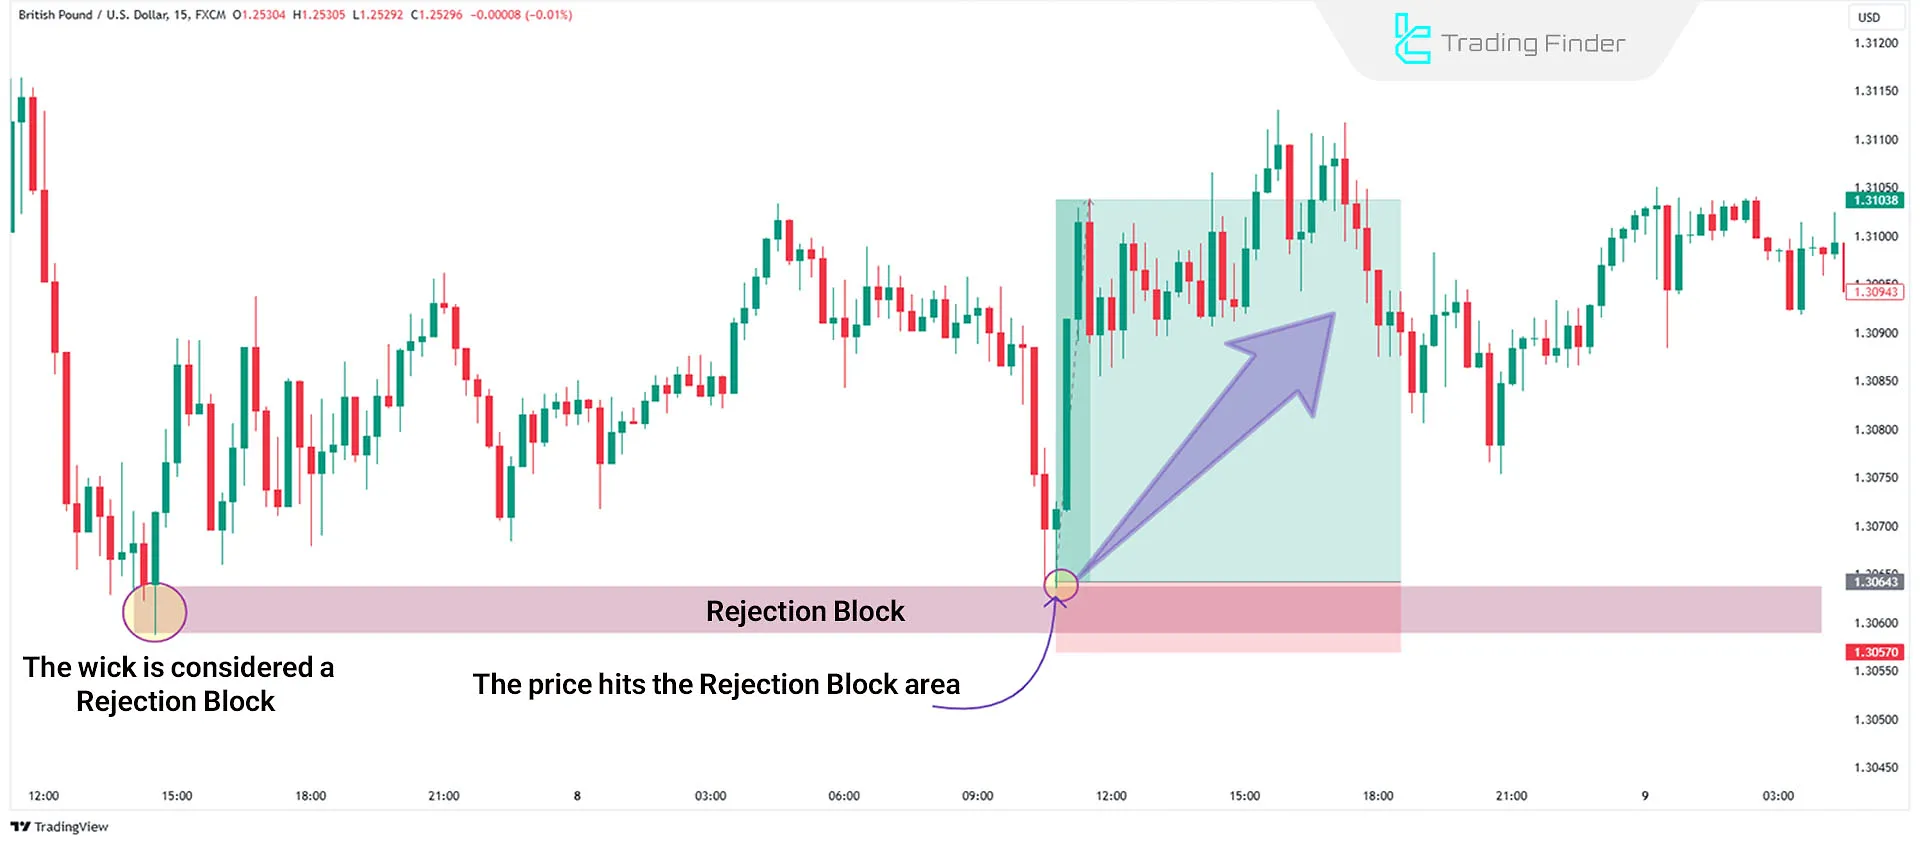
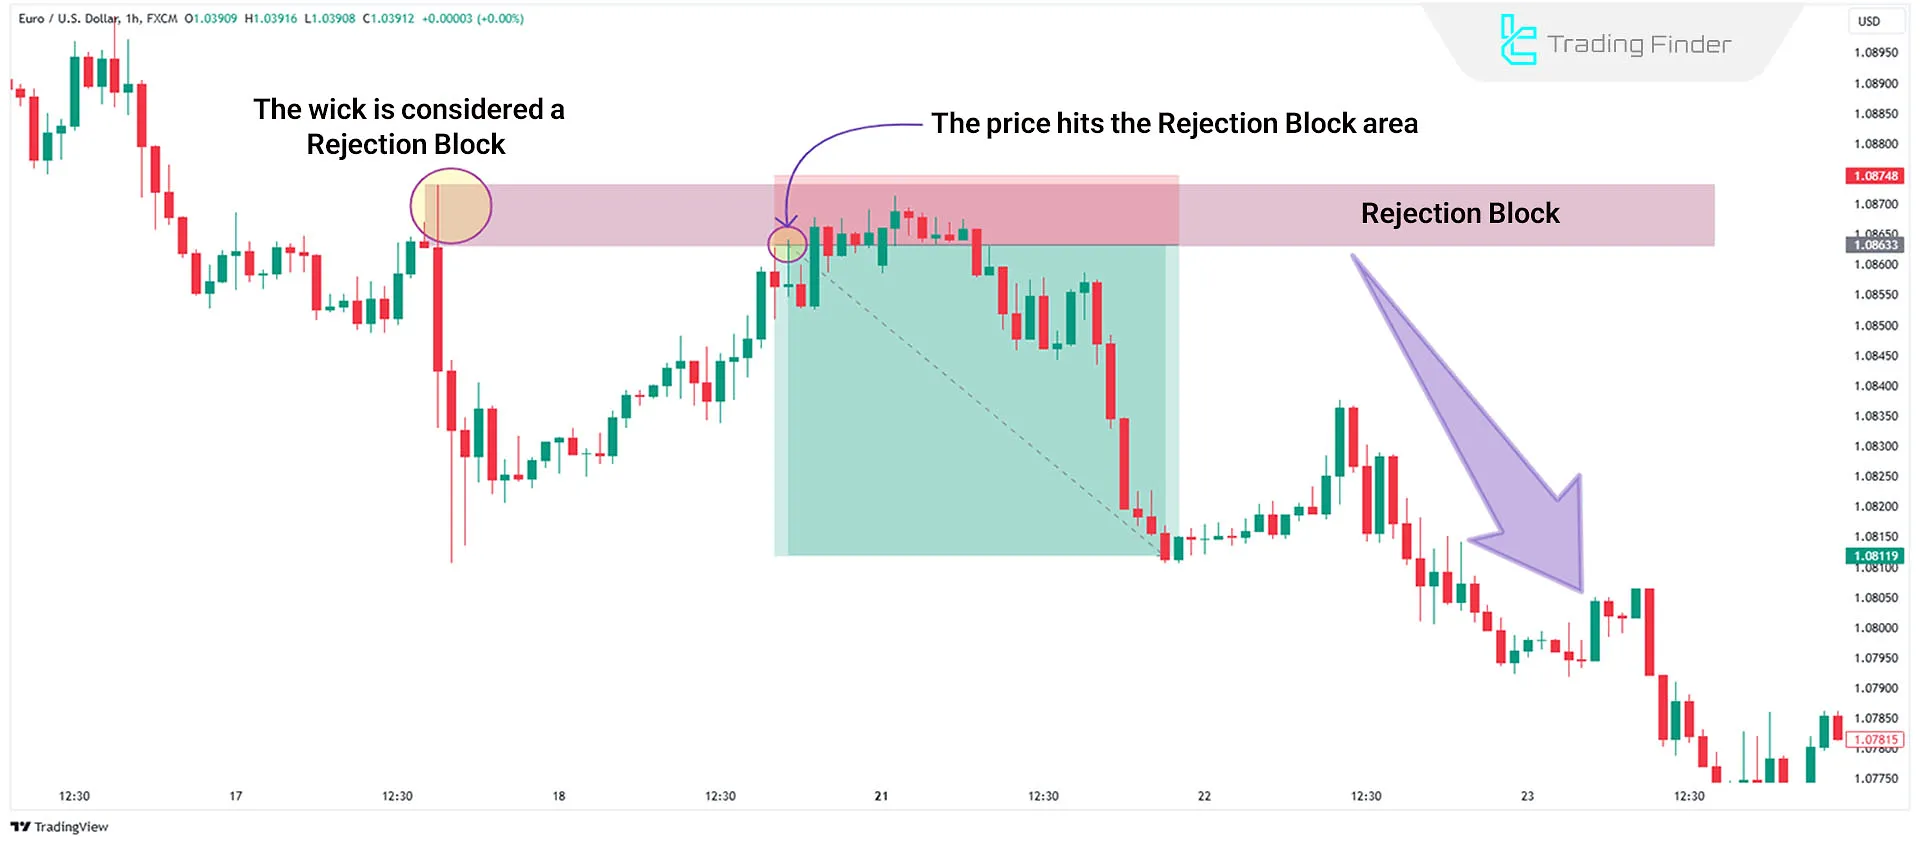
- A candlestick with a long upper wick may form when the price touches previous market highs and absorbs their liquidity. This indicates a reluctance to increase the price further and signals the start of a downward trend;
- In this scenario, the long upper wick becomes the Rejection Block;
- If the price revisits above the candlestick in the block (to hunt buy-side stops), this creates an opportunity for a sell trade;
- Set a stop loss between 10 to 20 pips above the Rejection Block to manage risks in case of unexpected upward movements.
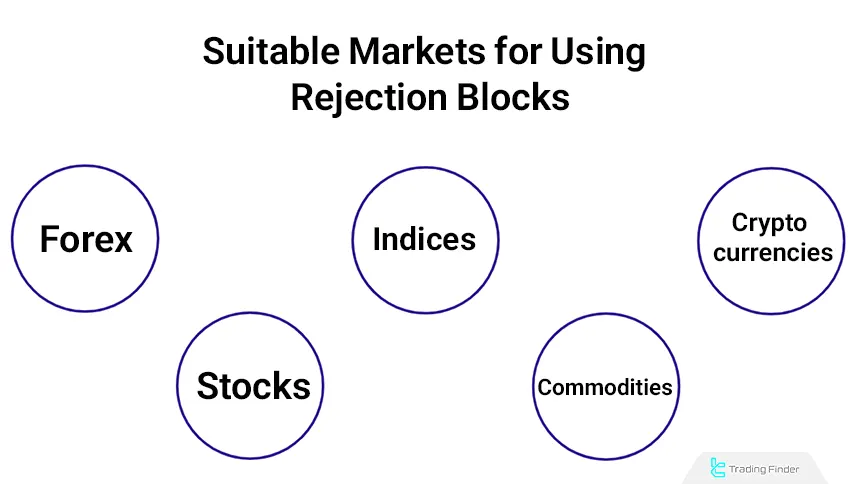
Best Times and Markets for Using Rejection Blocks
The rejection block pattern is applicable across all financial markets, including Forex, stocks, indices, commodities, and cryptocurrencies; however, its accuracy and reliability depend on the timeframe and overall market conditions.
On higher timeframes such as 1-hour (1H), 4-hour (4H), and Daily, rejection blocks tend to be more reliable because liquidity volume is higher and market maker decisions have a direct impact on price direction.
On the other hand, lower timeframes such as 5-minute or 15-minute charts are better suited for identifying more precise entry points especially when combined with confirmations such as BOS, CHoCH, or FVG.
This pattern typically performs best during major market sessions (London and New York), where liquidity and price volatility reach their peak, allowing rejection blocks to provide very strong reversal signals.
Educational video on rejection blocks from the FortuneTalks YouTube channel:
Key Characteristics of Rejection Blocks
Rejection blocks are among the key structures in ICT analysis and are considered a sign of price rejection and a shift in order flow within the market. These blocks usually form in sensitive areas of the chart.
Key characteristics of rejection blocks:
- Long Wicks: Rejection Blocks often feature long wicks, reflecting the price's failed attempt to break a level;
- Liquidity Sweep: Despite touching previous highs or lows and absorbing liquidity, the price changes direction;
- Formation at Significant Levels: These blocks often form at key market points (major highs and lows);
- Indicate Price Weakness: These blocks demonstrate the price's inability to break a specific level, often leading to reversals.
Are ICT Rejection Blocks Reliable?
Yes! Even if the price does not react to Order Blocks or Fair Value Gaps, the Rejection Block is often the last opportunity within the market cycle. For this reason, the likelihood of a profitable position increases.
Rejection Blocks in Different Markets
The rejection block pattern can be used in all financial markets; however, its price structure and reliability vary depending on the type of market.
In the Forex market, concentrated liquidity and the presence of major players cause rejection blocks to frequently form at key areas such as daily highs and lows or deep Fibonacci levels.
In this market, combining rejection blocks with concepts such as FVG and Order Blocks increases entry accuracy. In the cryptocurrency market, due to high volatility and fragmented liquidity, rejection blocks are more reliable on higher timeframes (4-hour to Daily).
In this environment, liquidity sweeps are usually more aggressive, and candlestick confirmations play a more important role in identifying genuine reversals.
In the stock and indices markets, rejection blocks often form simultaneously with fundamental news or abnormal volume. Using volume analysis (Volume Profile) is more important in these markets for validating this pattern.
Rejection Block Indicator
The rejection block indicator is designed to automatically identify market reversal zones. By analyzing long candlestick wicks (rejection wicks), this indicator highlights areas where price fails to break through a specific level, signaling a potential trend reversal.
In its logic, upper wicks represent price rejection at market highs, while lower wicks represent price rejection at market lows. After identifying these levels, the indicator automatically displays bullish rejection blocks with green boxes and bearish rejection blocks with red boxes on the chart.
Consumed (void) areas are also marked in gray, allowing traders to distinguish between valid and invalid zones. Educational video on using the rejection block indicator:
This indicator can be used across various markets, including Forex, cryptocurrencies, stocks, and commodities, and is especially popular in ICT and Smart Money Concepts trading styles.
Examples on the Bitcoin (BTC/USD) chart and the EUR/USD currency pair show that after a rejection block forms, price typically returns to this zone during the next pullback, creating a favorable opportunity to enter trades in the direction of the reversal.
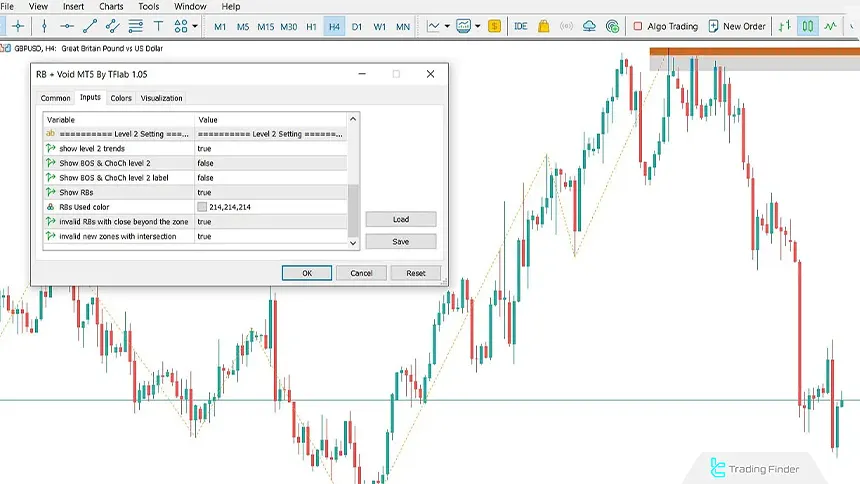
In the settings section, users can control parameters such as displaying BOS and CHoCH, level 1 and level 2 trends, zone colors, historical candle checks, and separator lines.
Overall, the rejection block indicator by identifying reversal zones based on candlestick behavior and managing consumed areas is considered a precise tool for early detection of market direction changes. It helps traders define entry and exit points with greater confidence.
Download links for the rejection block indicator:
Difference Between Rejection Block and Order Block
Understanding the difference between a rejection block and an order block is especially important for ICT traders, as each plays a different role in market reversals or trend continuation.
Table of differences between Rejection Block and Order Block:
Feature | Rejection Block | Order Block |
Nature | Price rejection and start of a reversal | Start of a strong move within a trend |
Formation area | Major highs and lows, liquidity sweep zones | End of pullbacks, liquidity accumulation zones |
Price behavior | Price is pushed away from the zone | Price returns to the zone to activate liquidity |
Trading application | Reversal trades | Continuation trades |
Common confirmation | CISD or confirmation candle | Break of Structure (BOS) |
Timeframe strength | Stronger on higher timeframes and liquidity zones | More reliable in established trends |
Conclusion
Trading with Rejection Blocks is one of the most effective ICT trading methods, identifying price reversals at deep retracement levels (80% and 90% Fibonacci). This approach, with tight stop losses and high risk-reward ratios, is ideal for managing risk and improving trading returns.
A rejection block is essentially a zone where price, after an unsuccessful attempt to continue its movement, encounters a strong opposite reaction.


