- TradingFinder
- Products
- Indicators
- MetaTrader 5 Indicators
- Swing Failure Pattern (SFP with fake break) Indicator for MetaTrader 5 - Download
Swing Failure Pattern (SFP with fake break) Indicator for MetaTrader 5 - Download


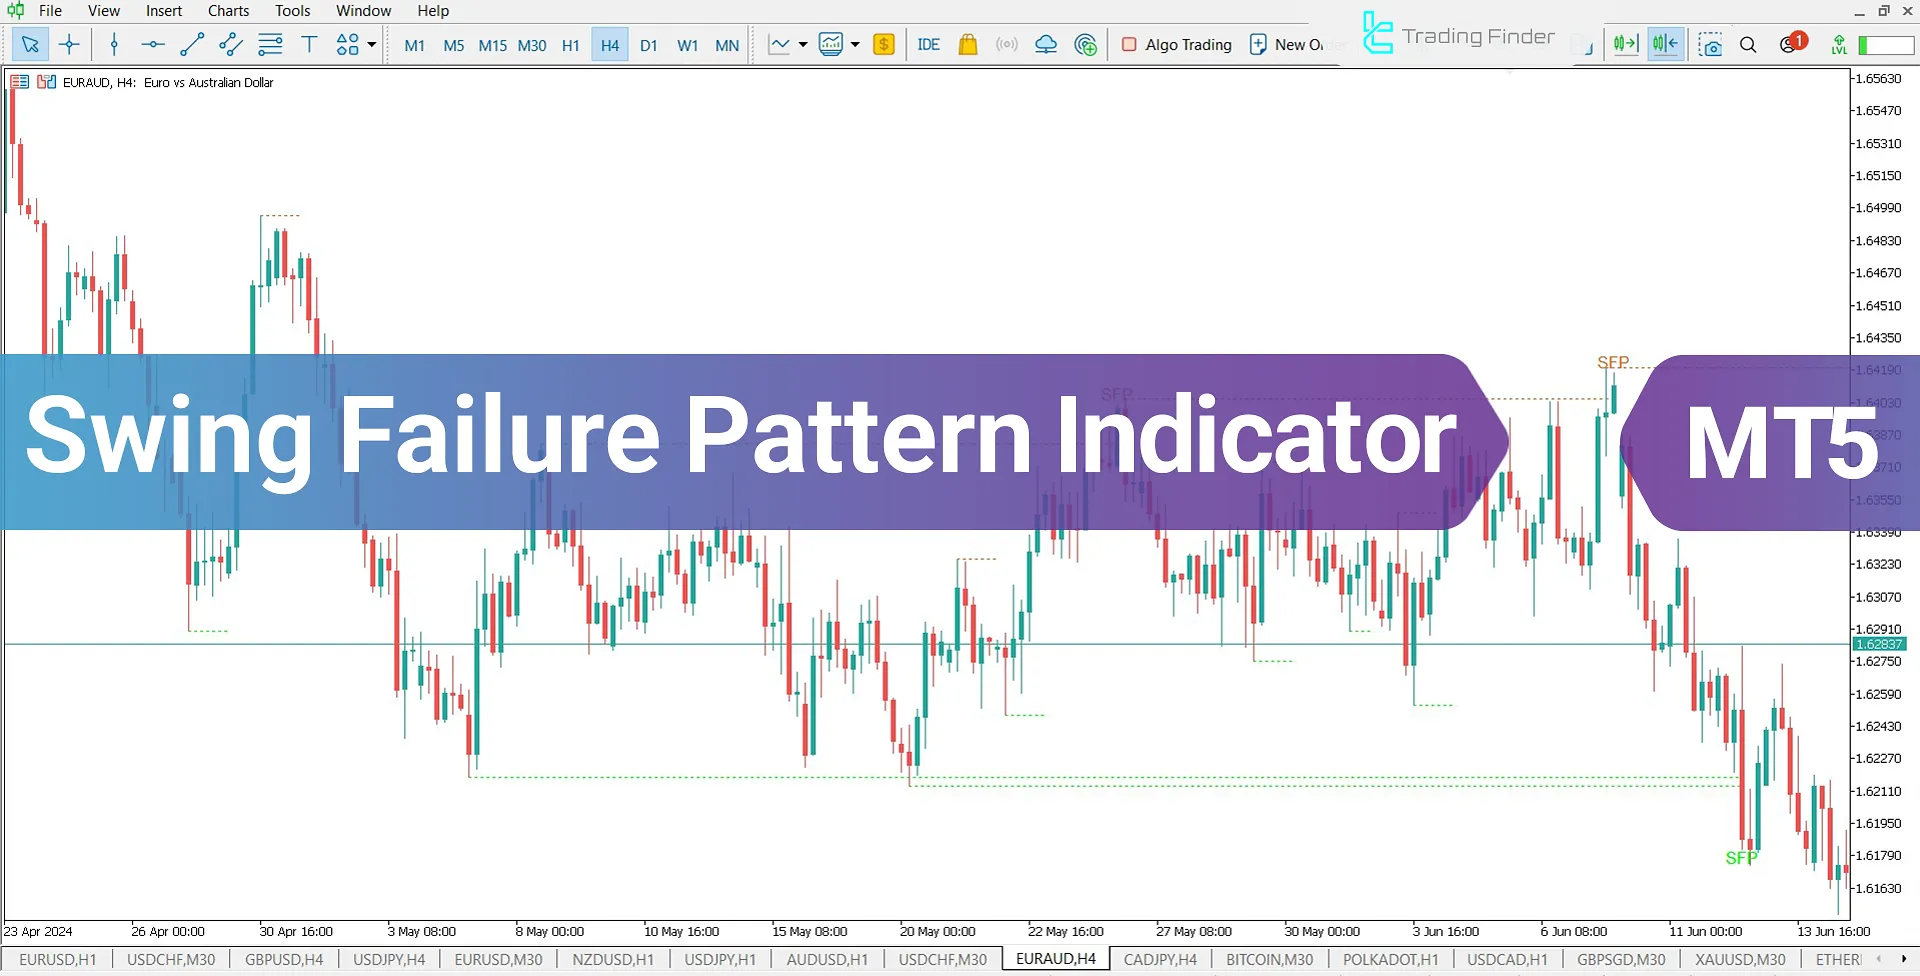
The Swing Failure Pattern (SFP) Indicator in MetaTrader 5 is designed to detect fake breakouts in the market.
This pattern forms when the price temporarily and seemingly breaches critical levels, such as highs or lows, to trigger liquidity and stop-losses. The price then returns to its previous direction, creating a Fake Breakout.
The primary purpose of the SFP pattern is to gather liquidity around key levels like highs and lows. This pattern occurs when the price moves beyond these levels but quickly reverts, indicating a temporary and fake breakout in the market.
Indicator Specifications Table
Category | ICT - Liquidity - Smart Money |
Platform | MetaTrader 5 |
Skill Level | Intermediate |
Indicator Type | Continuation - Reversal |
Time Frame | Multi Time Frame |
Trading Style | Intraday Trading |
Market | Cryptocurrency - Forex - Stocks - Commodities |
SFP Indicator in an Uptrend
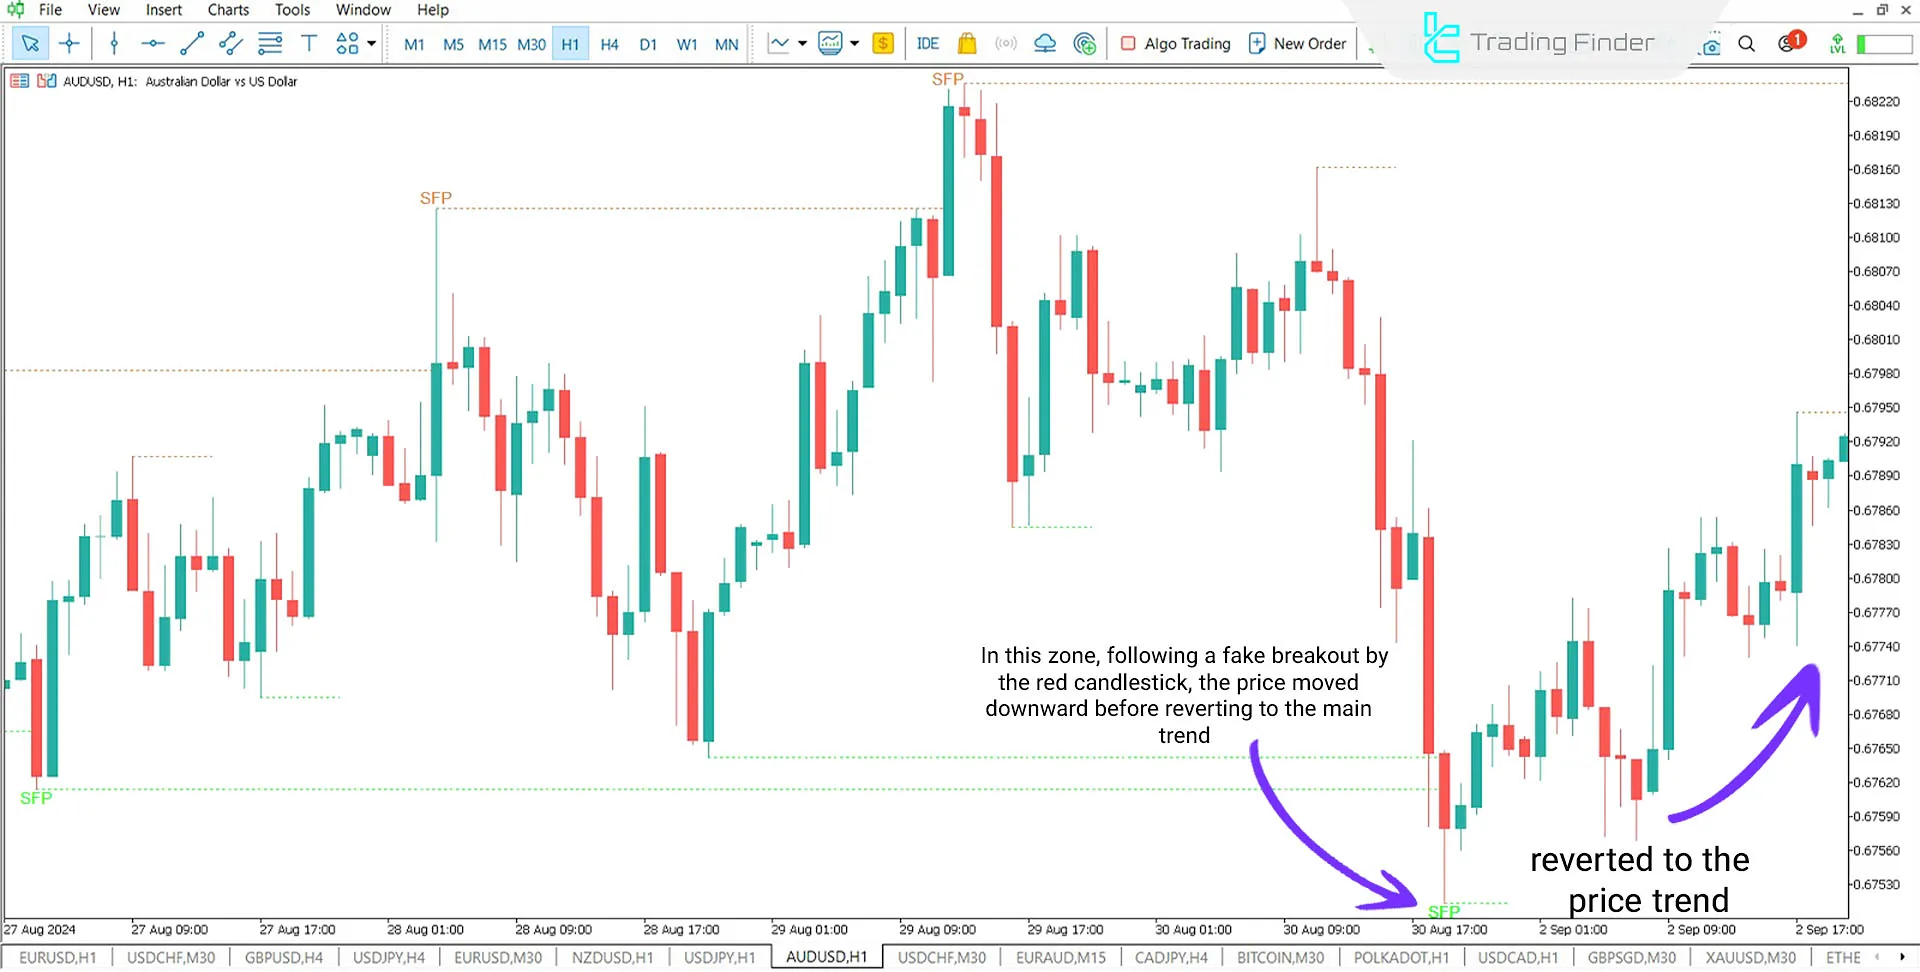
The SFP Indicator identifies past reversal points where the price trend has shifted and marks them on the chart.
For example, in the 1-hour AUD/USD price chart, the price moves towards liquidity gathering and stop-loss activation after a breakout then returns to its primary trend.

SFP Indicator in a Downtrend
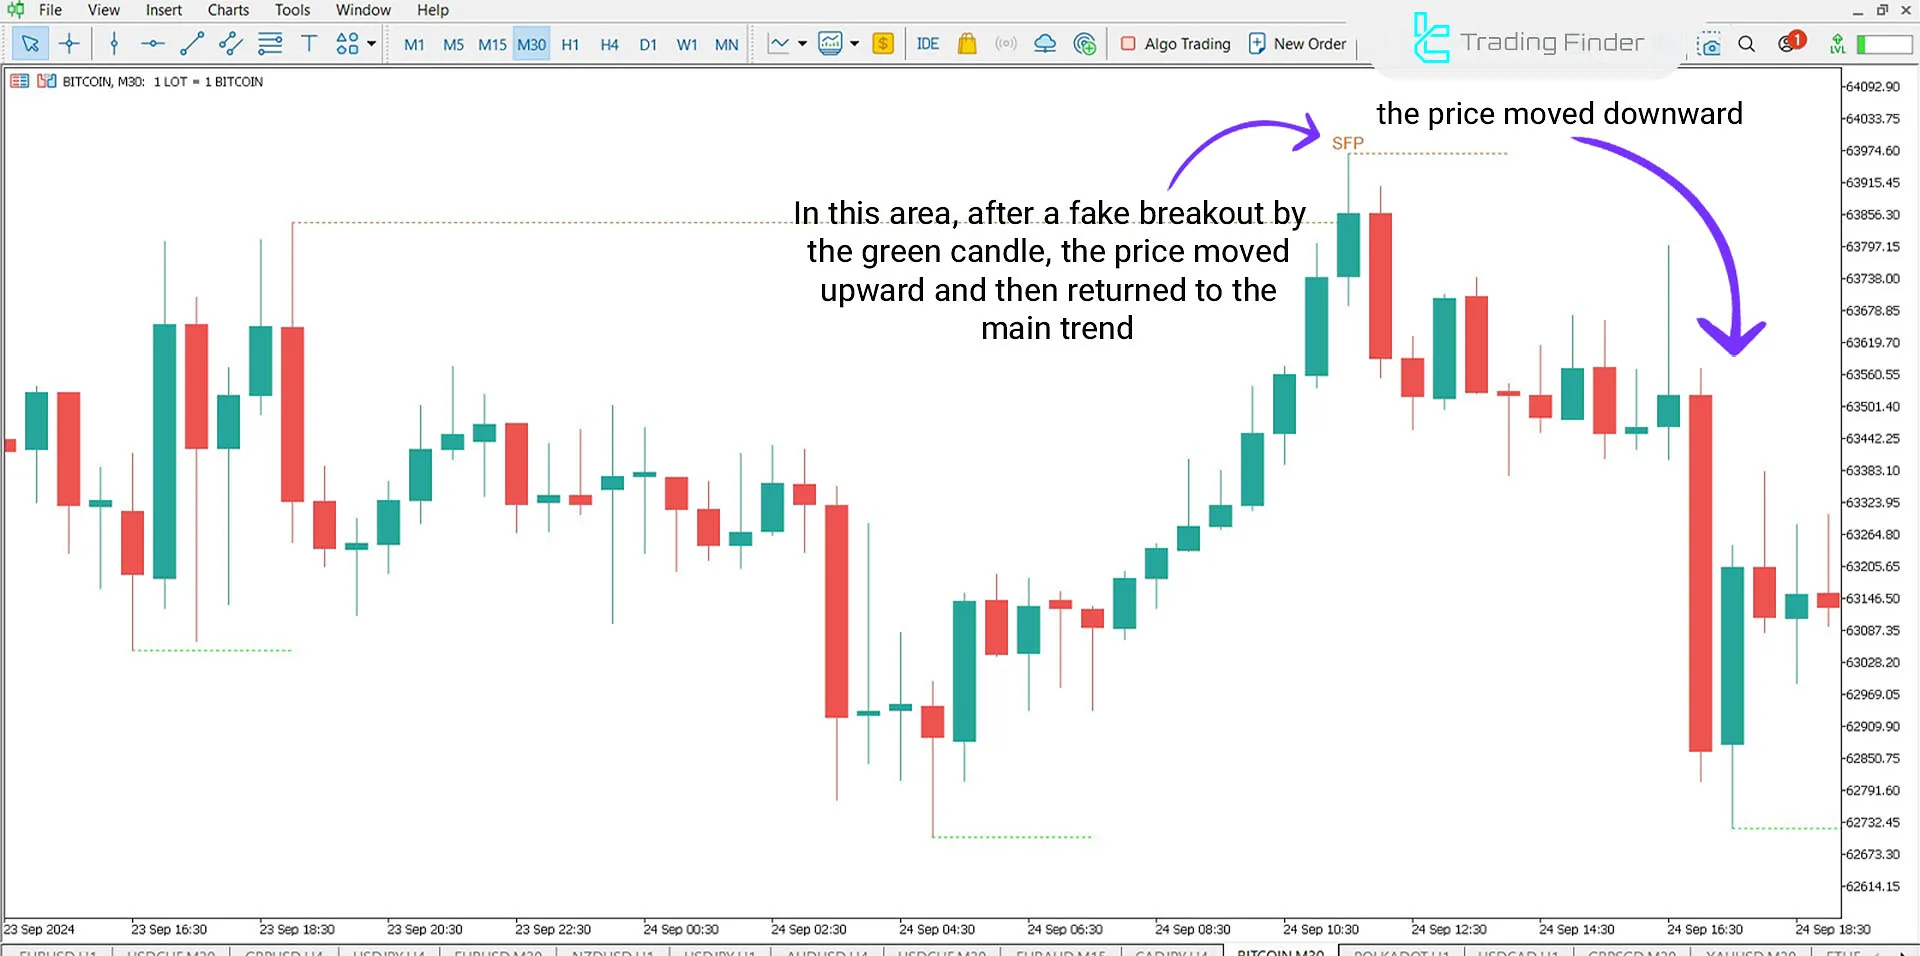
As shown in the image below, the 30-minute Bitcoin (BTC) price chart illustrates the SFP pattern.
In this example, after a breakout, the price forms an SFP high, gathers the necessary liquidity, and returns to its primary trend.

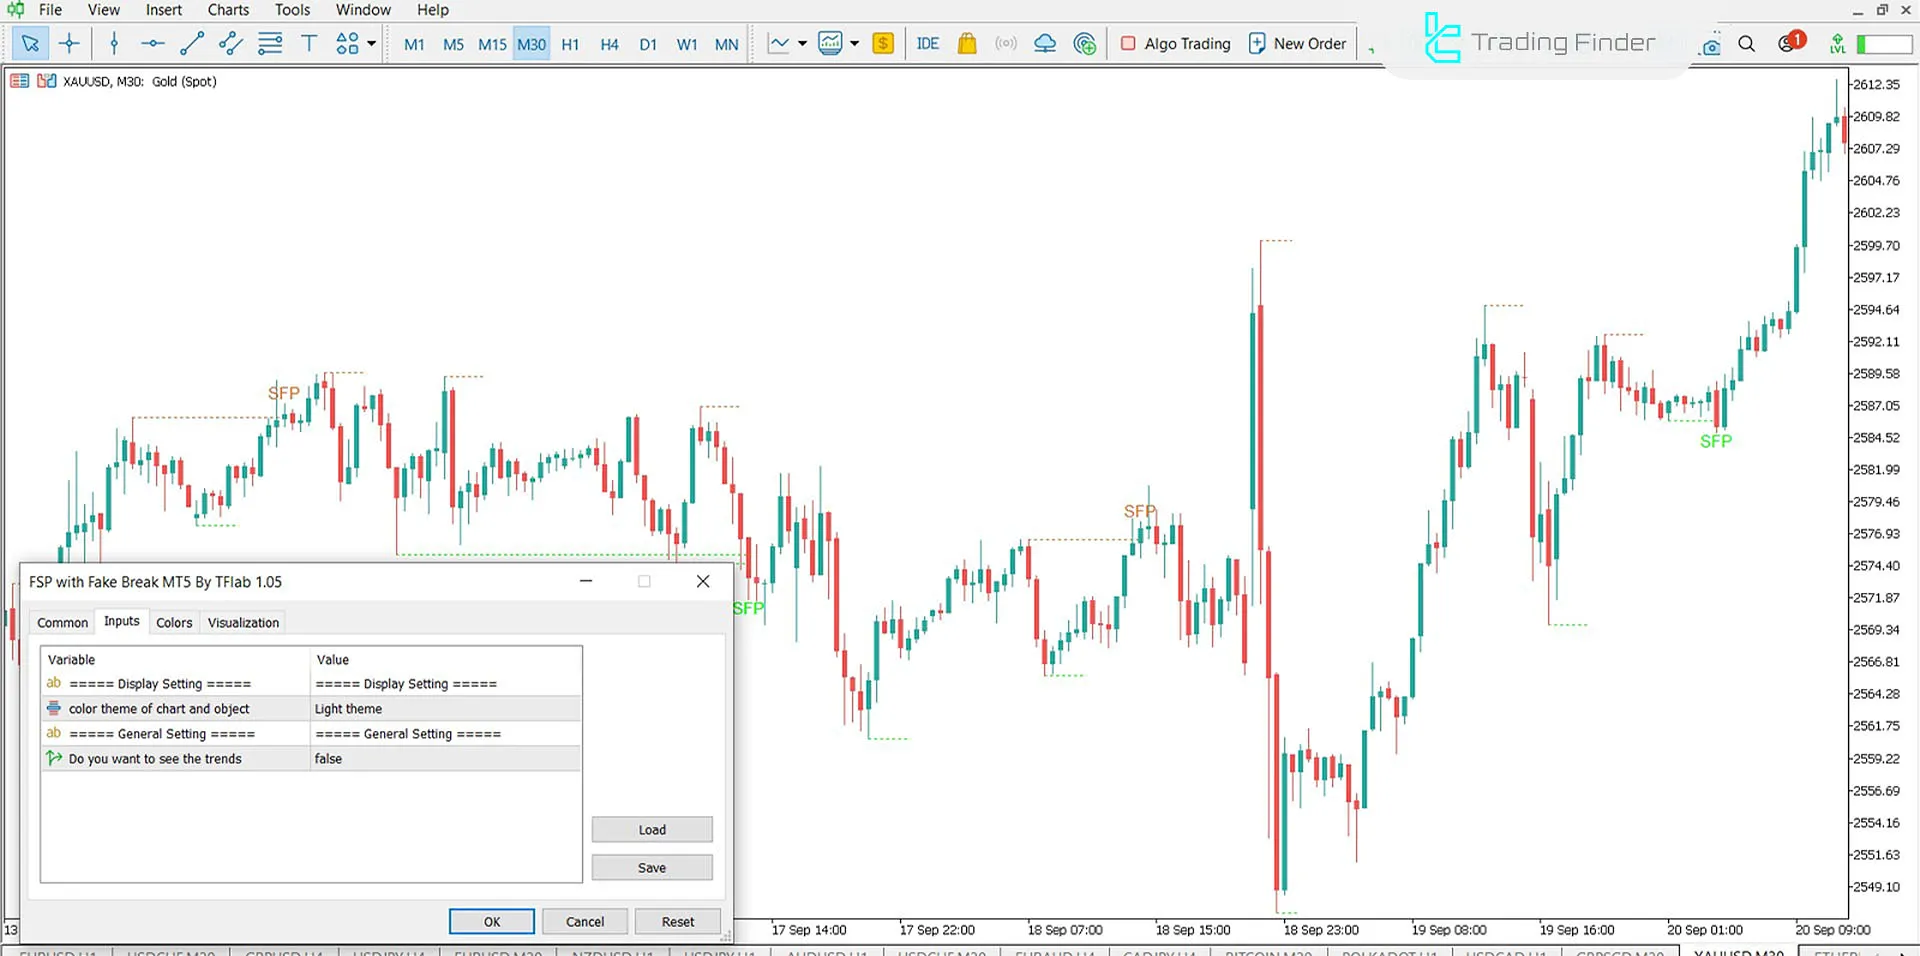
Indicator Settings

- Color theme of chart and object: Background color of the chart;
- Do you want to see the trends: The price trend is on the chart.
Conclusion
The Swing Failure Pattern (SFP) Indicator is a practical tool for traders to identify reversal points and fake breakouts in the market.
By plotting these points on the chart, traders can avoid incorrect trades and capitalize on market swings.
This indicator, especially in uptrends and downtrends, provides clear reversal signals and aids decision-making for ICT, Smart Money, and other liquidity-based trading styles.
Is the SFP Indicator designed only for the forex market?
No, this indicator can be used in various markets, including cryptocurrency, forex, stocks, and commodities.
Is using the SFP Indicator alone sufficient?
While this indicator helps identify reversal points, using it alongside other analytical tools and risk management is recommended.