


- TradingFinder
- Education
- Forex Education
- Price Action Education
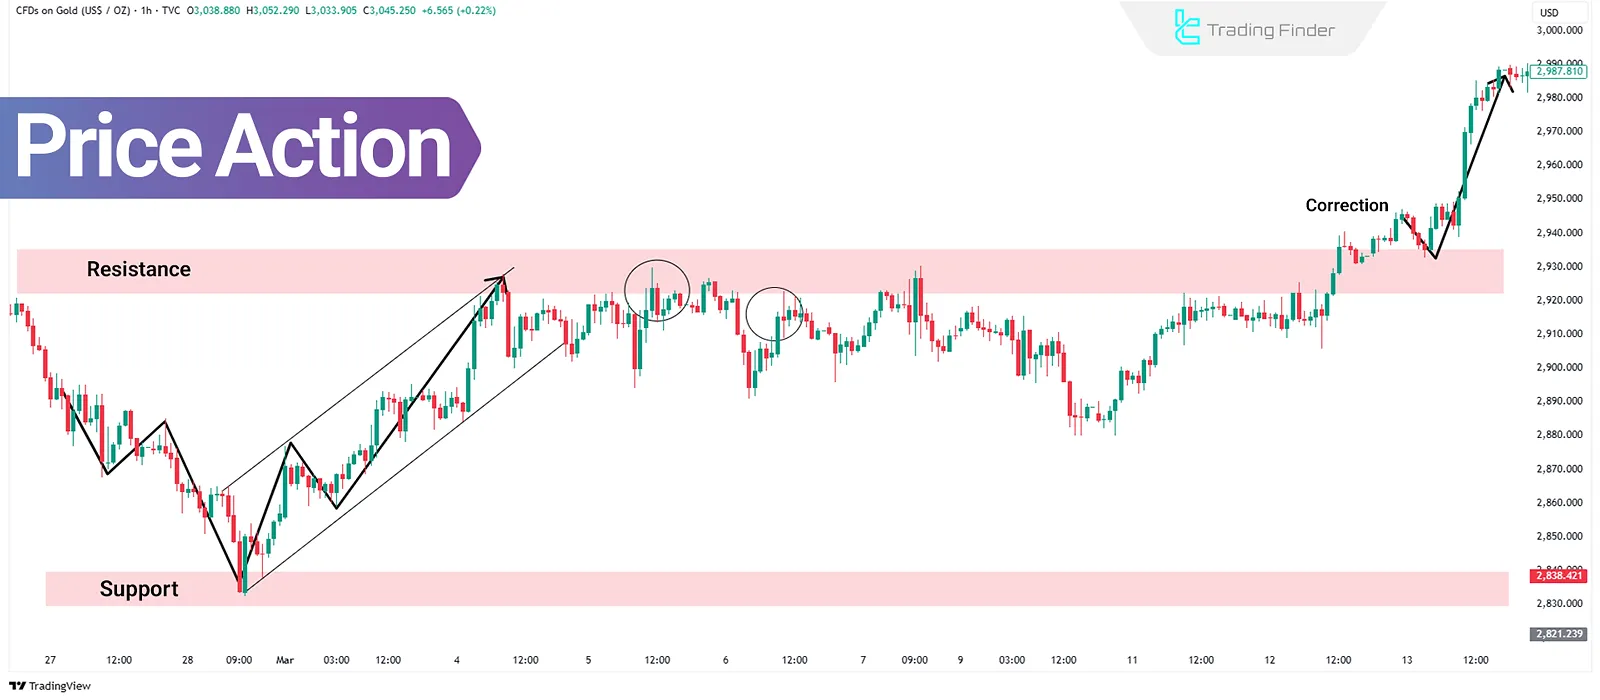
Price Action Education
Price action is one of the most reliable and transparent methods of technical analysis in financial markets, enabling traders to make more precise decisions by focusing solely on the pure price chart without using indicators or trading tools. This method emphasizes the analysis of price patterns, candlestick movements, and the identification of key chart zones, providing traders with an accurate view of market movements through multi-timeframe analysis. In price action, concepts such as pin bars, inside bars, engulfing candles, breakouts, and rejections serve as essential tools for interpreting price movements. Traders can identify optimal entry and exit points by utilizing trendlines and channels, dynamic support and resistance levels, double top and bottom patterns, shadow (wick) analysis, and breakouts. This style also emphasizes trend strength and price retracements, helping traders to trade alongside the dominant market trend and avoid corrective traps.
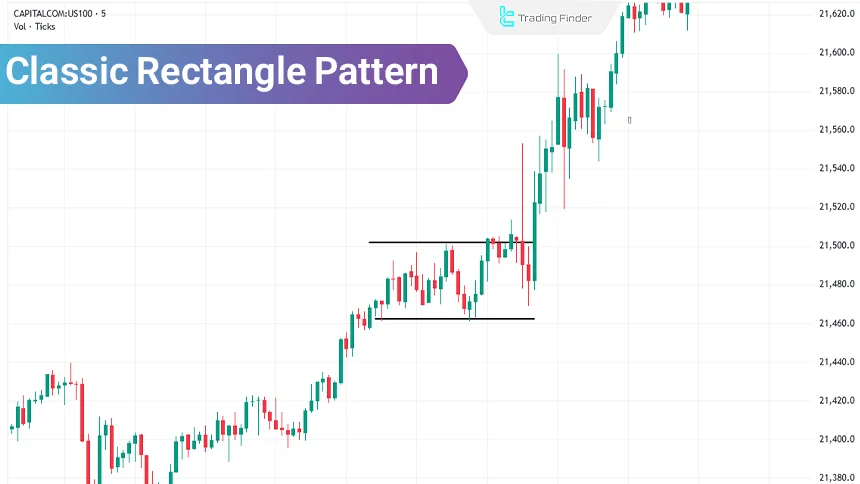
Classic Rectangle Pattern - Trading Strategy Using the Classic Range Pattern
The classic rectangle pattern represents market indecision and an equal balance between buyers and sellers. As a result, this...
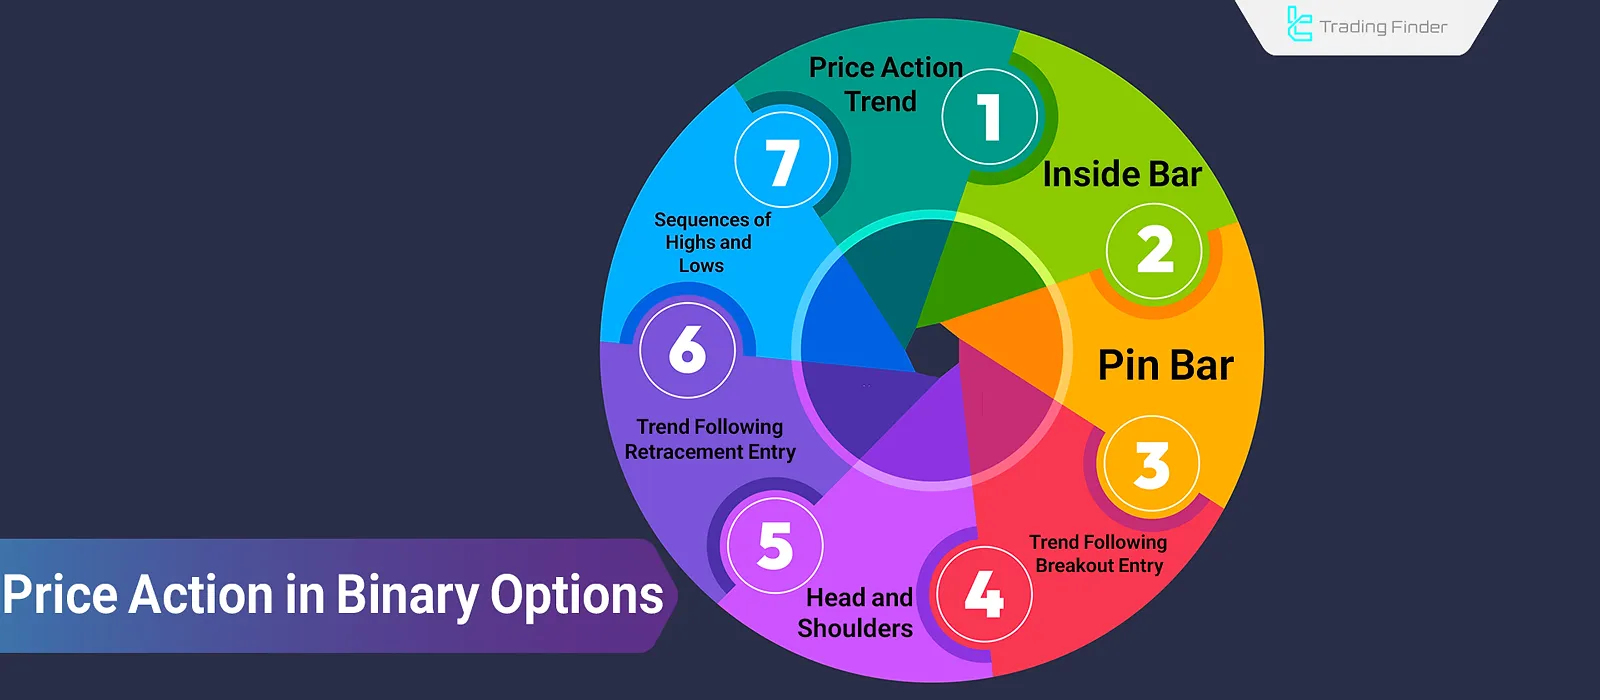
The Best Price Action Strategies in Binary Options; No Delay in Signal Generation
Price action, by directly analyzing price behavior without using lagging indicators, holds a significant position in binary options...
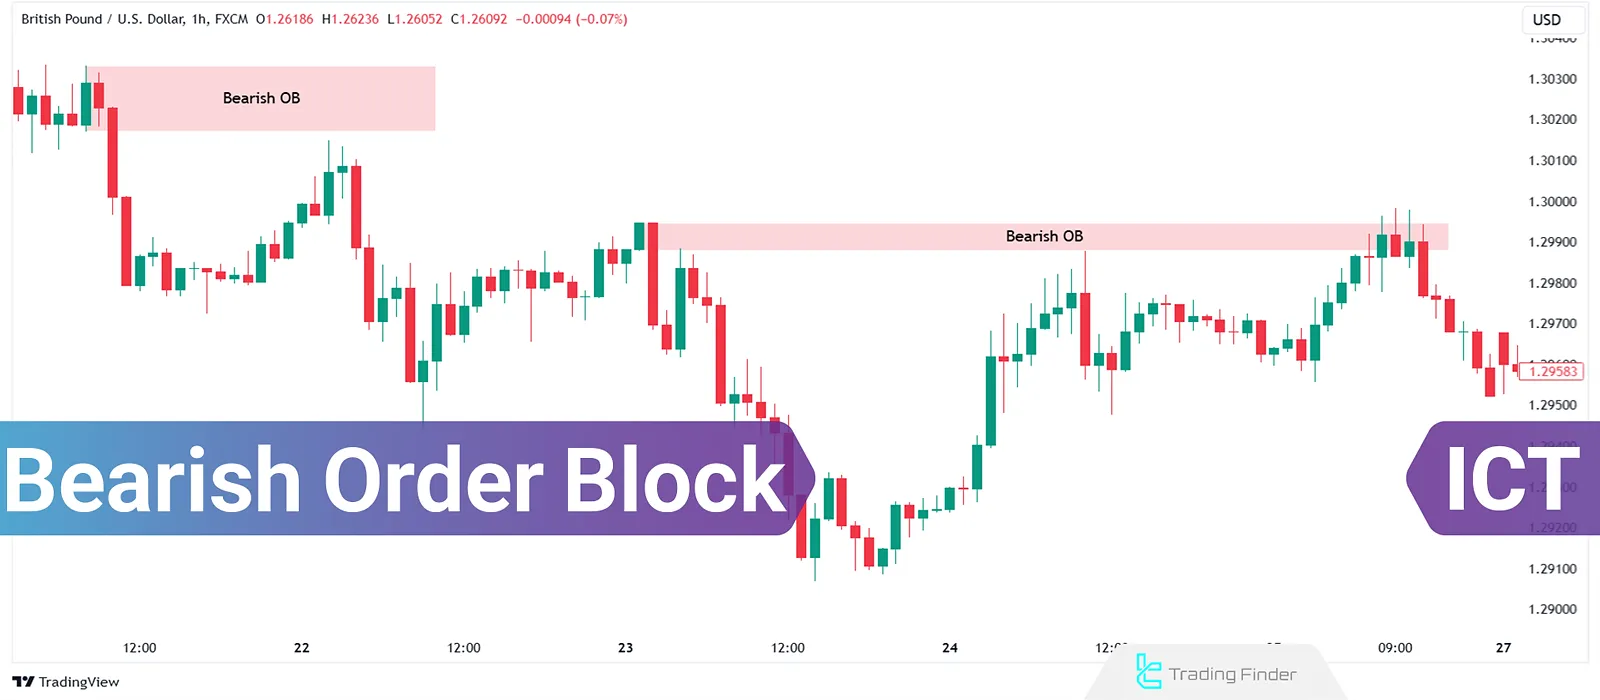
Bearish Order Block: Explained the Ultimate ICT Smart Money Trading Guide
One of the foundational concepts in ICT trading is the Bearish Order Block (OB-), which represents the zones where smart money’s...
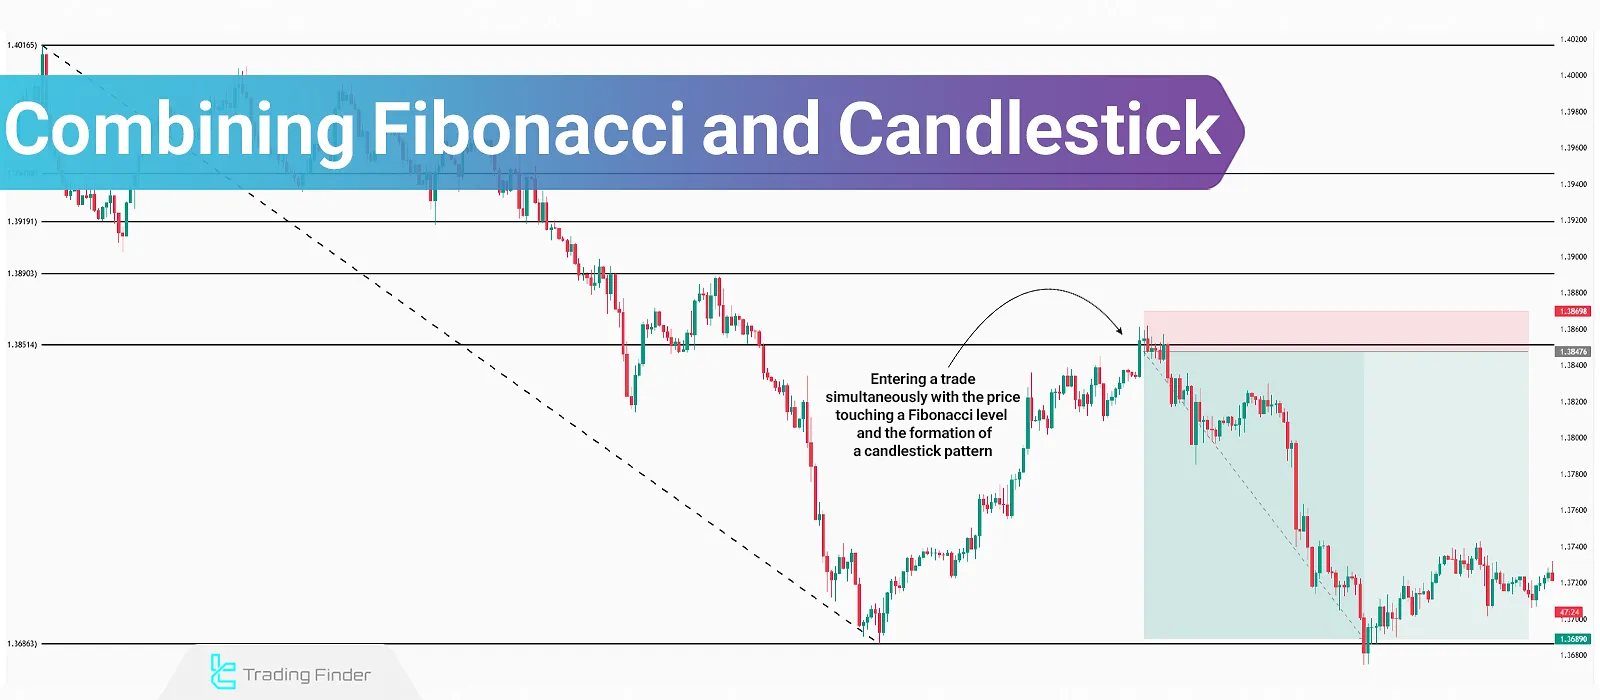
Combining Fibonacci and Candlestick – Best Candlestick Patterns for Fibonacci
The Fibonacci tool offers high compatibility with other technical analysis concepts such as support and resistance, classic...
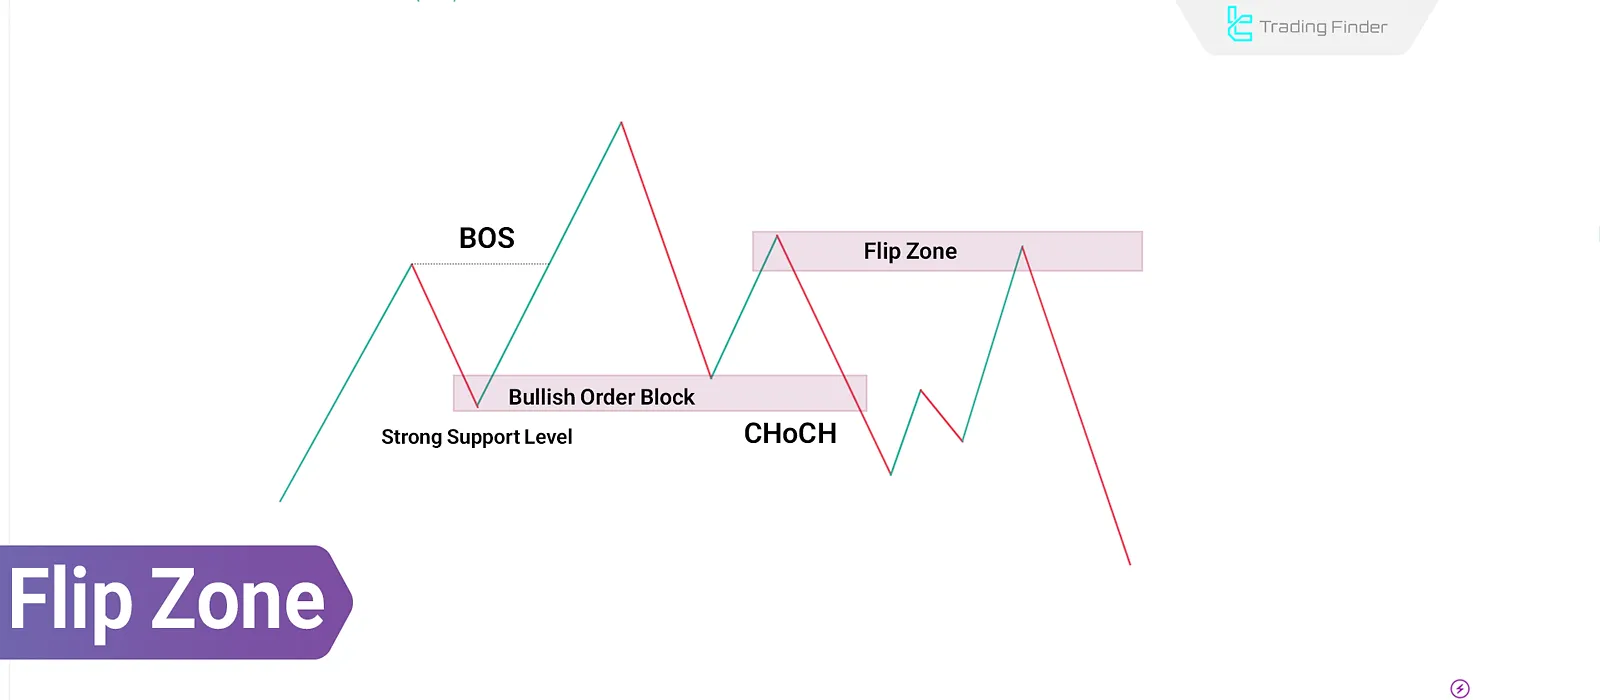
Smart Money Flip Zone & ICT Concept: Using Supply and Demand Levels
In Smart Money analysis and ICT concepts, a Flip Level in ICT is a price level where supply or demand zones are broken and...
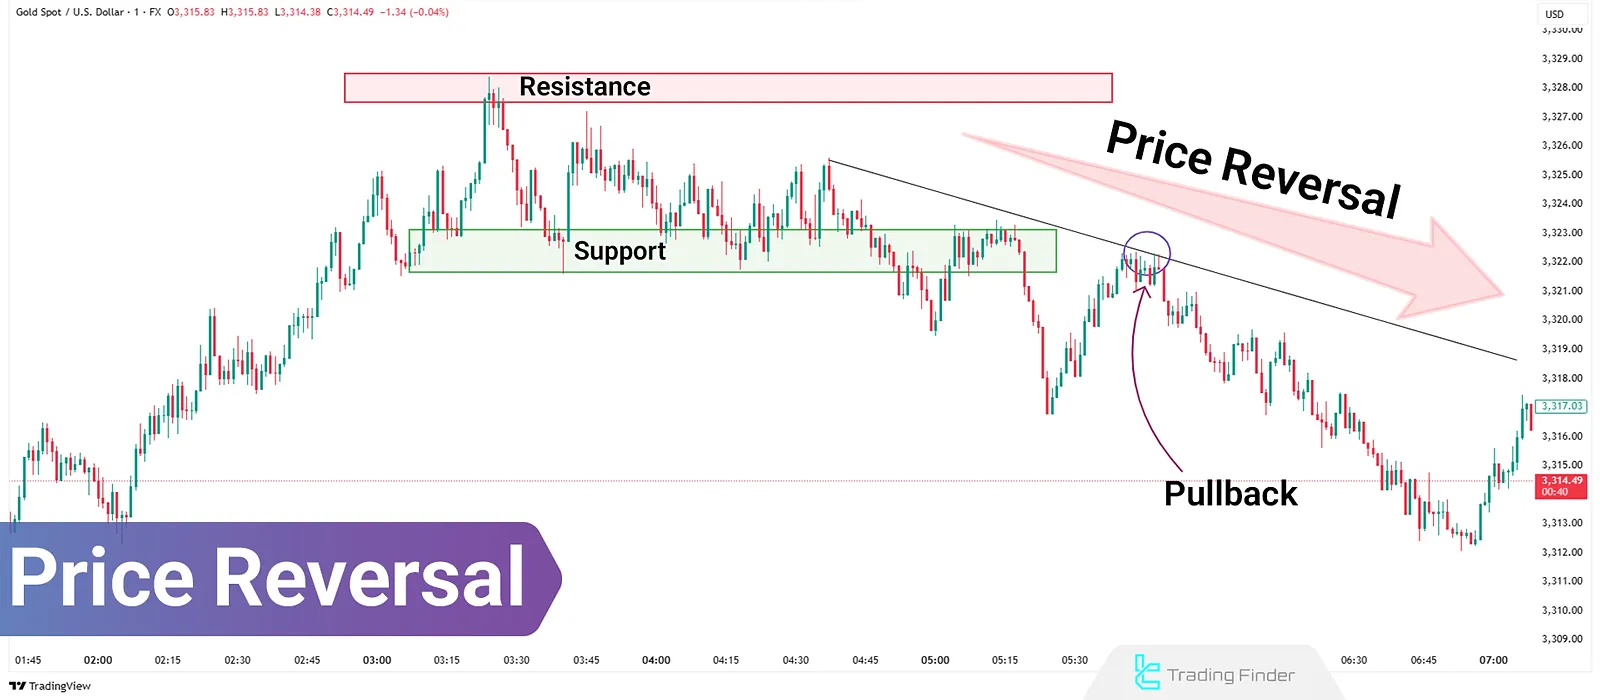
Reversal Trading in Price Action: Candlestick Confirmation and Divergence
In technical analysis, price is constantly changing sometimes moving in a clear direction, sometimes reversing. One of the most...
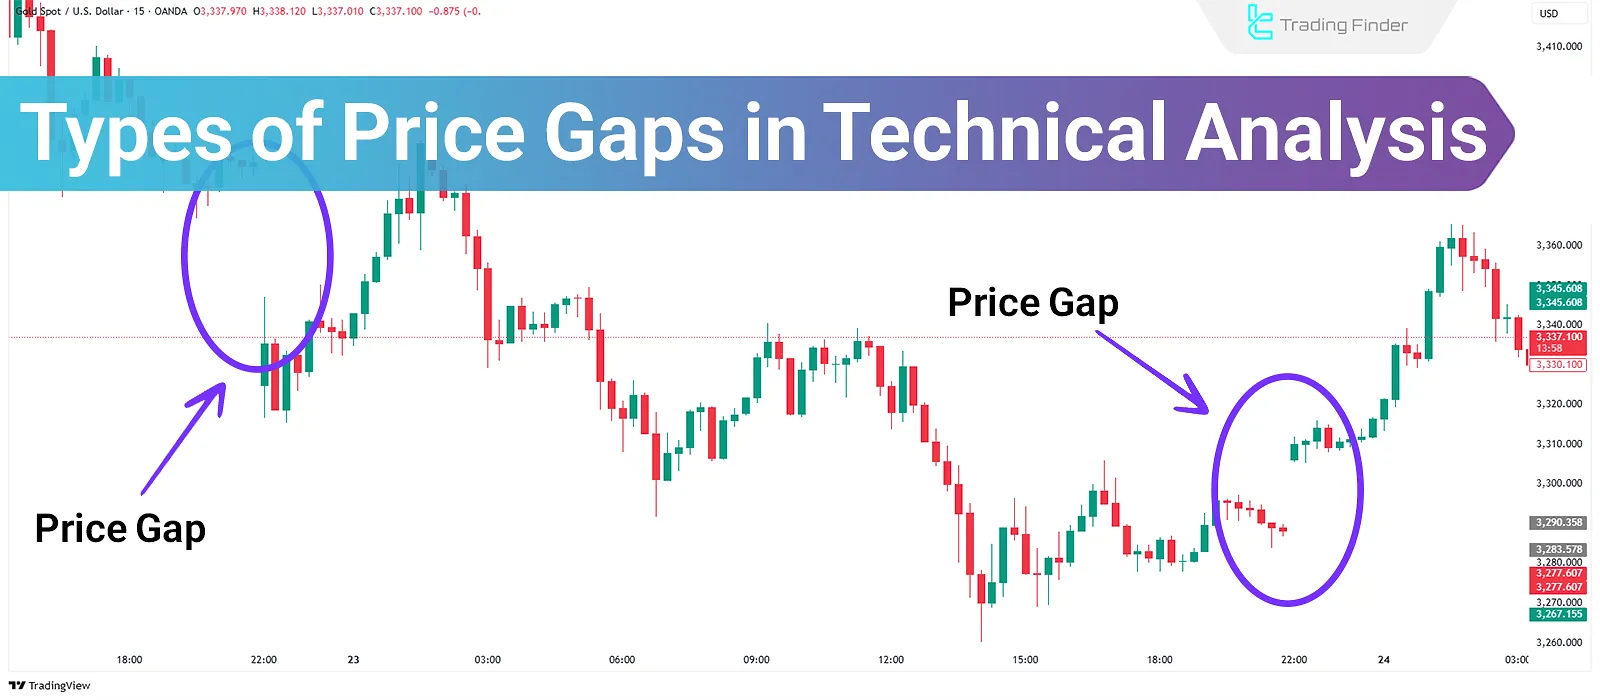
Types of Price Gaps in Technical Analysis – 4 Major Types of Price Gaps
Types of price gaps refer to discontinuities on a price chart where no trading activity has occurred. These types of gaps in...
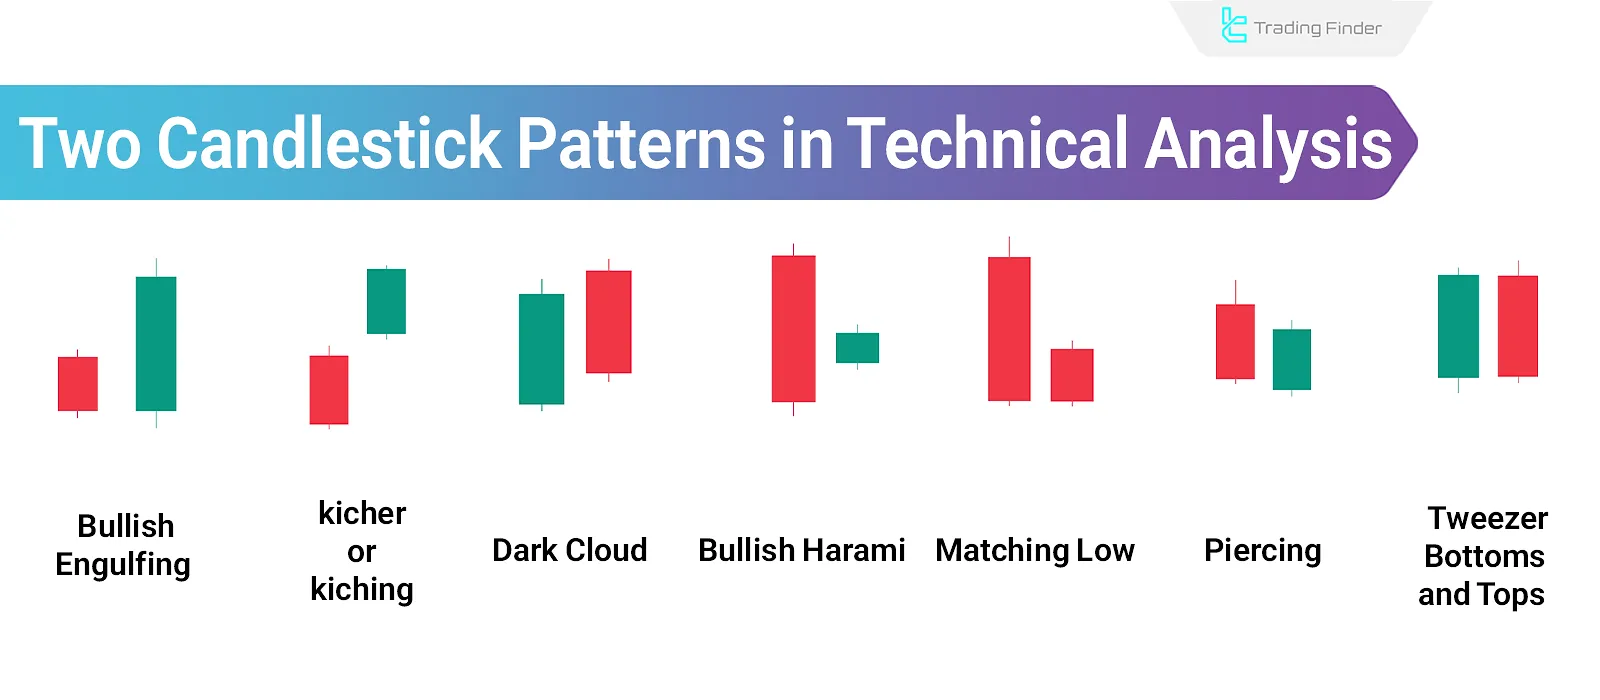
Dual Candlestick Patterns; 9 Important Two-Candle Patterns in Technical Analysis
Dual Candlestick Patterns represent potential trend reversals in the market based on the relationship between two adjacent candles....
Price Action Training: Trend Analysis, Key Levels, Chart Patterns, and Candlesticks
Price Action analyzes price movement without the use of indicators. It focuses on raw price behavior to provide a clear,...
![Draw on Liquidity (DOL) in ICT; [BSL + SSL] Liquidity Levels](https://cdn.tradingfinder.com/image/323843/03-013-tf-en-draw-on-liquidity-01.webp)
Draw on Liquidity (DOL) in ICT; [BSL + SSL] Liquidity Levels
In the ICT Style trading framework, price is constantly drawn toward liquidity pools such as equal highs, equal lows, and clusters...
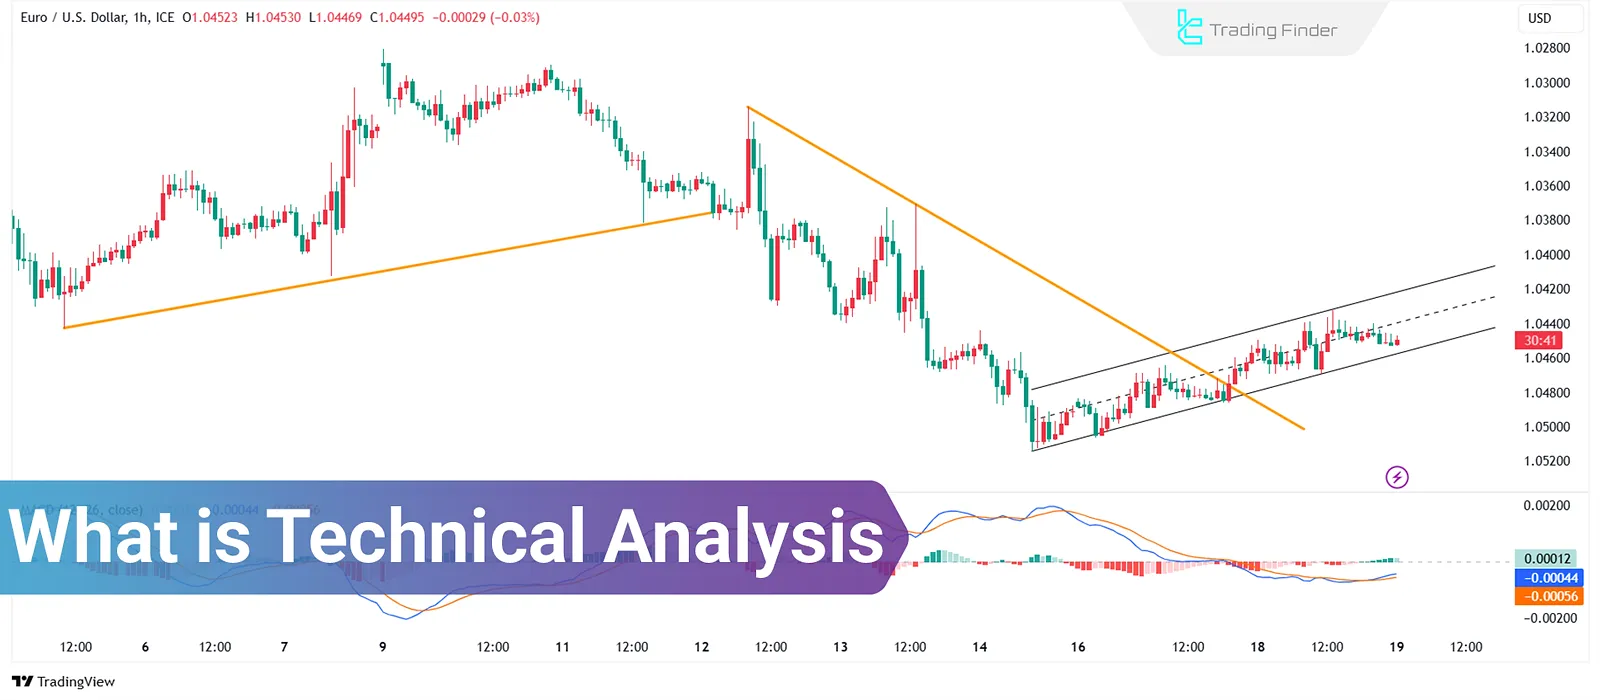
Technical Analysis in Forex: Principles, Support & Resistance + Key Indicators
Technical analysis relies on historical price and volume data to forecast future market movements. This method focuses on price...
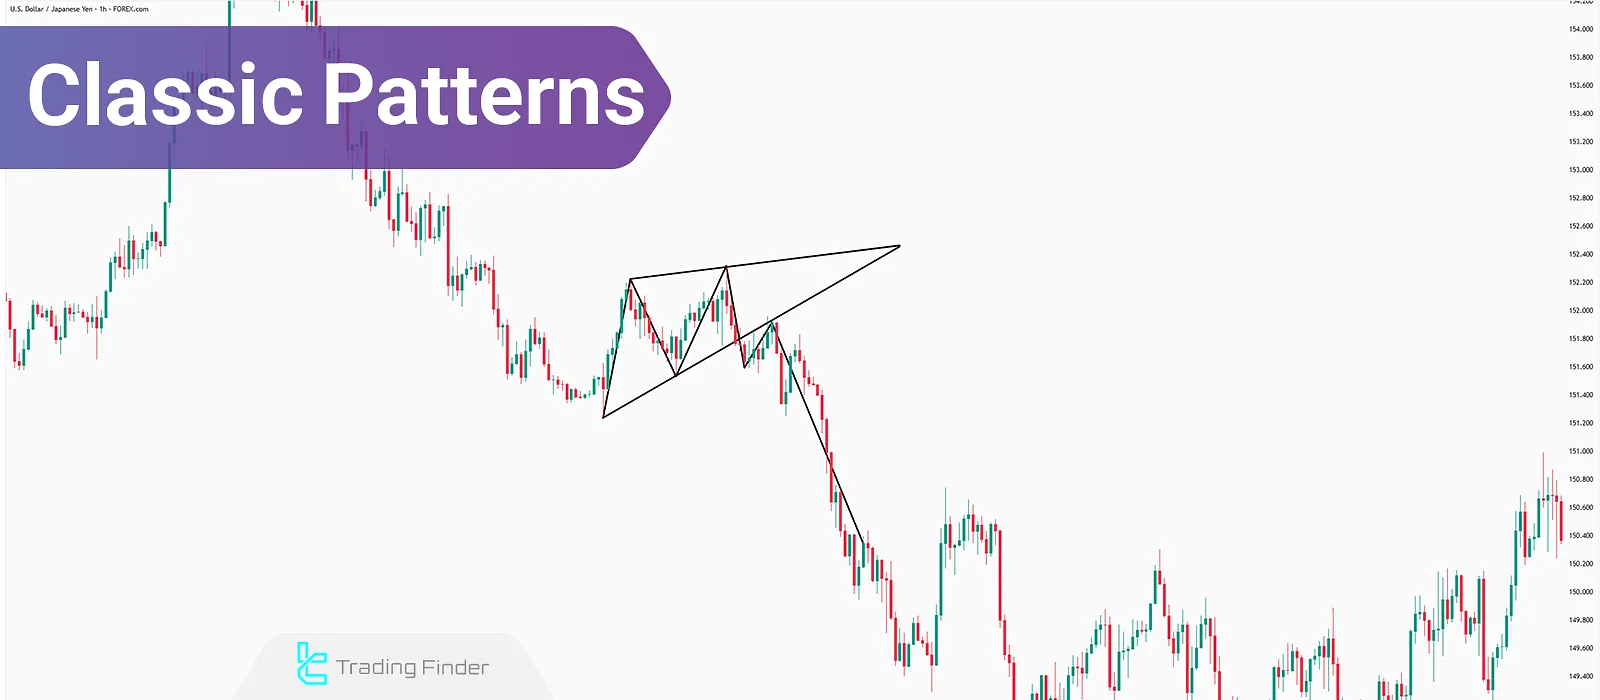
Classic Patterns – The Use of Different Classic Patterns in Technical Analysis
From the alignment of several candlesticks on the price chart, shapes are formed that are known as classic chart pattern in...


