


What is TradingFinder's Fibonacci Calculator Tool?
The Fibonacci Calculator determines retracement and extension levels based on 3 points: High, Low, and Custom. This online tool can be used in various timeframes from one second to 12 months and is applicable to forex, cryptocurrency, and stock markets.
Additionally, all trading styles in short-term, medium-term, and long-term trading are compatible with this calculator.
How to Utilize TradingFinder's Fibonacci Calculator
Follow the next section to receive the tool's output in uptrends and downtrends.
How to Use the Fibonacci Calculator
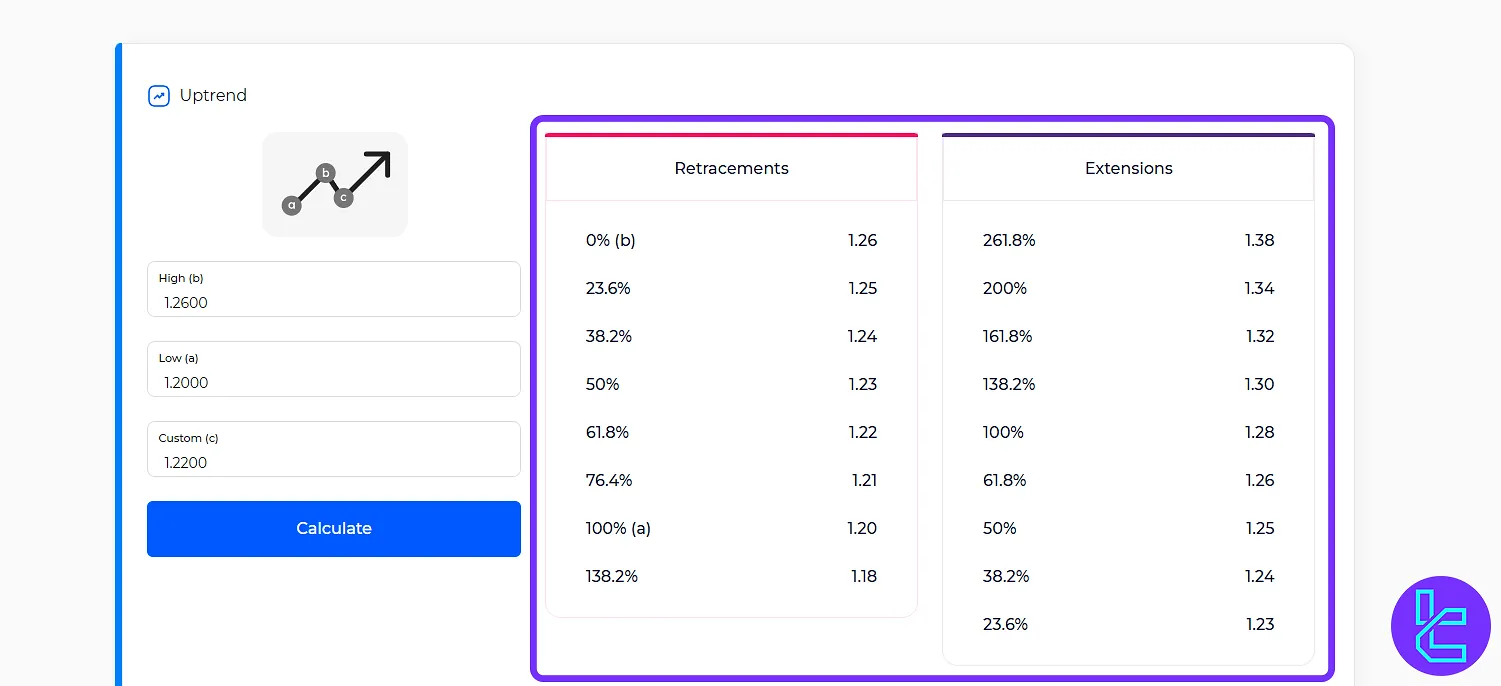
Uptrend:
- Enter the "High" number in the relevant field;
- Type the "Low" value in its related section (Low must be less than High);
- After setting the "Custom" level, click on the "Calculate" option.
Then, the calculator applies Fibonacci ratios to the input numbers, and retracement and extension levels appear next to their corresponding percentages in the two boxes on the right. The "Custom" number will only affect the extension level output.
Downtrend:
The Downtrend section is located below "Uptrend". Using the calculator in this other part is completely the same as it is with Downtrend.

Example of Using the Fibonacci Calculator Tool
Suppose the asset chart is in an uptrend, and you have the following three key points:
- High (b): 2600
- Low (a): 2000
- Entry Point (c): 2300
Now, enter these values into the tool and click the “Calculate” button. The results generated by the tool are as follows:
Understanding Calculator Outputs
In brief, in an uptrend, retracement numbers act as support levels while extension values appear as resistance levels. In a downtrend, the situation is reversed; retracement levels serve as resistance, and extension levels appear as support.
In Which Trading Strategies Can the Fibonacci Calculator Be Used?
The Fibonacci Calculator is useful for calculating both retracement and extension levels.
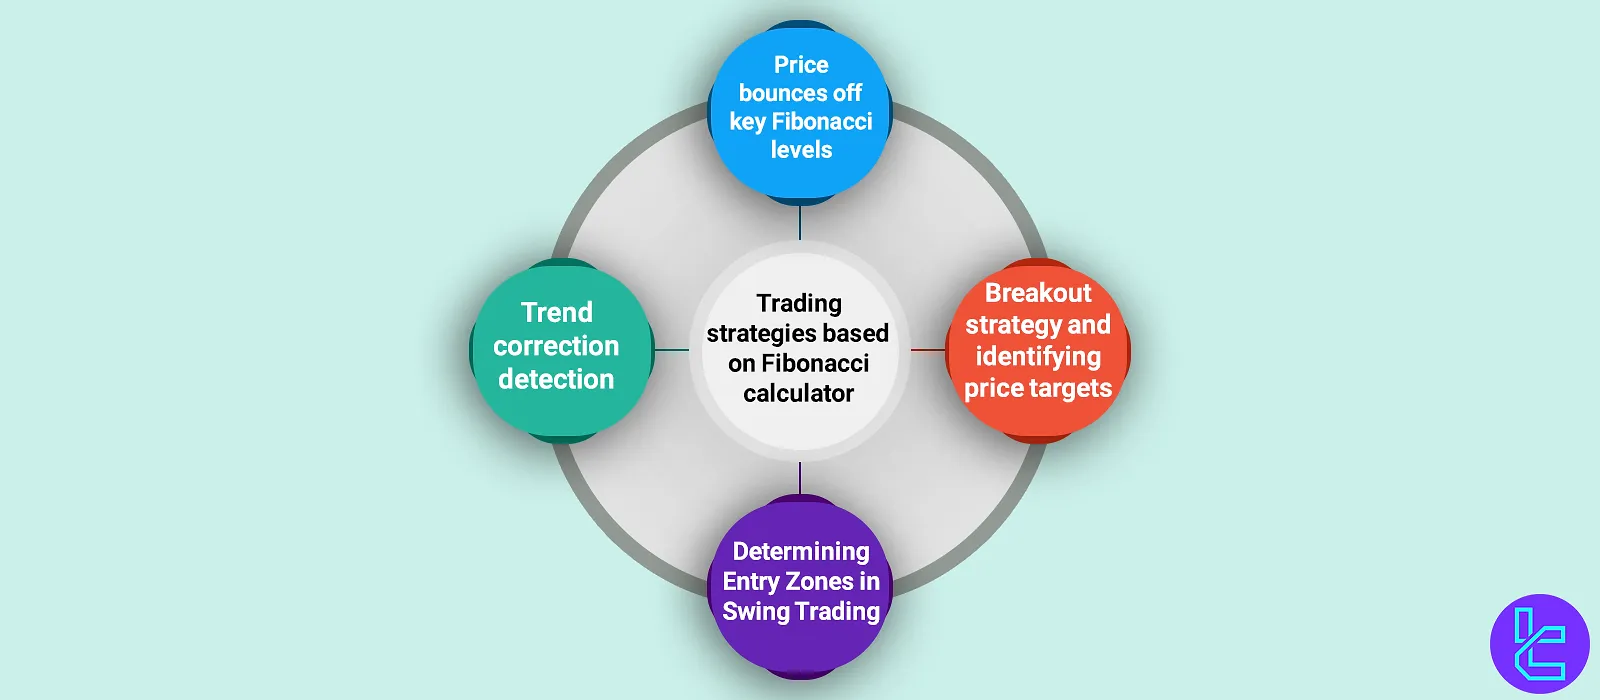
Accordingly, this tool can be applied in the following strategies:
- Pullback Trading: Identifying the end of a price correction at Fibonacci levels such as 38.2% or 61.8%, and opening positions in the direction of the main trend;
- Reversal Trading: Analyzing price reversal from key Fibonacci levels and entering trades in the opposite direction of the prior trend;
- Breakout Trading: Setting price targets using Fibonacci extension levels like 138.2% or 161.8% after breaking through support or resistance zones.
- Swing Trading: Determining entry zones and profit targets in swing movements by using Fibonacci levels around recent highs and lows.
Is the TradingFinder Fibonacci Calculator Downloadable?
No; this tool is not downloadable and must be used on the TradingFinder website. The Fibonacci Calculator is free of charge and accessible on all mobile and desktop browsers.
Fibonacci Calculation Formula
The formula of the Fibonacci sequence and its levels are as follows:
Conclusion
Traders can determine position entry and exit points by considering the support and resistance levels identified by the Fibonacci calculator. Additionally, this tool allows users to set Price Targets.


