


Introduction to the Forex Correlation Tool
In Forex trading, correlation refers to the relationship between the price movements of two trading symbols. The TradingFinder Correlation Tool displays this value in a table with up to 10 columns, expressed as percentages.
How Is Correlation Calculated in the TradingFinder FX Correlation Tool?
Trading Finder uses the Pearson correlation coefficient formula to measure the correlation between different currency pairs. The calculation steps are as follows:
- Data Collection: Daily closing prices of currency pairs are gathered over a defined timeframe;
- Daily Price Change Calculation: The tool computes the daily price changes for each currency pair;
- Applying the Correlation Formula: Using the Pearson correlation coefficient, the tool calculates the correlation level between the price movements of two currency pairs;
- Displaying the Results: Results are displayed numerically in a range from -1 to +1 within the correlation table.
Features of the TradingFinder Correlation Tool
This tool includes the following features:
- Unlimited addition of symbols as table rows
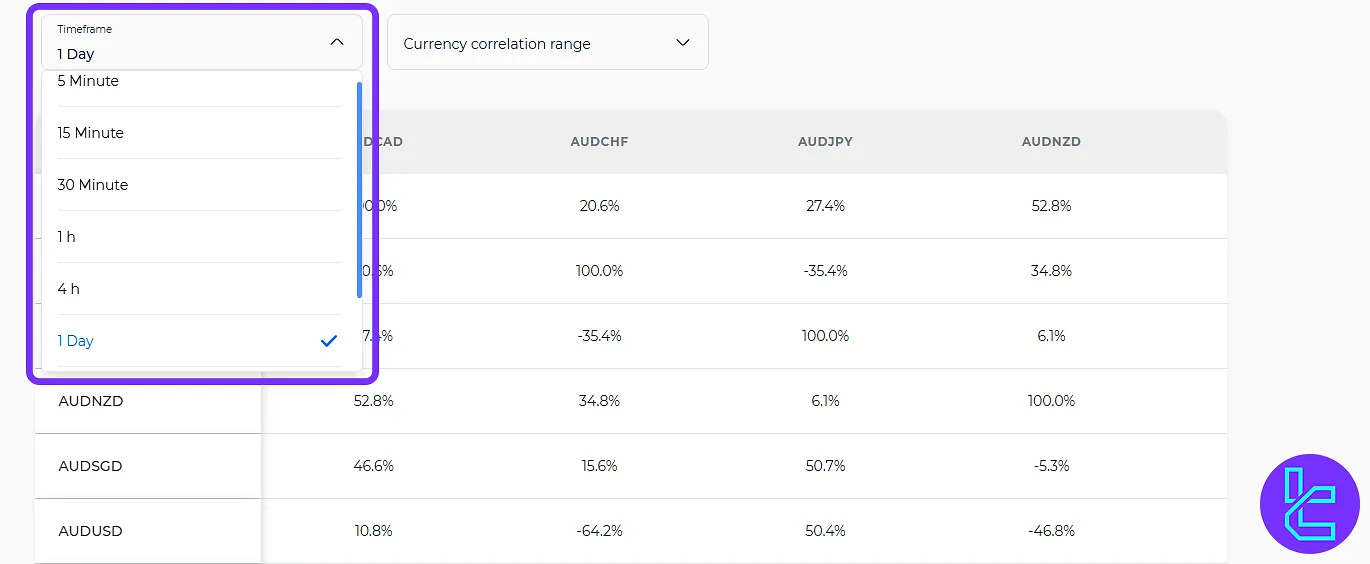
- Timeframe adjustment options: [5 minutes, 15 minutes, 30 minutes, 1 hour, 4 hours, 1 day, 1 week, 1 month]
- Filtering currencies based on minimum/maximum correlation thresholds
How to Use the TradingFinder Correlation Tool
To use the correlation tool, follow these steps:
- Use thesettings button to show the desired currency pairs in the rows and columns;
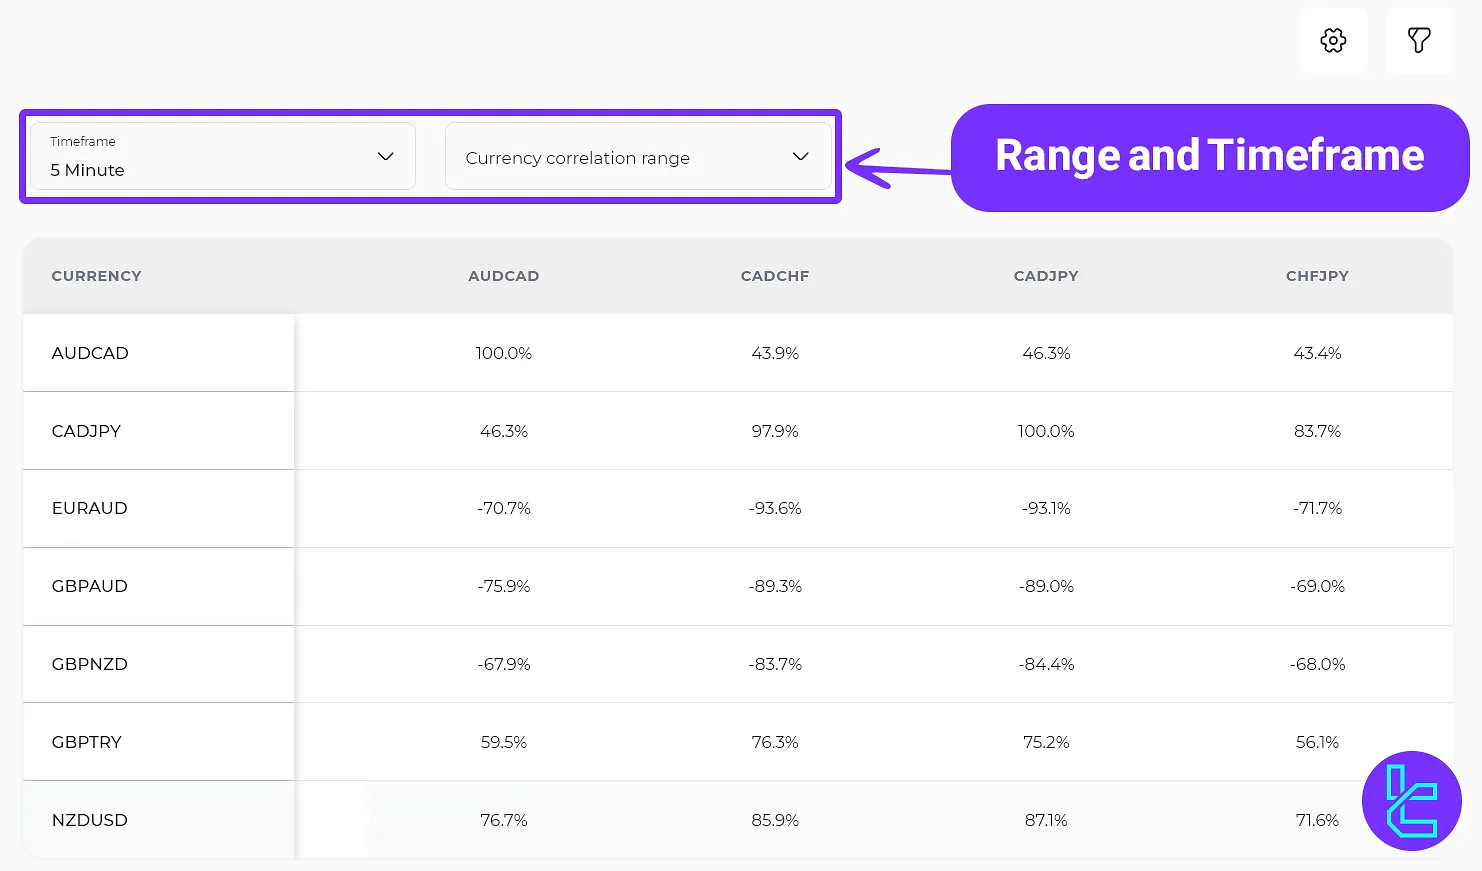
- After selecting the "Filters" option, specify the timeframe and correlation range;
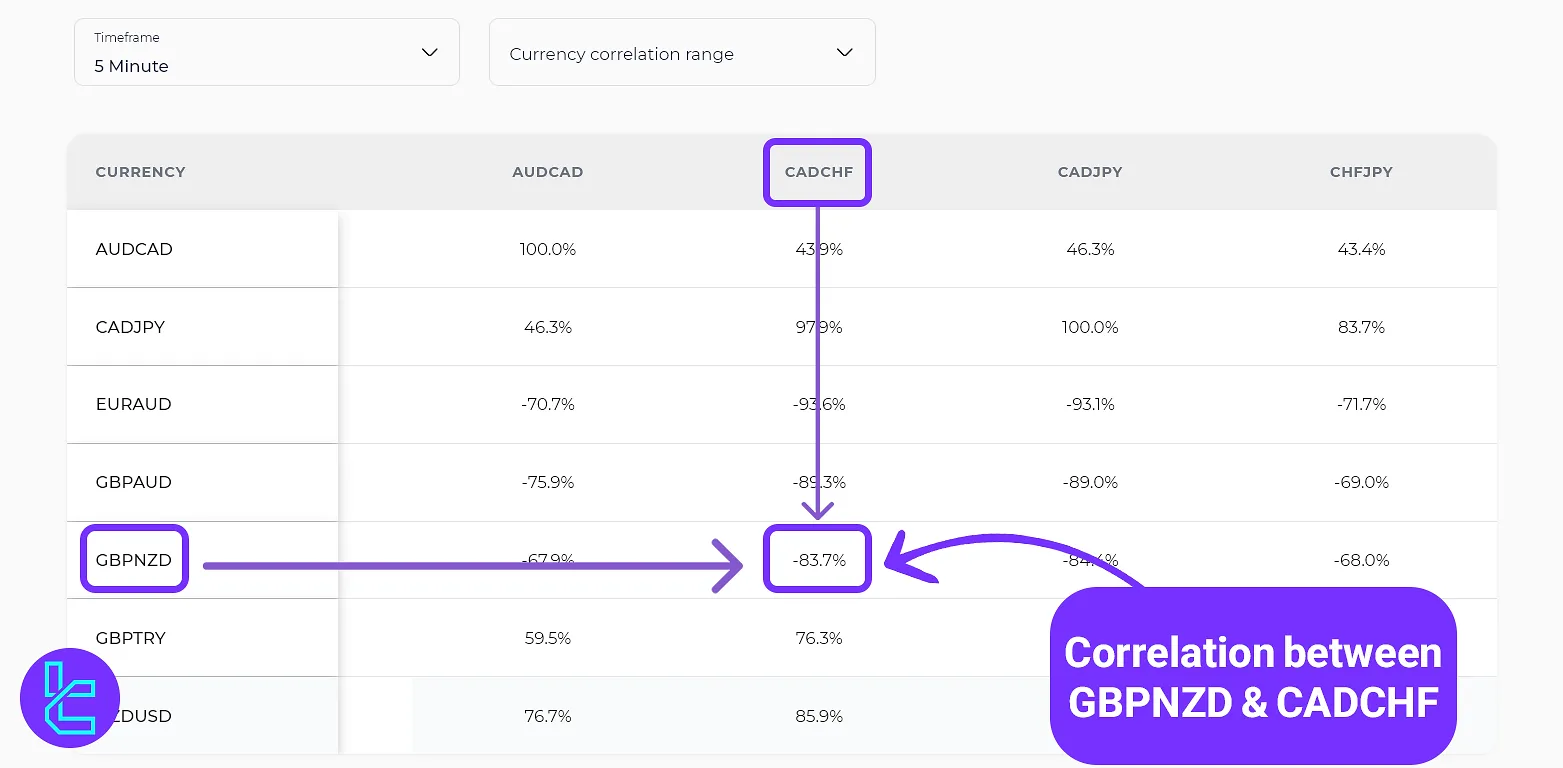
- In the first row (top) and the first column (right), select two symbols and view their correlation value in the middle of the table.
Practical Applications of Forex Correlation for Traders
Understanding correlation values between two symbols can positively impact trading in the following ways:
- Hedging to prevent losses
- Diversifying a portfolio
- Confirming trade decisions
- Avoiding multiple positions in highly correlated currencies
Key Tips for Using the Forex Currency Pair Correlation Tool
To use the Forex Correlation Tool effectively, keep in mind the following points, especially thenon-static nature of correlations:
- Correlation Is Not Constant: The relationship between currency pairs can change over time. Always check the latest data using the TradingFinder tool;
- Pay Attention to Timeframes: Analyze correlation in a timeframe that matches your trading strategy. In the TradingFinder tool, you can view correlation across timeframes from 5 minutes to 1 month;
- Consider Correlation Strength: Strong correlations (close to +1 or –1) are typically more significant than weaker ones.
Correlation-Based Trading Strategies in Forex
The main goal ofcorrelation-based strategies is to profit from the statistical relationships between currency pair price movements.
Here are the most effective correlation strategies:

- Hedging: In this method, the trader selects two currency pairs with a strong negative correlation, buys one and sells the other;
- Correlation Arbitrage: When two historically correlated pairs diverge, traders can enter trades in the opposite direction of the divergence;
- Inverse Correlation Across Timeframes: By analyzing how correlation varies between symbols and timeframes, traders can enter scalping or short-term trades.
Conclusion
The TradingFinder Forex Correlation Tool displays correlation values between asset prices within a range of -100% to 100%. This platform enables users to select from 72 currency pairs and 8 different timeframes (from 5 minutes to 1 month).


