


TradingFinder's Live Heat Map Tool
The TradingFinder's market heat map tool provides access to price changes for major forex currency pairs, gold, and silver; the fluctuations are presented in both pip and percentage formats.
What is a Forex Heat Map?
A heat map is a live visual tool that shows the performance of tradable assets in the forex market using two colors: green and red. TradingFinder's heat map is useful for identifying overall currency pair trends, recognizing asset correlations, and risk management.
Features of TradingFinder's Heat Map Tool
This tool provides all necessary information about asset price changes. Features of TradingFinder's heat map tool:
- Support for major, minor currency pairs, and precious metals
- Information provided across 1-minute, 5-minute, 15-minute, 30-minute, 1-hour, 4-hour, daily, weekly, and monthly timeframes

- Display of highest price increases in green and largest price decreases in red

How to change price fluctuation display format?
To change the display format, simply click on your preferred option; the new format will be applied automatically.

How to Add a Symbol to the Heat Map Tool?
To add a new asset, click on the "Symbol" button; then type the desired symbol name and select it.

The selected symbol will be automatically added to the heat map and displayed at the end of the list.
What Do the Colors in the Market Heatmap Represent?
The colors used in the TradingFinder Market Heatmap are color-coded to reflect market sentiment. The color system is explained as follows:
- Dark Green (Strong Growth): Indicates a significant price increase in the selected timeframe, signaling strong buying pressure;
- Light Green (Mild Growth): Represents a modest price increase;
- Gray or Colorless (Relative Stability): Signals low volatility or minor price changes, typically indicating consolidation zones or market indecision;
- Light Red (Mild Decline): Showslimited price drop, possibly a temporary correction;
- Dark Red (Strong Downtrend): Represents asharp price decline, indicating seller dominance.
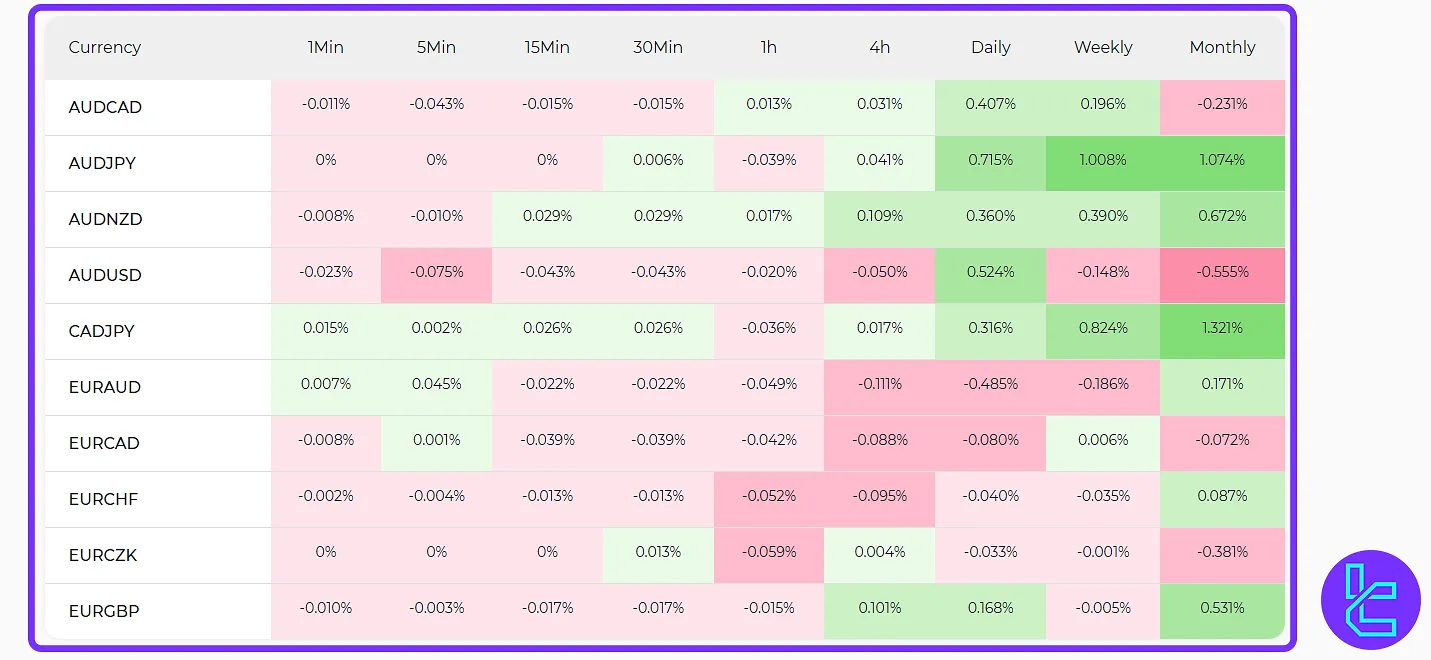
A real example of this heatmap color coding can be seen in the table below:
The currency pair AUD/USD shows a 1.37% increase over the monthly timeframe and is marked in dark green, representing the strongest growth. In contrast, EUR/GBP declined by 1.212% in the same period and appears in dark red, indicating the largest drop.
Where Does the TradingFinder Market Heatmap Get Its Price Data?
The TradingFinder Market Heatmap collects its pricing data from leading Forex market makers. These sources include real-time data feeds and direct pricing from reputable broker servers.
All data is retrieved through optimized APIs with minimal latency, ensuring that the market heatmap remains accurate, up-to-date, and reliable.
Conclusion
The TradingFinder Market Heatmap Tool visualizes the price movements of 20 different assets using a color gradient from dark green to dark red, where each color represents the degree ofprice increase or decrease.
Price fluctuations can be viewed in both percentage and pip formats, offering a comprehensive and real-time perspective of market activity.


