


In fundamental analysis in cryptocurrency, on-chain metrics (such as on-chain data), market capitalization and token supply, whitepaper and development team, regulatory status, macroeconomic conditions, and general sentiment in financial markets are evaluated.
This type of analysis can be used alongside technical analysis to understand the intrinsic value of cryptocurrencies, forecast long-term trends, and choose the best projects.
Moreover, fundamental analysis guides the investor to evaluate the sustainability of the project’s economic model, the level of the token’s real-world utility, and the alignment of developers’ goals with users’ interests.
This issue plays a key role in distinguishing fundamentally strong projects from purely hype-driven schemes and reduces decision-making risk under volatile market conditions.

Stages of Fundamental Analysis of Cryptocurrency Step by Step
To achieve practical and reliable results in the fundamental analysis of cryptocurrencies, project evaluation must be conducted based on a structured and coherent framework.
Analysis without a defined framework leads to data fragmentation, misinterpretation of information, and ultimately emotional and non-systematic decision-making.
Below are the step-by-step stages of crypto fundamental analysis:
#1 Identifying the Nature of the Project
At the beginning of the analysis process, the type of project is determined precisely in order to clarify whether it falls under an independent coin with its own blockchain (Coin/Blockchain), a token built on another blockchain (Token), or a DeFi protocol.
This classification defines the analytical path and focuses the evaluation on variables, data, and indicators that are most closely related to the project’s technical structure and operational model.
#2 Reviewing the Project’s Whitepaper and Roadmap
At this stage, the project’s whitepaper and overall objectives are examined in depth and in a structured manner in order to accurately identify the core problem the project aims to solve and determine the degree of alignment with real market needs.
This assessment shows the level of technical and economic feasibility, sustainability, and scalability of the proposed solution, and whether the presented model is compatible with actual market operating conditions.
For further review and better understanding, the educational article on how to read a whitepaper on the onekey.so website can be used.

#3 Evaluating the Development Team, Investors, and Strategic Partners
The professional background of the cryptocurrency development team, their level of experience in the blockchain field, operational transparency, and commitment to the roadmap determine the project’s position from an executional and managerial perspective.
Subsequently, the presence of reputable investors and strong business partners enhances the project’s credibility and increases the likelihood of continued development, long-term stability, and structural progress.
#4 Analyzing Tokenomics and Supply Structure
In this section, the project’s tokenomics structure, including token distribution, use cases, incentive model, and token release schedule, is examined.
This analysis identifies and evaluates potential risks such as sudden selling pressure, disruption of supply and demand balance, and the effects of the vesting schedule (Vesting) on the project’s price stability.
#5 Reviewing On-Chain Data and the Level of Real Usage of the Project
Analyzing on-chain (On-Chain) indicators related to the project provides an accurate picture of network activity, number of users, transaction volume, and the level of actual product usage.
These data determine whether the project has remained at the level of ideas and marketing or has achieved real adoption and practical usability within the market ecosystem.
The educational video from the CoinGecko YouTube channel provides additional explanations regarding on-chain analysis of cryptocurrencies, which can be viewed.
#6 Analyzing Macro Conditions and Market Sentiment
In the final stage, macroeconomic conditions, the state of traditional financial markets, and the overall sentiment of the cryptocurrency market are examined in an integrated manner.
The output of fundamental analysis, alongside technical analysis, forms the basis for more precise decision-making in determining the timing of entry, holding, or exit from a digital asset.
This step-by-step approach reduces the probability of error and transforms fundamental analysis from a purely theoretical review into a practical and reliable tool for investment decision-making.
Whitepaper and Project Roadmap
The whitepaper is the official and technical document of a project that is published by its development team. Reviewing a cryptocurrency whitepaper includes comprehensive information about the project’s idea, objectives, and roadmap.
Components of a whitepaper include:
- Introduction: Explanation of the problem the project seeks to solve and the needs it addresses, followed by a brief introduction to the project and its approach to solving the issue;
- Technology and Architecture: Technical overview of the project, consensus mechanism (PoS or PoW), and network security model;
- Tokenomics: Maximum token supply, distribution plan and timeline, along with an explanation of the token’s utility within the ecosystem;
- Governance Model: How decisions are made in the network (centralized or decentralized), as well as the development model over time, and the update roadmap;
- Development Team: Introduction of key team members and business partners;
- Roadmap: Timeline of project progress stages, including short-term and long-term goals;
- Regulatory and Legal Status: Legal standing of the project in various countries, as well as adherence to KYC and AML regulations.
How to Analyze a Whitepaper?
Analyzing a whitepaper and understanding the idea, solution, and development team is one of the most essential steps in fundamental analysis in cryptocurrency.
To analyze a whitepaper, close attention must be paid to the problem the project aims to solve, the degree of innovation and feasibility of the proposed solution, the transparency of the roadmap and tokenomics, as well as the background and credibility of the development team.
Because a strong whitepaper usually indicates realistic planning, clear goal-setting, and the project’s commitment to long-term execution.
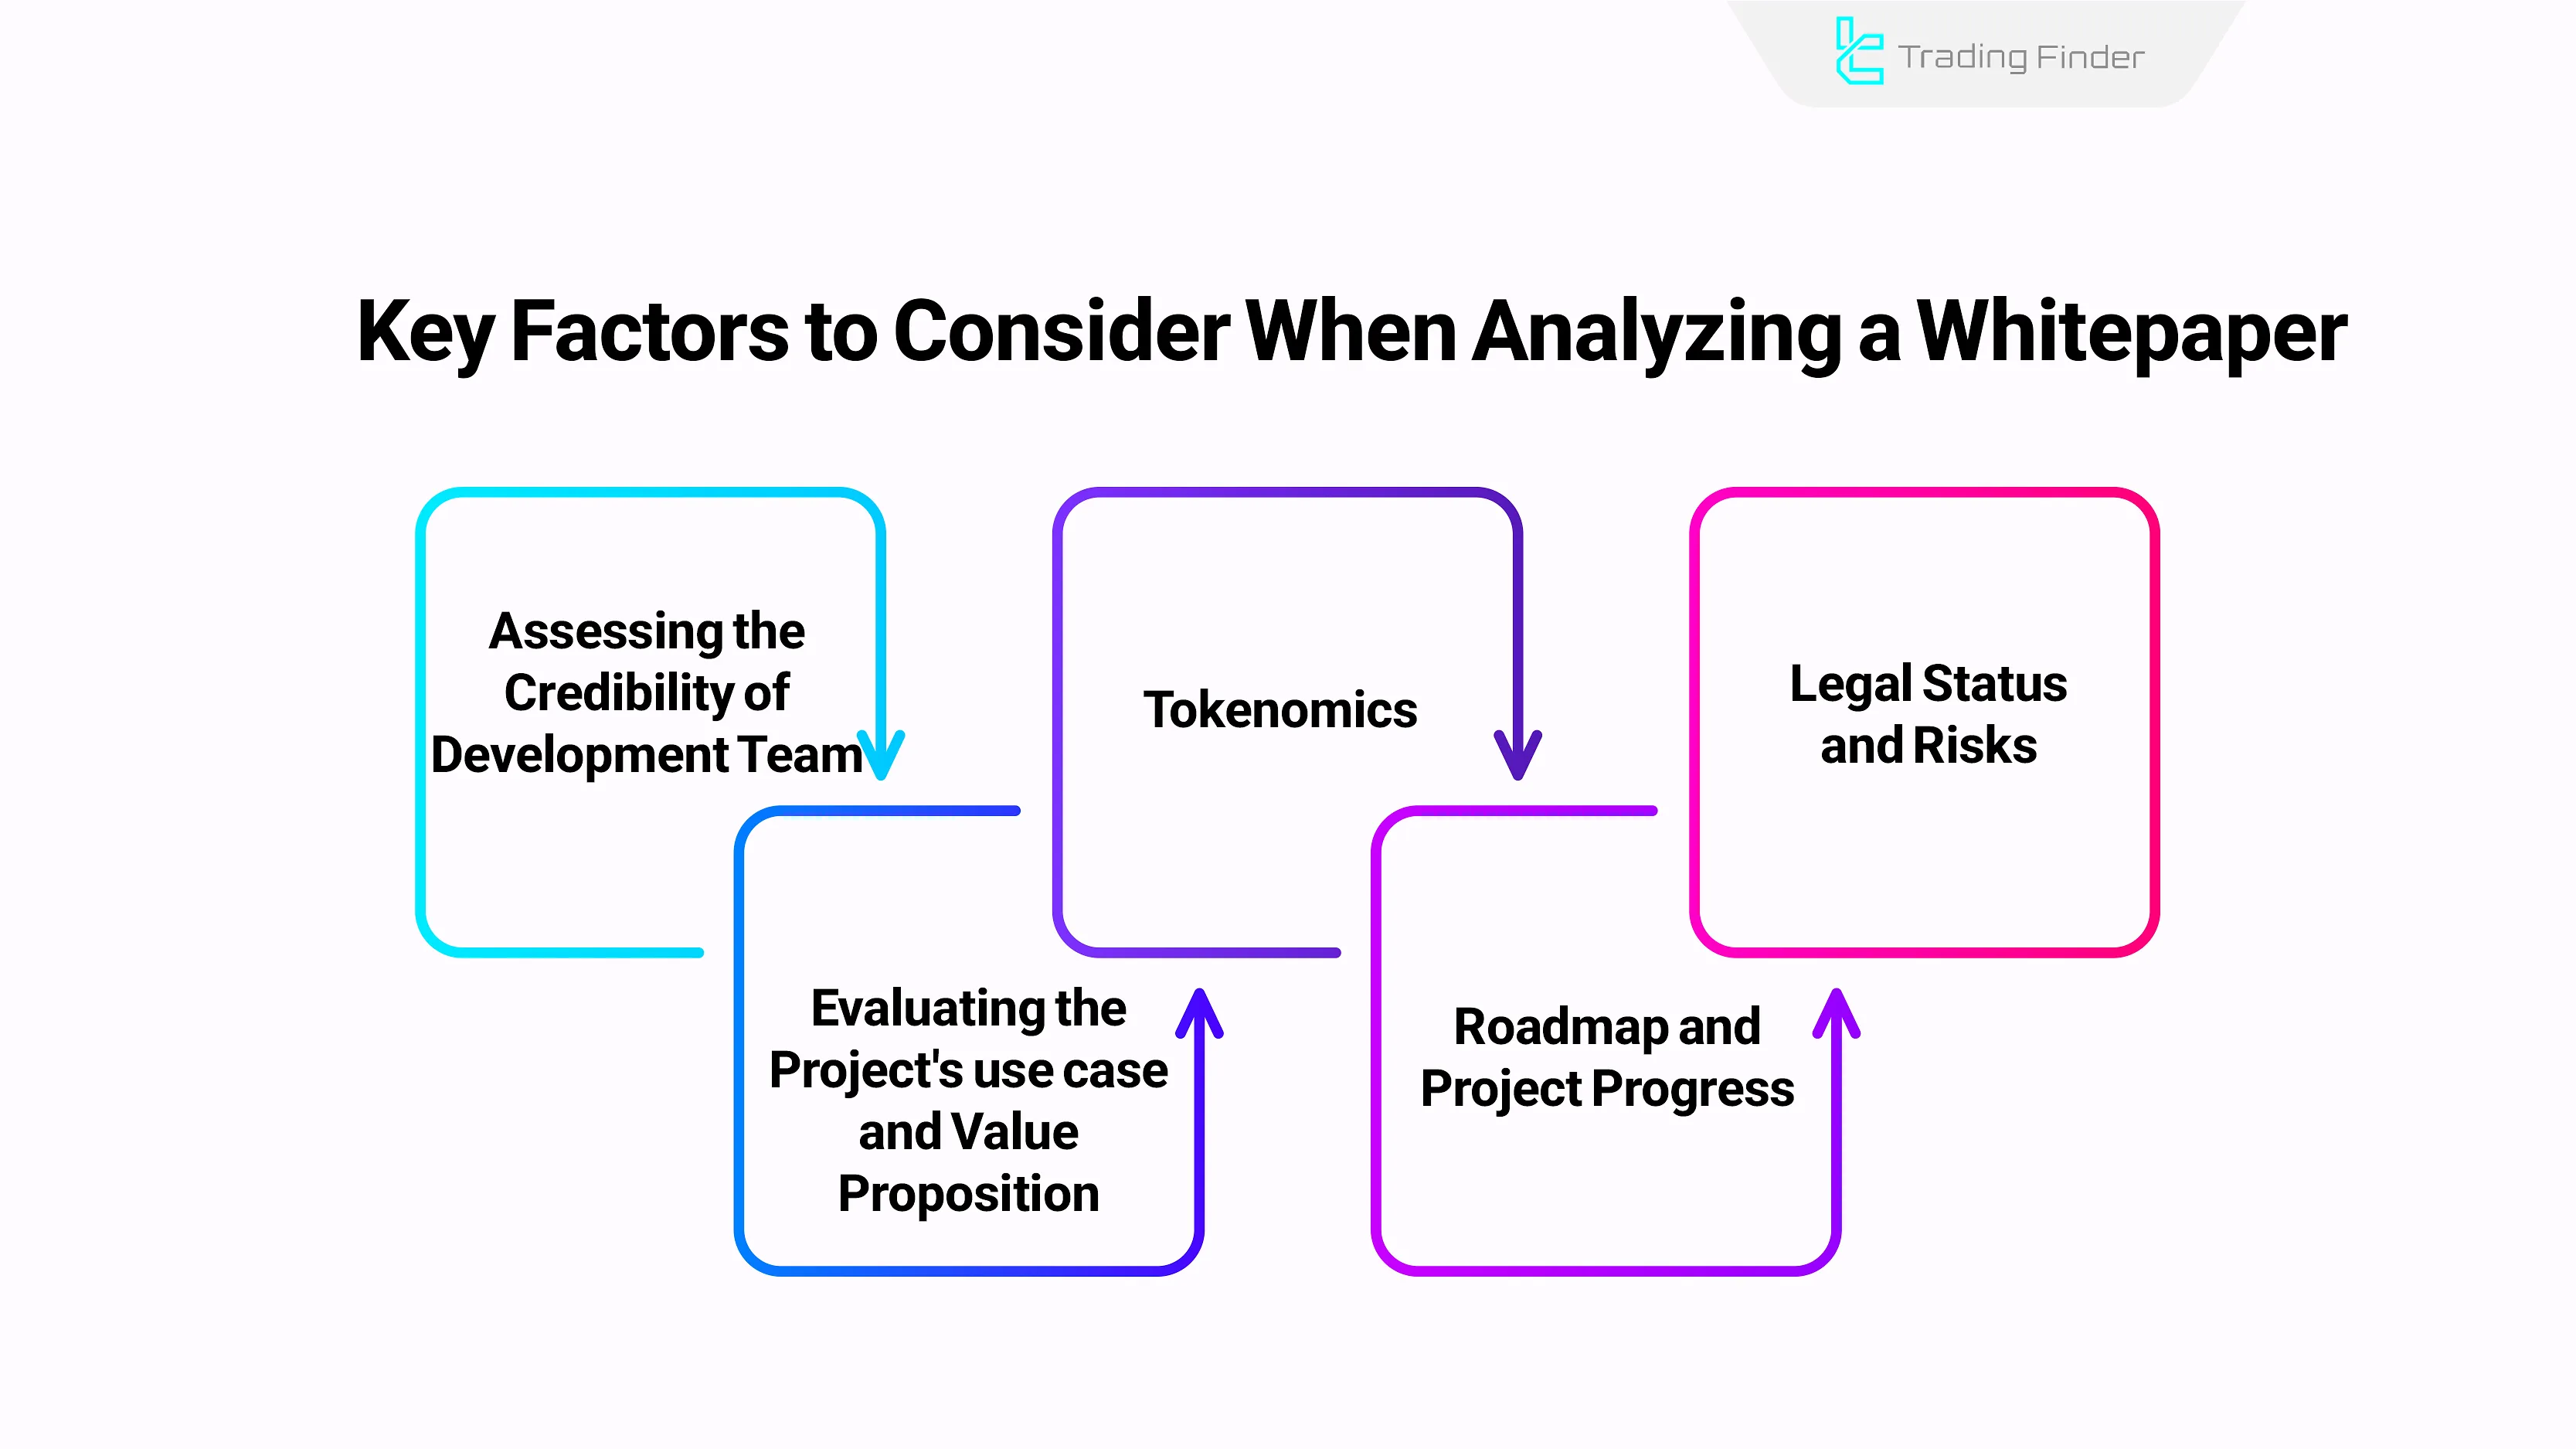
How to review a whitepaper:
- Assessing the credibility of the development team: Examining the background and experience of team members and their success in previous projects;
- Utility and value proposition of the project: Evaluating the proposed solution's competitive advantage and feasibility;
- Tokenomics: Whether the token supply is limited or unlimited, and the percentage distribution;
- Roadmap and project progress: The team's commitment to predefined plans and the roadmap;
- Legal status and risk: Assessing the project's regulatory status in different countries.
Reviewing in-Network Metrics or On-Chain Data
On-chain refers to the analysis of data recorded on the blockchain. In analyzing on-chain data, investor behavior, market trends, and the network's overall health are evaluated.
Key points in on-chain analysis include:
- Number of active addresses and transaction volume: Number of active wallets over time; growth in active addresses signals project adoption;
- Average transaction value: An increase in average transaction value indicates institutional investors are entering;
- Token velocity: The speed at which a token moves within the network. High velocity indicates growing demand and usage;
- Ratio of short-term and long-term holders: Higher coin retention and more long-term holders indicate a bullish market outlook;
- Exchange reserves: Lower exchange reserves support price; higher reserves indicate selling pressure;
- Hash Rate: The network’s processing power is used to maintain security. An increase indicates better security, while a decline implies network weakness;
- Miner revenue: Income miners earn from transaction fees and block rewards. A drop in miner revenue may lead to selling pressure for the cryptocurrency.
Moreover, a set of advanced on-chain indicators is used for network valuation and for identifying overbought and oversold conditions.
Within this framework, the NVT ratio reflects the network’s overvaluation or undervaluation status, and the MVRV indicator analyzes investor behavior and price top and bottom ranges.
Metcalfe’s Law links network value to user growth, and the Mayer Multiple evaluates the price position relative to the 200-day moving average.
Macroeconomic Conditions and General Sentiment in Fundamental analysis in Cryptocurrencies
In addition to reviewing whitepapers, on-chain indicators, and internal market factors, macroeconomic conditions and market sentiment are consistent components of fundamental analysis in cryptocurrency across all financial markets.
Within this framework, variables such as central bank interest rates, contractionary or expansionary monetary policies, and the level of global liquidity can determine the direction of capital flows toward high-risk assets such as cryptocurrencies.
In addition, the condition of equity and commodity markets also plays a role in shaping these capital flows
At the same time, overall market sentiment, derived from investor behavior, macroeconomic news, and fear and greed indicators, plays an important role in amplifying or weakening price reactions to these factors.
It is also considered a complement to on-chain data in analytical decisions.
The Impact of Monetary Policy on the Cryptocurrency Market
Cryptocurrencies are traded against fiat currencies such as the U.S. dollar. Monetary policies are implemented by central banks to control liquidity, interest rates, and the money supply in the economy.
Therefore, with lower interest rates or expansionary policies, the fiat currency weakens and the crypto market tends to grow.
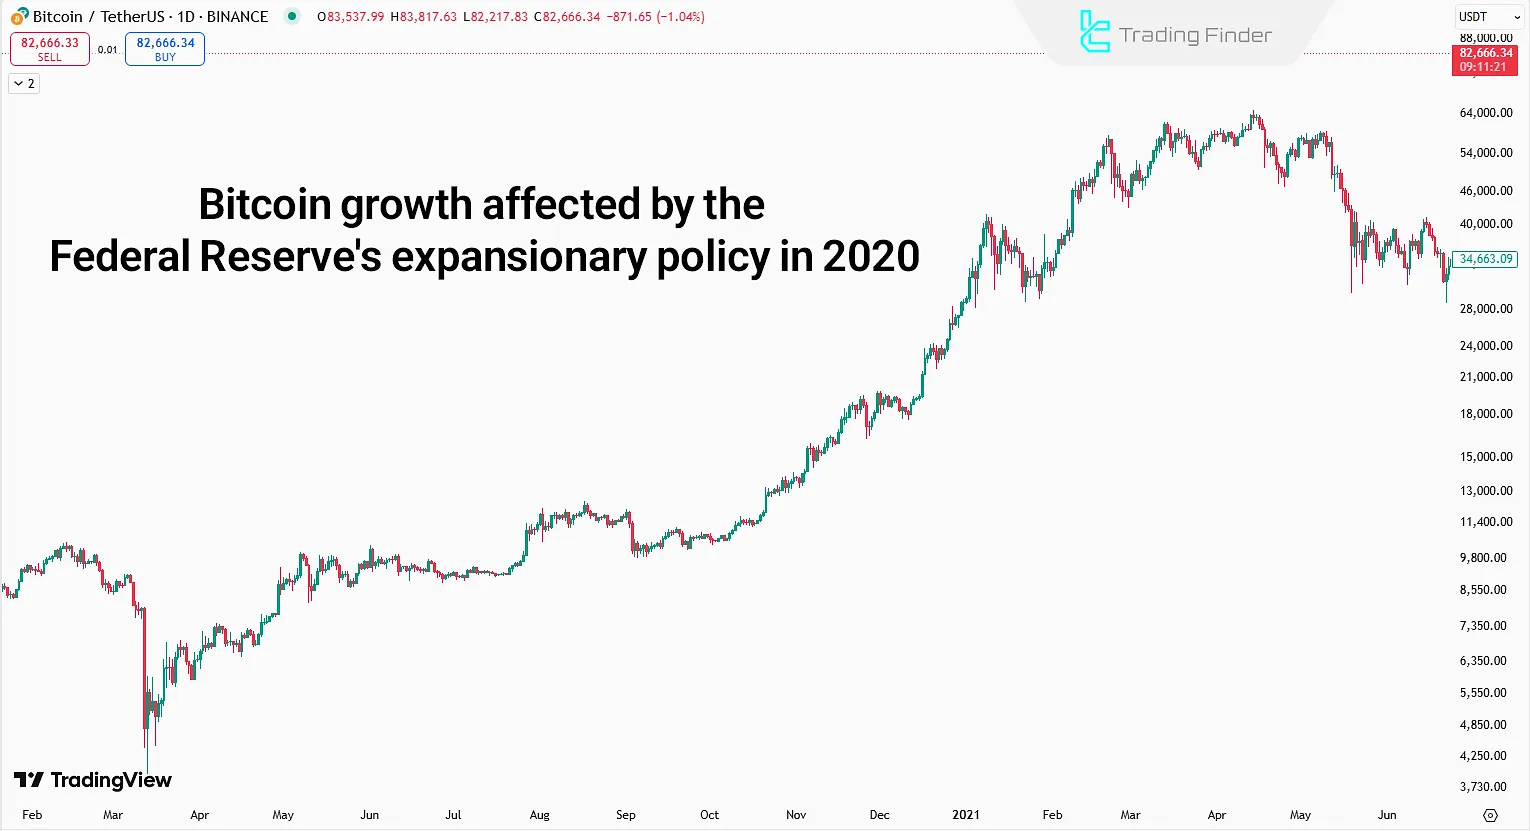
In 2021, coinciding with the Federal Reserve's interest rate cuts and expansionary policy, the crypto market witnessed a sharp rally.
However, this relationship is not guaranteed, and it’s possible that market reactions to lower rates may already have been priced in ahead of time.
How Do Economic Data Crypto Fundamental Analysis?
Economic indicators (such as inflation, GDP, unemployment, etc.) have both short-term and long-term effects on the cryptocurrency market.
Theoretically, Bitcoin's price will typically react negatively if a data release supports a stronger dollar (e.g., GDP higher than expectations).
Conversely, in response to data that weakens the dollar (e.g., inflation lower than expected), Bitcoin’s price usually increases.
Geopolitical Risks and Market Sentiment
The cryptocurrency market is a high-risk market that reacts negatively to uncertainty, risk, and a shift toward risk-averse sentiment.
Geopolitical risks, uncertainty in the political and economic outlook, and key data affecting risk sentiment significantly impact the fundamental analysis of cryptocurrency projects.
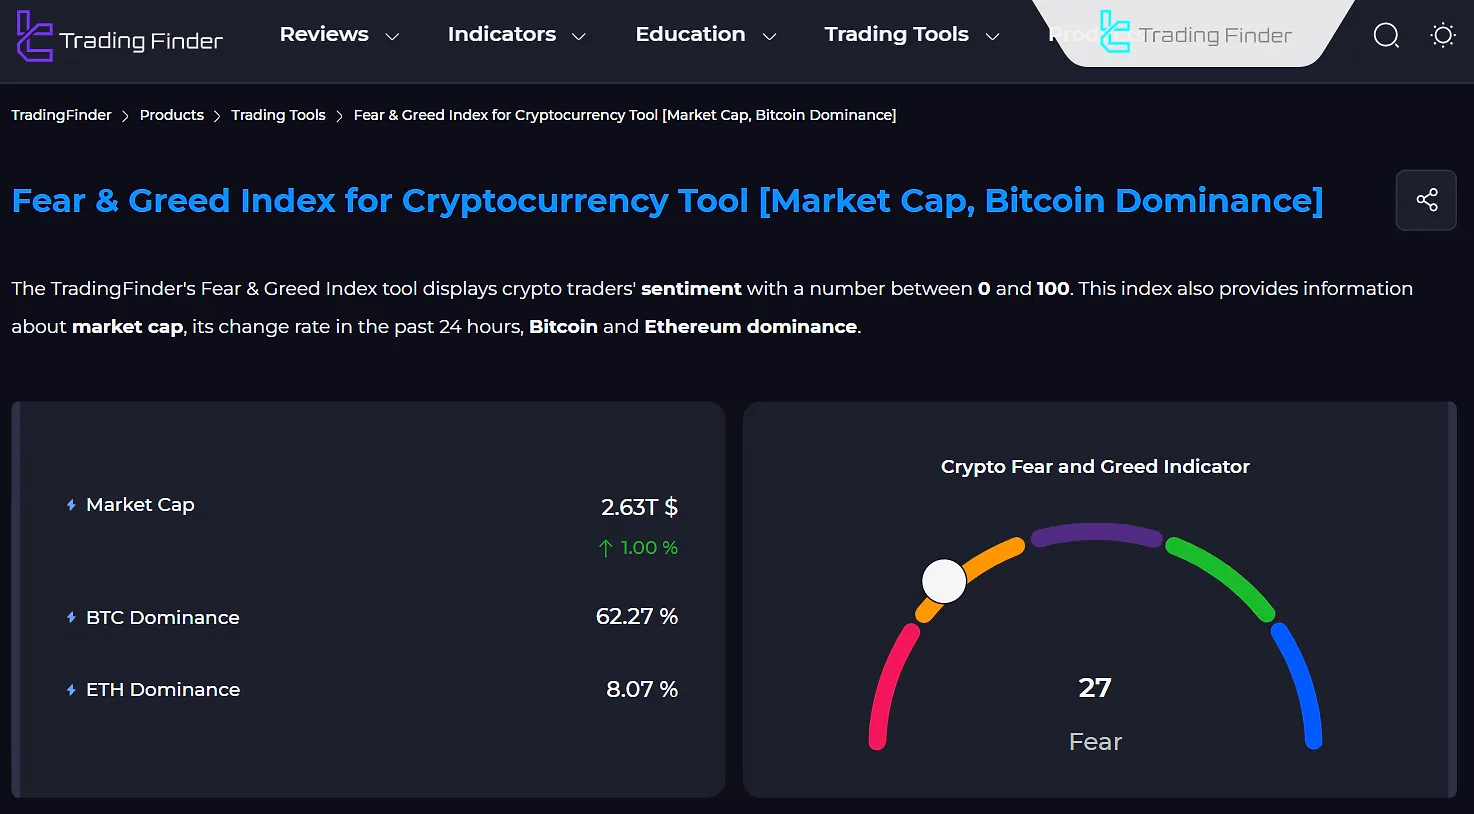
Fear and Greed Index and Tracking Market Sentiment
The Fear and Greed Index is a tool used to measure the emotions of crypto market participants. Its value ranges from 0 to 100:
- 0 to 24: Extreme Fear - During this phase, the market is experiencing intense fear and is likely near a price bottom;
- 25 to 49: Fear - Although market sentiment is negative, it is not extremely severe;
- 50: Neutral - Indicates balance in market sentiment;
- 51 to 74: Greed - As emotions shift toward greed, the market tends to grow and may exceed its intrinsic value;
- 75 to 100: Extreme Greed - The market is in a state of extreme greed, increasing the likelihood of a price correction.
To monitor cryptocurrency market sentiment, you can use the Fear and Greed Index tool provided by the TradingFinder .
Difference between fundamental analysis of coins, tokens, and DeFi projects
Fundamental analysis of cryptocurrencies depends on identifying the source of value creation in each project, and value can be generated from security, technical infrastructure, economic model, or revenue flow.
Within this framework, the path of value creation is first determined and then indicators are examined that are directly related to that same source of value. Fundamental analysis is considered a goal-oriented process and is not performed as a checklist.
Focusing on irrelevant indicators, such as reviewing total value locked (TVL) for a non-utility token, misleads the analysis and reduces the accuracy of investment decision-making.
Comparative table of fundamental analysis indicators:
Type of project | Main analysis priorities | Key indicators | Major risks |
Coins | Network security and stability | Hash rate, decentralization, on-chain data, public adoption | Mining centralization, selling pressure, macro risks |
Tokens | Economic model and utility | Tokenomics, utility, dependence on host network, unlocks | Supply inflation, lack of real utility |
De Fi | Financial performance and security | TVL, liquidity, protocol revenue, contract security | Hacking, unsustainable incentives, capital outflows |
Example of Fundamental Analysis of a Cryptocurrency (Practical Sample)
In the fundamental analysis of Bitcoin as an independent coin with its own blockchain, the main focus is placed on network security, hash rate, and the level of public adoption.
This digital asset does not have a complex whitepaper or an extensive development roadmap, but its mission as a decentralized and transparent monetary system has been defined and stabilized over time.
From a tokenomics perspective, the limited supply of 21 million units minimizes inflation risk and plays a key role in preserving long-term value.
At the on-chain data layer, indicators such as the number of active addresses, hash rate, and exchange balances are considered reliable metrics for measuring the level of trust of users and investors in the network.
In the macroeconomic dimension, Bitcoin is usually influenced by expansionary monetary policies and faces significant volatility during periods of increased market risk aversion.
The combination of these variables makes it possible to reach a realistic estimate of Bitcoin’s intrinsic value and long-term outlook.
Common mistakes in cryptocurrency fundamental analysis
In the fundamental analysis of blockchain projects, a comprehensive and data-driven approach plays a key role.
Many mistakes are not due to a lack of information, but rather arise from superficial data review and ignoring the relationships among different factors.
A valid analysis is formed when on-chain indicators, tokenomics, and market conditions are evaluated simultaneously and within an appropriate context.
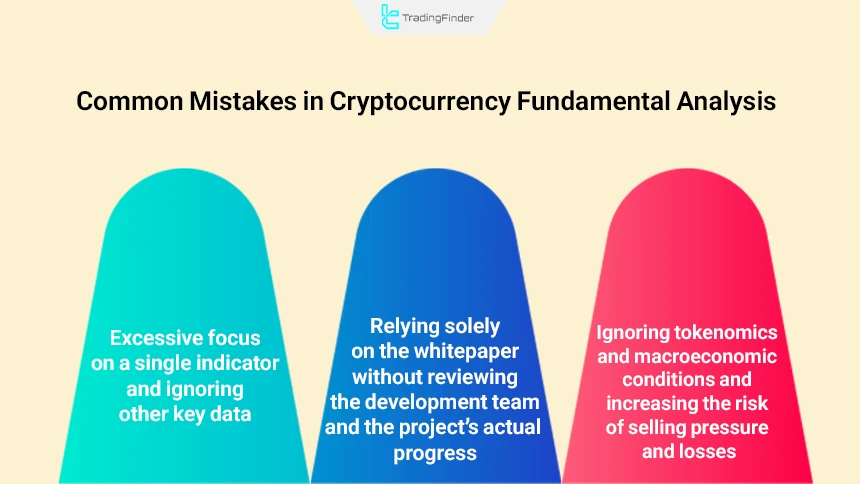
The most important common errors in cryptocurrency fundamental analysis include the following:
- Excessive focus on a single indicator such as cryptocurrency market capitalization or active addresses without considering other key data and forming an incomplete picture of the project’s real value;
- Reliance solely on the whitepaper without evaluating the background of the development team, the level of actual project progress, and the degree of roadmap realization;
- Ignoring tokenomics and macroeconomic conditions, especially token release schedules and macroeconomic variables, and increasing the risk of selling pressure and losses even for strong projects.
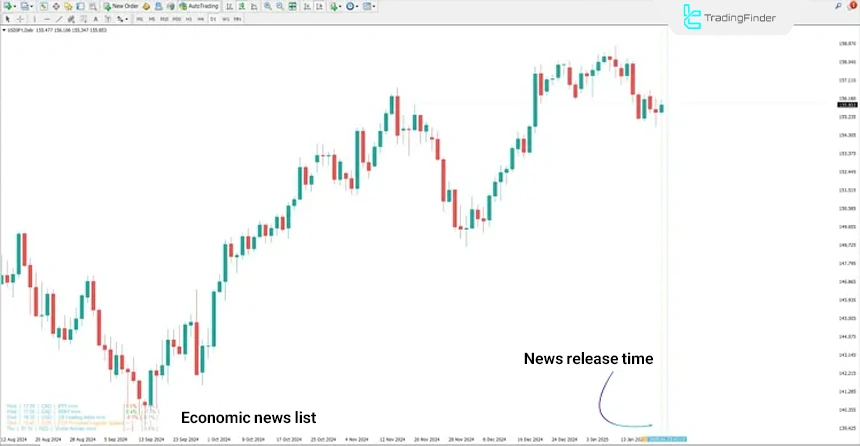
Forex Factory Calendar Indicator in MetaTrader
The Forex Factory Economic Calendar indicator is one of the specialized tools for combining news analysis with price charts on the MetaTrader platform.
This indicator retrieves data from the Forex Factory economic calendar and displays major events such as GDP, unemployment rate, central bank decisions, inflation indicators, and other influential statistics directly on the chart.
This enables the trader to analyze market reactions simultaneously with news releases. This tool belongs to the group of news indicators in MetaTrader and, due to its multi-timeframe analysis capability, has high applicability for IntraDay trading and risk management in the Forex market.
Its structure is designed in a way that it can be used both in ranging market conditions and during news-driven breakouts.
For example, on the one-hour XAU/USD chart, the release of an important economic report related to the US dollar can cause a sudden price jump. If the actual data is better than forecasts, strengthened expectations of economic growth may alter the price behavior of gold.
In another scenario, on the EUR/AUD chart in the 30-minute timeframe, the release of economic news related to the euro can lead to sharp volatility and the break of technical levels; a situation that is not predictable without an economic calendar.
The settings section of the Forex Factory Calendar indicator provides full customization.
The trader can filter events based on impact level (High Impact, Medium Impact, Low Impact), change the color of each category, and determine how long events remain on the chart after release.
In addition, reporting functionality is provided for currencies such as USD, EUR, GBP, JPY, AUD, CHF, CAD, NZD, and CNY. The alert system also includes Popup Alert, Sound Alert, and email notifications, and the alert timing is adjustable.
Overall, the Forex Factory economic calendar indicator bridges the gap between fundamental and technical analysis by converting fundamental data into visual signals on the MetaTrader chart.
Conclusion
The purpose of crypto fundamental analysis is to discover the intrinsic value of digital assets by reviewing the whitepaper and tracking on-chain indicators such as transaction volume and value, wallet activity, hash rate, and miner revenue.
Moreover, in addition to internal market factors, macroeconomic conditions, unforeseen risks, and the overall sentiment in financial markets also influence the trends in the crypto market.


