


Price behavior in financial markets is often driven by fluctuations in collective sentiment. Indicators like the Fear & Greed Index are designed to measure these psychological shifts.
Rather than relying on price analysis, this index is based on behavioral data such as trading volume, volatility, user searches, and capital flow.
Understanding emotional trends helps interpret overbought and oversold conditions or detect divergences between price and sentiment.
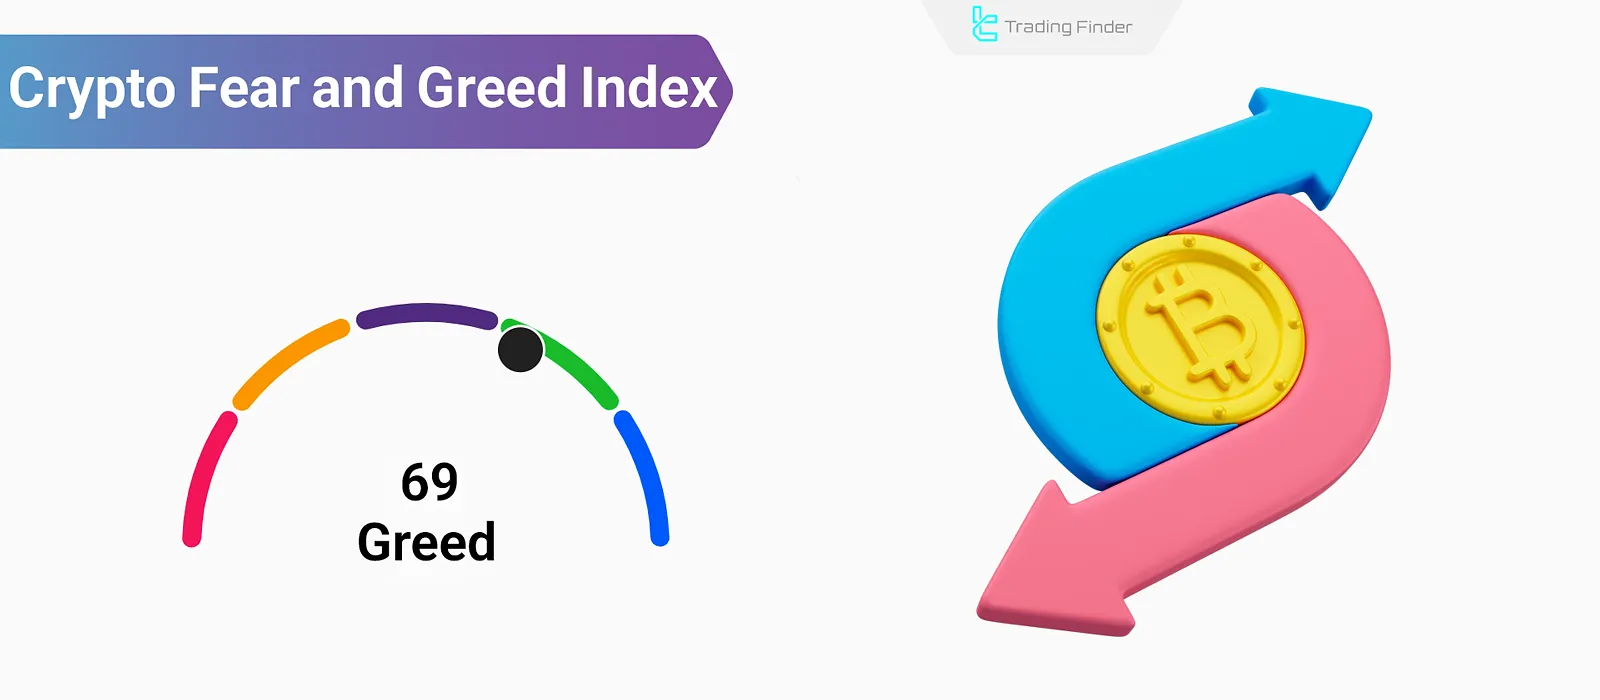
What Is the Fear & Greed Index?
The Fear and Greed Index is a tool for gauging the psychological direction of the market. It quantifies market sentiment using data like price volatility, trading volume, online search trends, and capital inflow, presenting a number between 0 and 100.
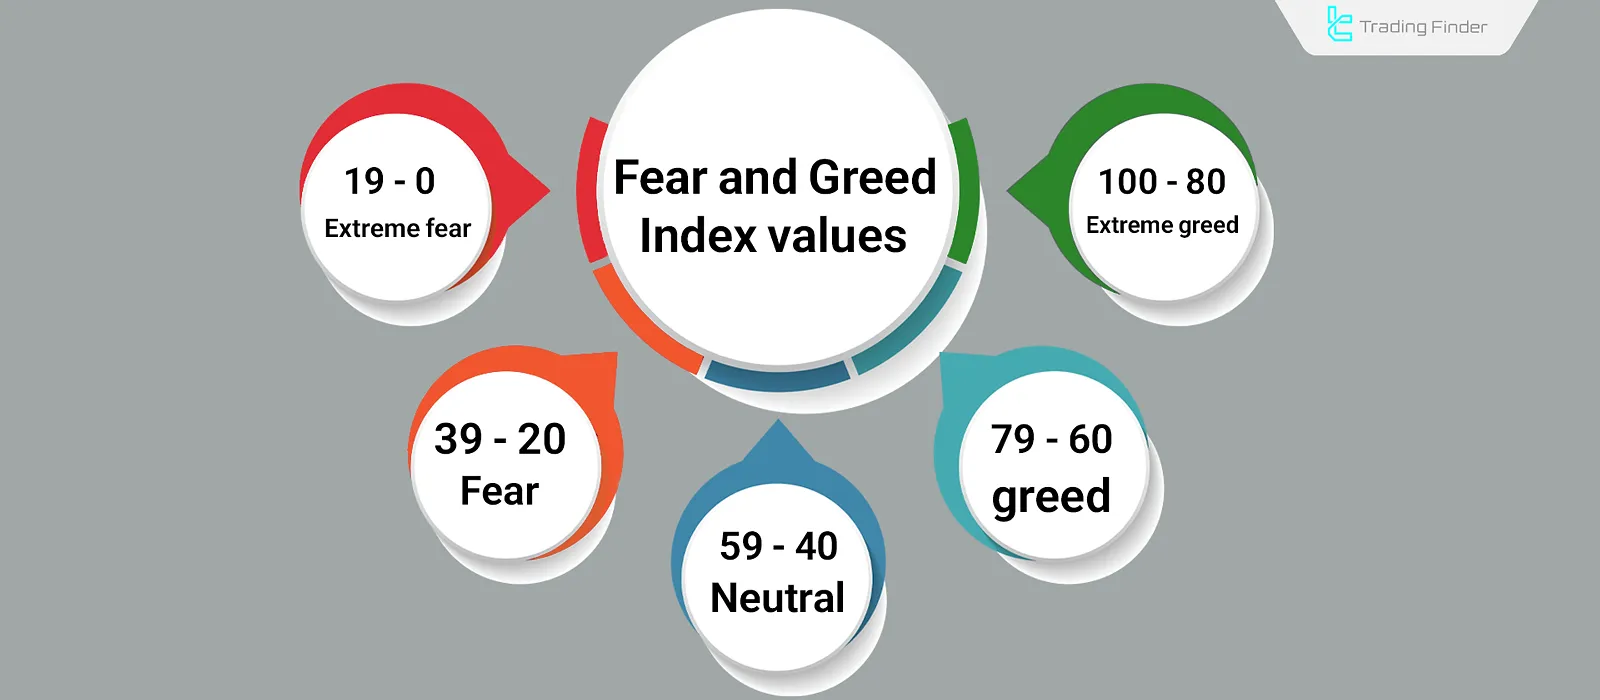
Fear & Greed Index Values:
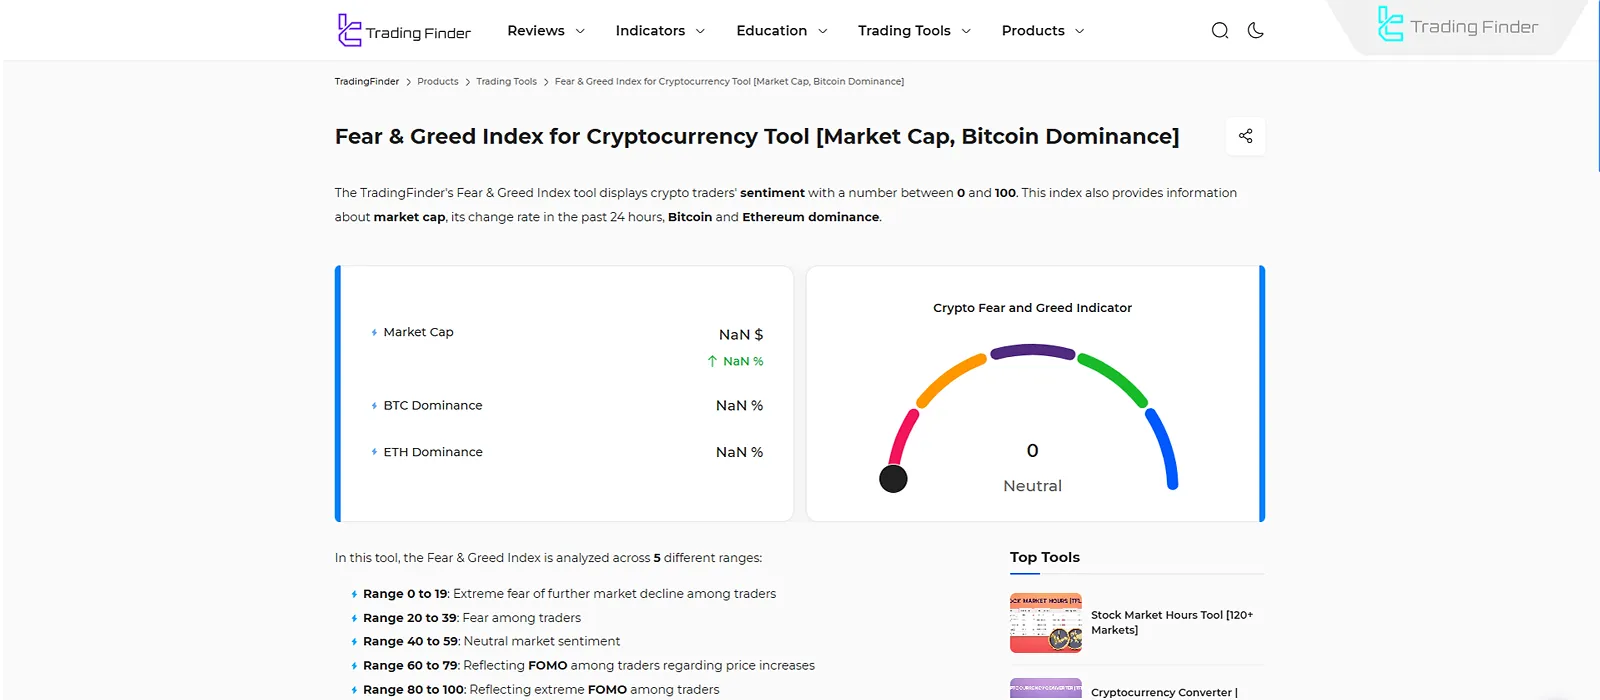
- 0–19: Indicates extreme market anxiety and trader concern over continued sell pressure;
- 20–39: Suggests a conservative sentiment and caution toward entering trades;
- 40–59: Reflects relatively stable sentiment with no clear psychological direction;
- 60–79: Signals increasing buying enthusiasm driven by fear of missing out (FOMO);
- 80–100: Represents excessive excitement and impulsive behavior due to intense market FOMO.
This index is commonly used to analyze the cryptocurrency market - particularly Bitcoin - as a complementary tool for understanding collective behavior and assessing the potential for price reversals.
Note: To evaluate fear and greed in crypto markets, you can use the Crypto Fear and Greed Index tool provided by the TradingFinder team.
Components of the Crypto Fear & Greed Index
Structure of the crypto Fear and Greed Index is based on a combination of behavioral and market-based data. Each component contributes a weighted value to the final index calculation:
- Price Volatility: 25%
- Market Volume & Momentum: 25%
- Google Search Trends: 10%
- Social Media Sentiment: 15%
- Periodic Surveys: 15%
- Bitcoin Dominance: 10%
Price Volatility
High short-term price volatility relative to historical averages usually reflects a dominance of fear or greed in the market.
Market Volume & Momentum
Daily trading volume is compared with 30- or 90-day averages. Rising volume in bullish moves often indicates greed, while declining volume in downtrends may signal fear and trader distrust.
Google Search Trends
Sudden increase in searches for negative keywords typically points to elevated market fear. Conversely, spikes in keywords related to buying or price growth indicate heightened greed.
These search trends are normalized (0–100) and indirectly reflect user reactions to market shifts.
Social Media Sentiment
Analyze content from platforms like Twitter, Reddit, and YouTube to determine whether the overall sentiment toward crypto is positive or negative.
Surveys
Public opinion polls help assess the general market outlook. Due to the subjective nature of these responses, their influence is limited and sometimes excluded altogether.
Bitcoin Dominance
An increasing share of Bitcoin relative to altcoins is often interpreted as fear, signaling a shift away from high-risk assets. Conversely, a decrease suggests rising greed toward altcoins.
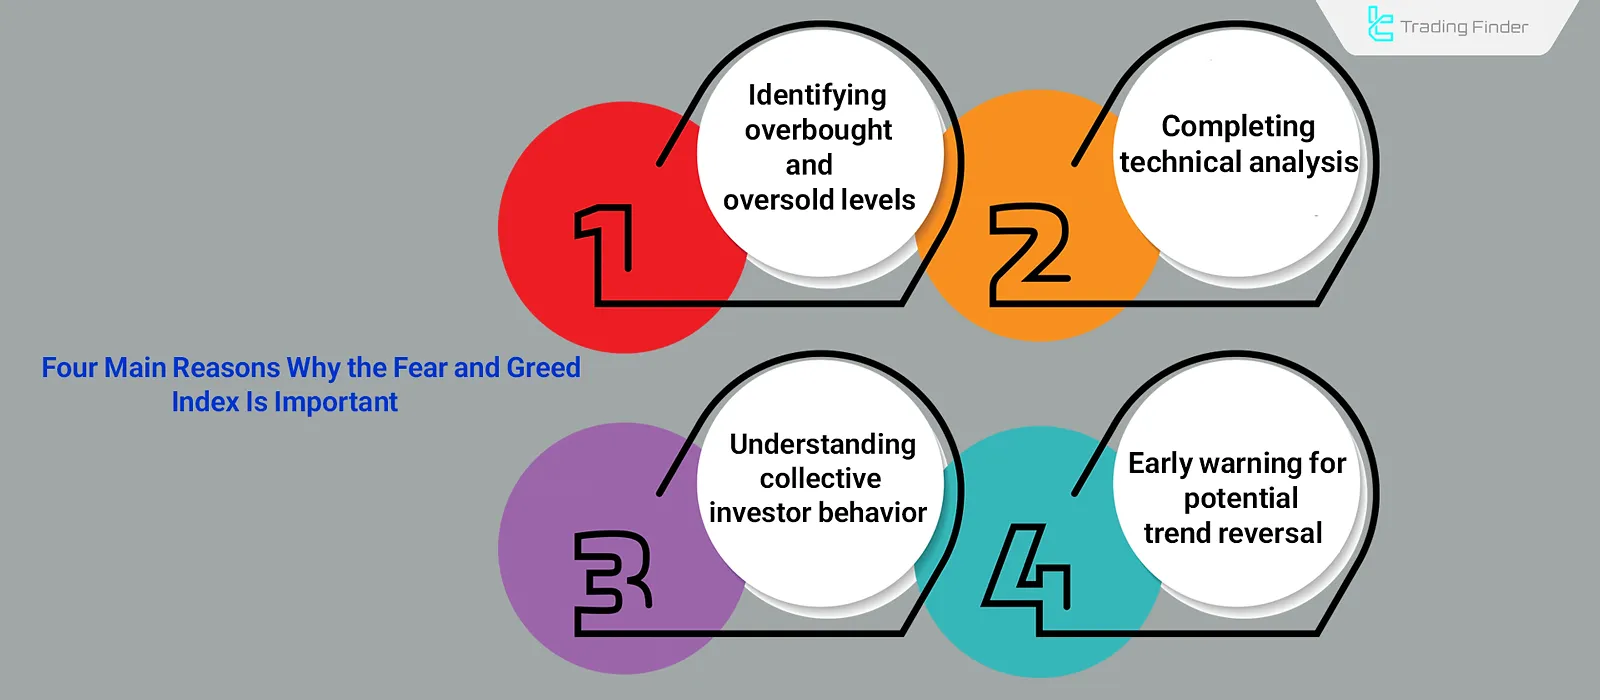
Why Is the Fear & Greed Index Important?
The index provides a general overview of prevailing market sentiment. Alongside price analysis, it offers a clearer view of current conditions. Extreme highs or lows often indicate overbought or oversold situations, increasing the likelihood of a reversal.
Often, sharp changes in the index precede price reactions. It quantifies investor emotions, helping confirm or question technical analysis - especially when the index value aligns with or diverges from chart patterns.
How to Use the Fear & Greed Index in Trading
This index serves as a supplementary tool for timing market entries and exits.
- When the value drops below 20, it reflects extreme fear and panic selling. This may indicate a market bottom and mid-term buying opportunities;
- When it exceeds 80, excessive greed may have taken over. This is often followed by rapid price increases—and corrections afterward.
However, it should not be used in isolation, as its behavioral nature introduces delays.
Conclusion
The Fear & Greed Index is a numerical representation [0–100] of collective market sentiment. When combined with other analytical methods, it helps identify overbought or oversold conditions.
Though not a standalone decision-making tool, tracking its fluctuations alongside price, volume, and technical structure enhances market behavior analysis.


