


Harmonic patterns, combining geometric features and Fibonacci ratios, are among the most effective tools for price prediction.
Their primary application is identifying price reversal points; traders can recognize levels where the price is likely to change direction using these patterns.
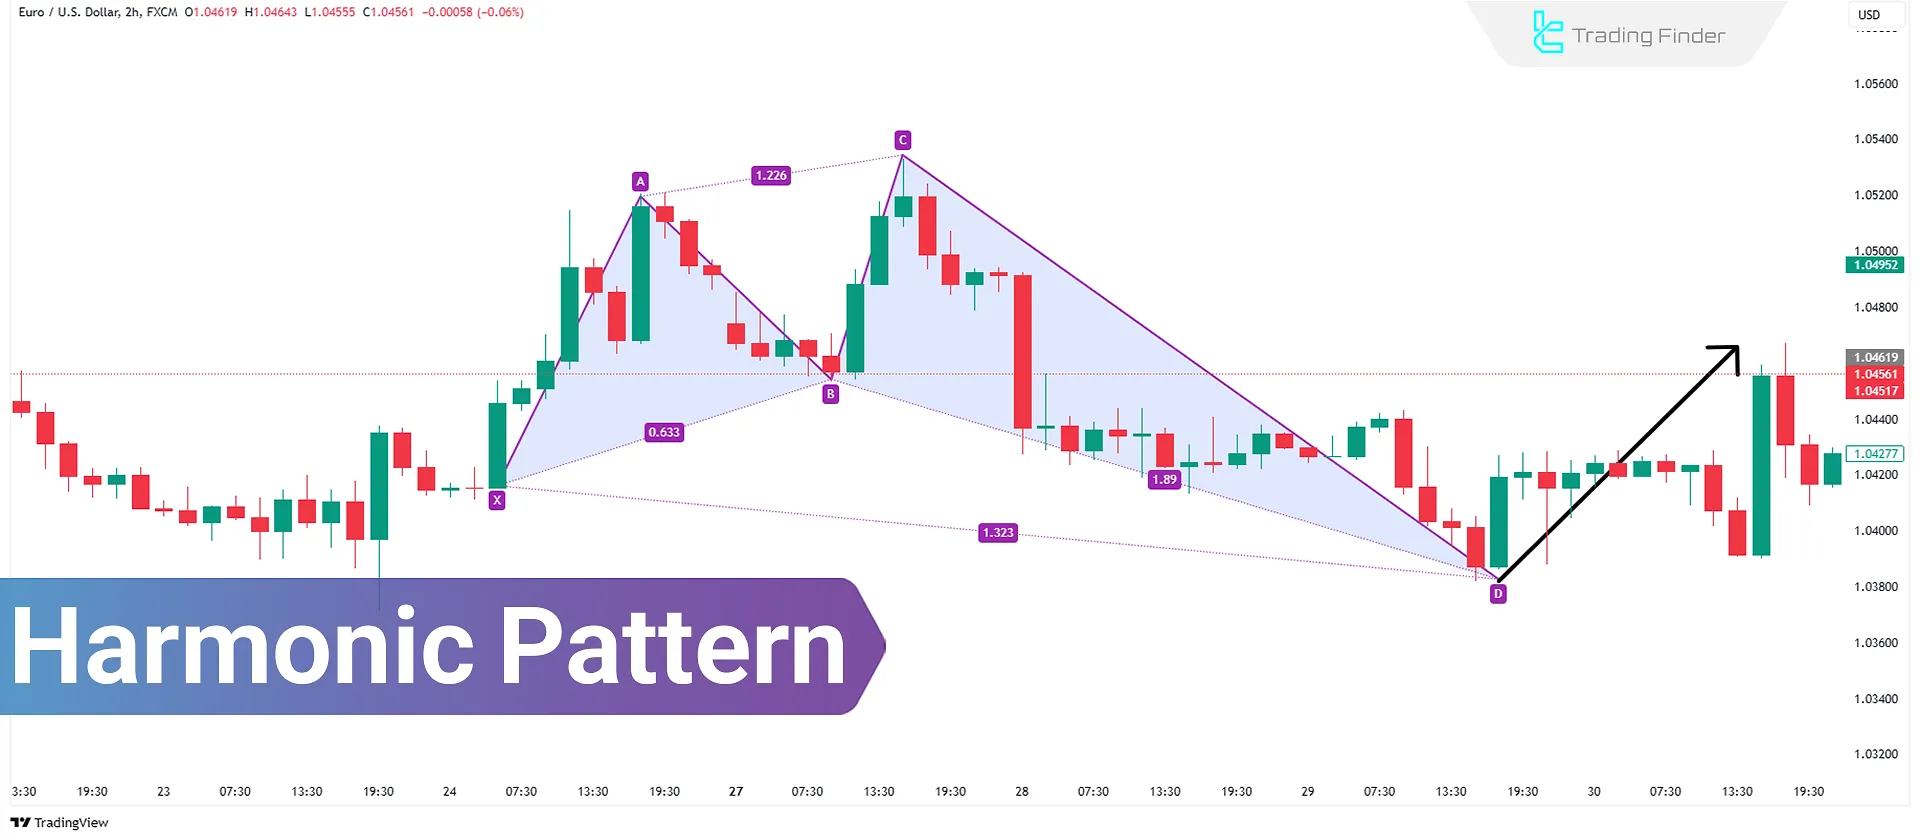
What are Harmonic Patterns?
Harmonic patterns in technical analysis combine chart patterns and Fibonacci ratios to identify price reversal points.
These patterns include models such as Bat, Crab, Butterfly, and Shark, each with specific ratios for determining trade entry and exit points. They are applicable in all financial markets, particularly the forex market.
By adhering to geometric and numerical ratio rules, these patterns reduce the number of false signals.
Advantages and Disadvantages of Harmonic Patterns
The table below presents the advantages and disadvantages of advanced harmonic patterns:
Advantages | Disadvantages |
High accuracy due to precise Fibonacci ratios | Complexity in manually identifying patterns |
Usable across various markets and timeframes | Dependency on Fibonacci tools for precise measurement |
Provides clear entry and exit points | Subjectivity in pattern recognition |
Introduction to Different Harmonic Patterns
Harmonic patterns are classified into bullish and bearish categories, indicating potential price increases or decreases in the market. Main harmonic patterns:
ABCD Pattern
The ABCD pattern is one of the simplest harmonic patterns, consisting of three price movements and four key points:
- AB Move: Initial price movement
- BC Move: Corrective wave in the opposite direction of AB
- CD Move: Movement in the same direction as AB, typically equal in length and duration
Key Fibonacci Ratios in the ABCD Pattern:
- BC correction should be 0.618 of AB.
- The CD should have the same length and duration as AB.
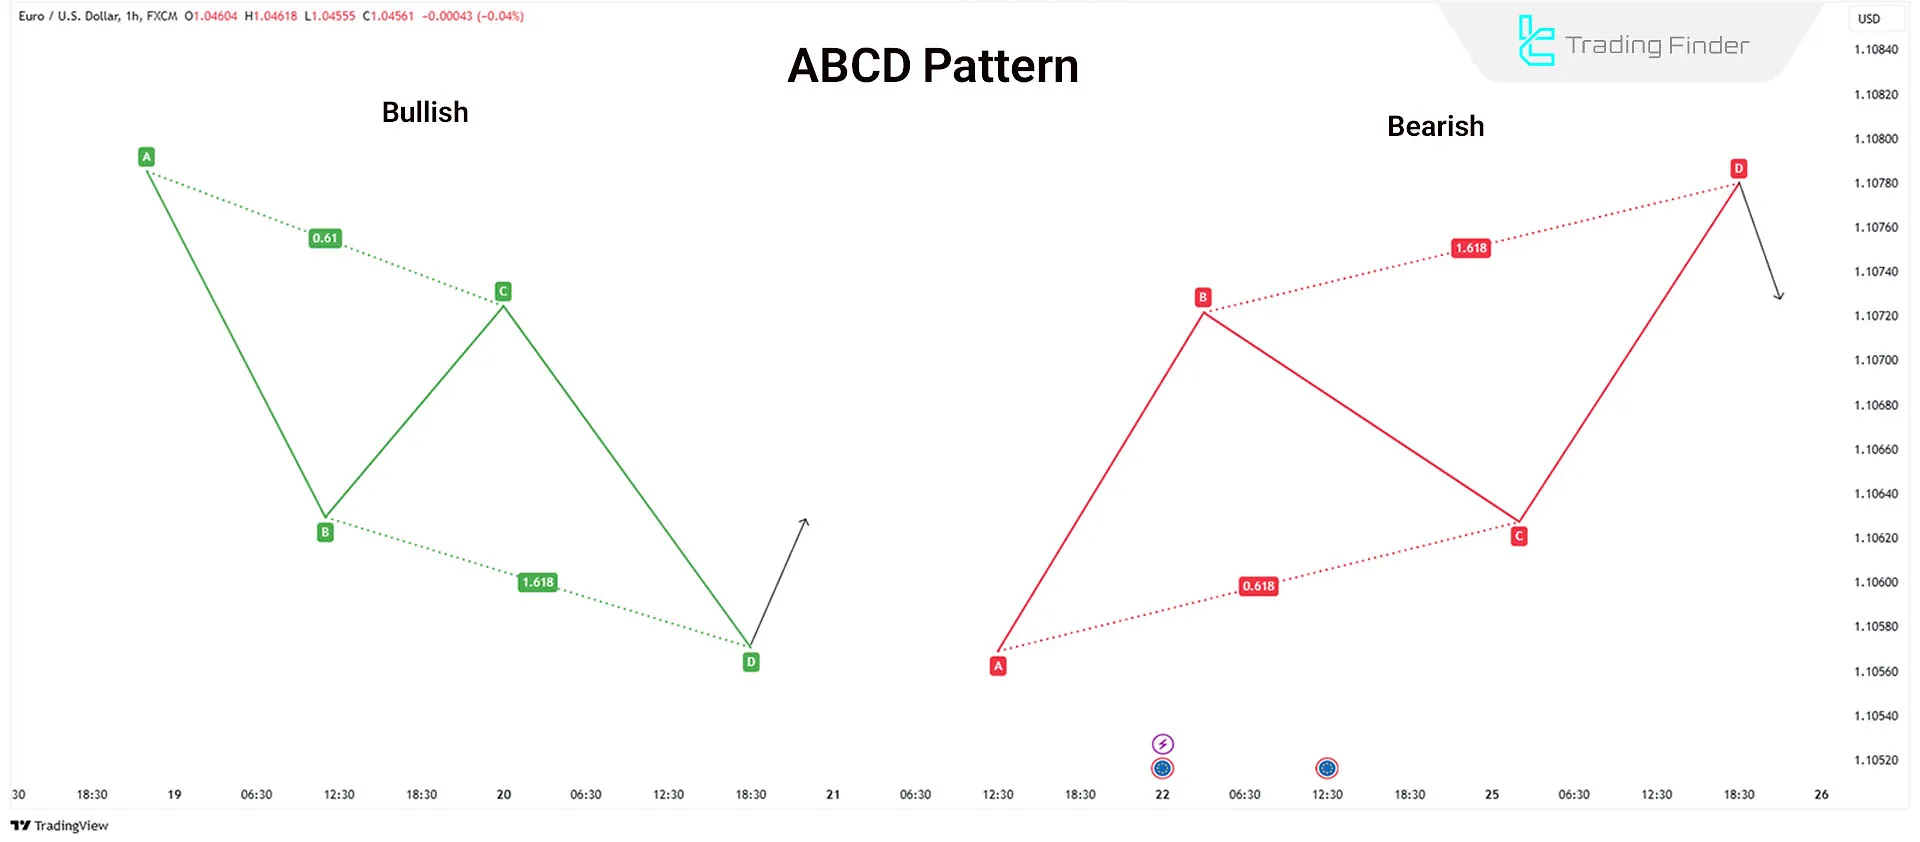
Traders can open trades at point C (Potential Reversal Zone - PRZ) or wait for the pattern to complete at point D.
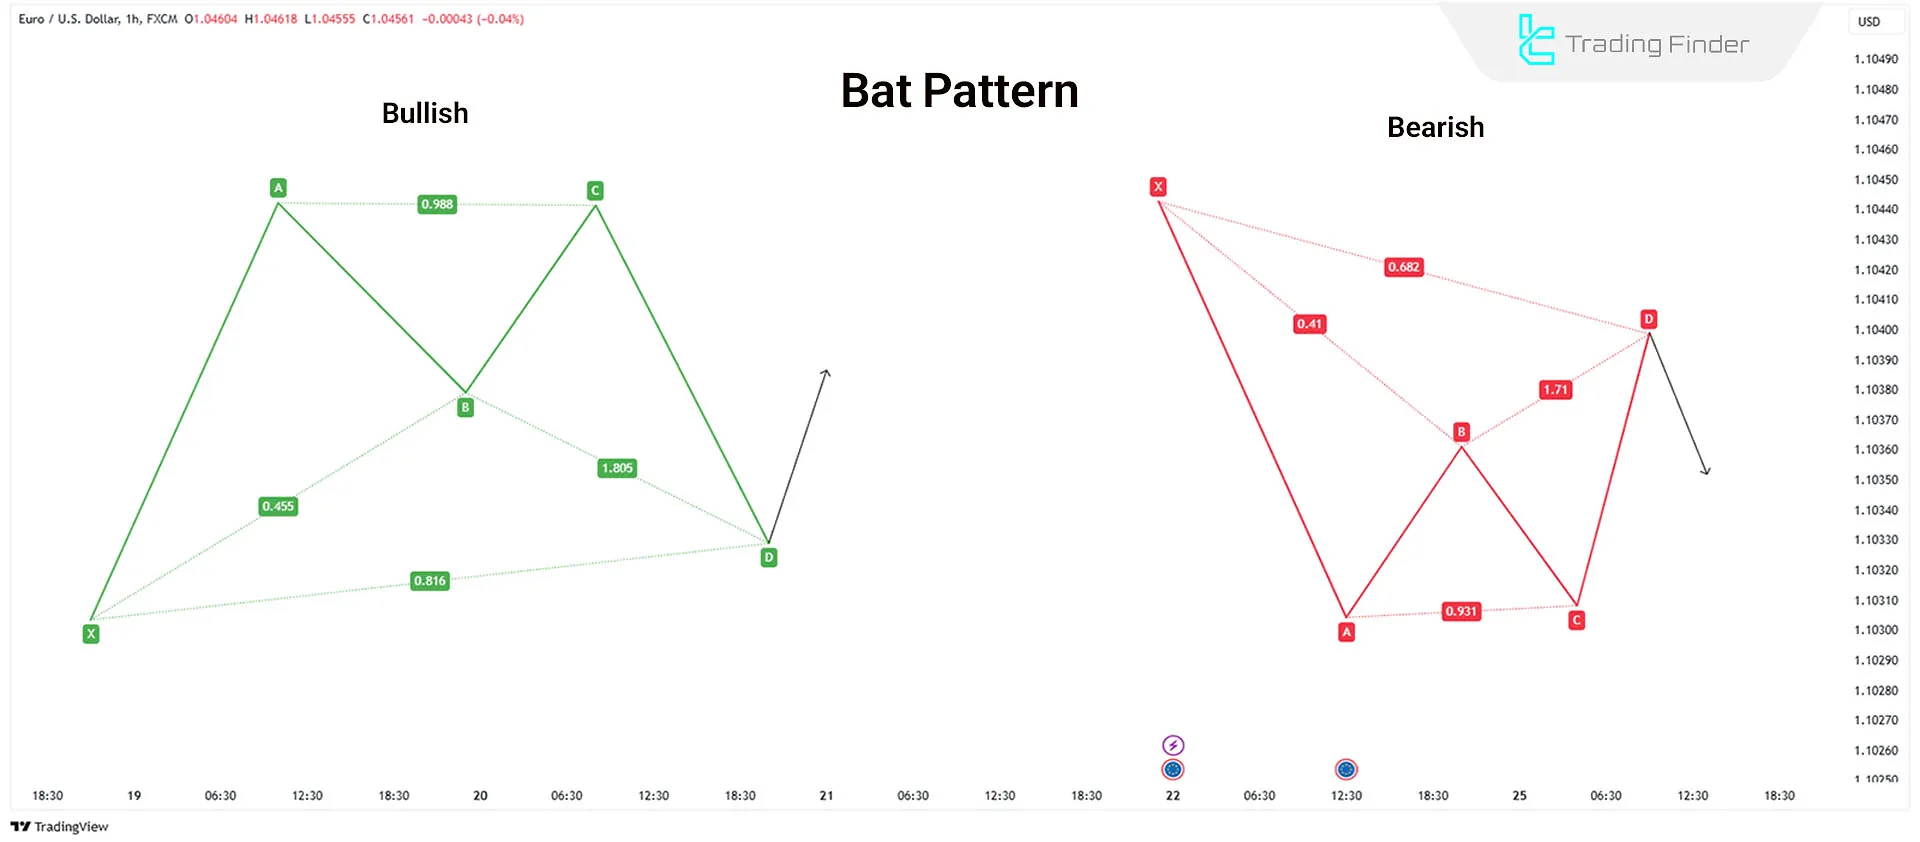
Bat Pattern
Scott Carney identified the bat pattern in 2001. It is valid when point B retraces 50% of the XA move.
Key Fibonacci Ratios in the Bat Pattern:
- Point B should retrace 38.2% to 50% of XA
- CD extension should be at least 1.618 BC
- Point D forms thePotential Reversal Zone (PRZ)
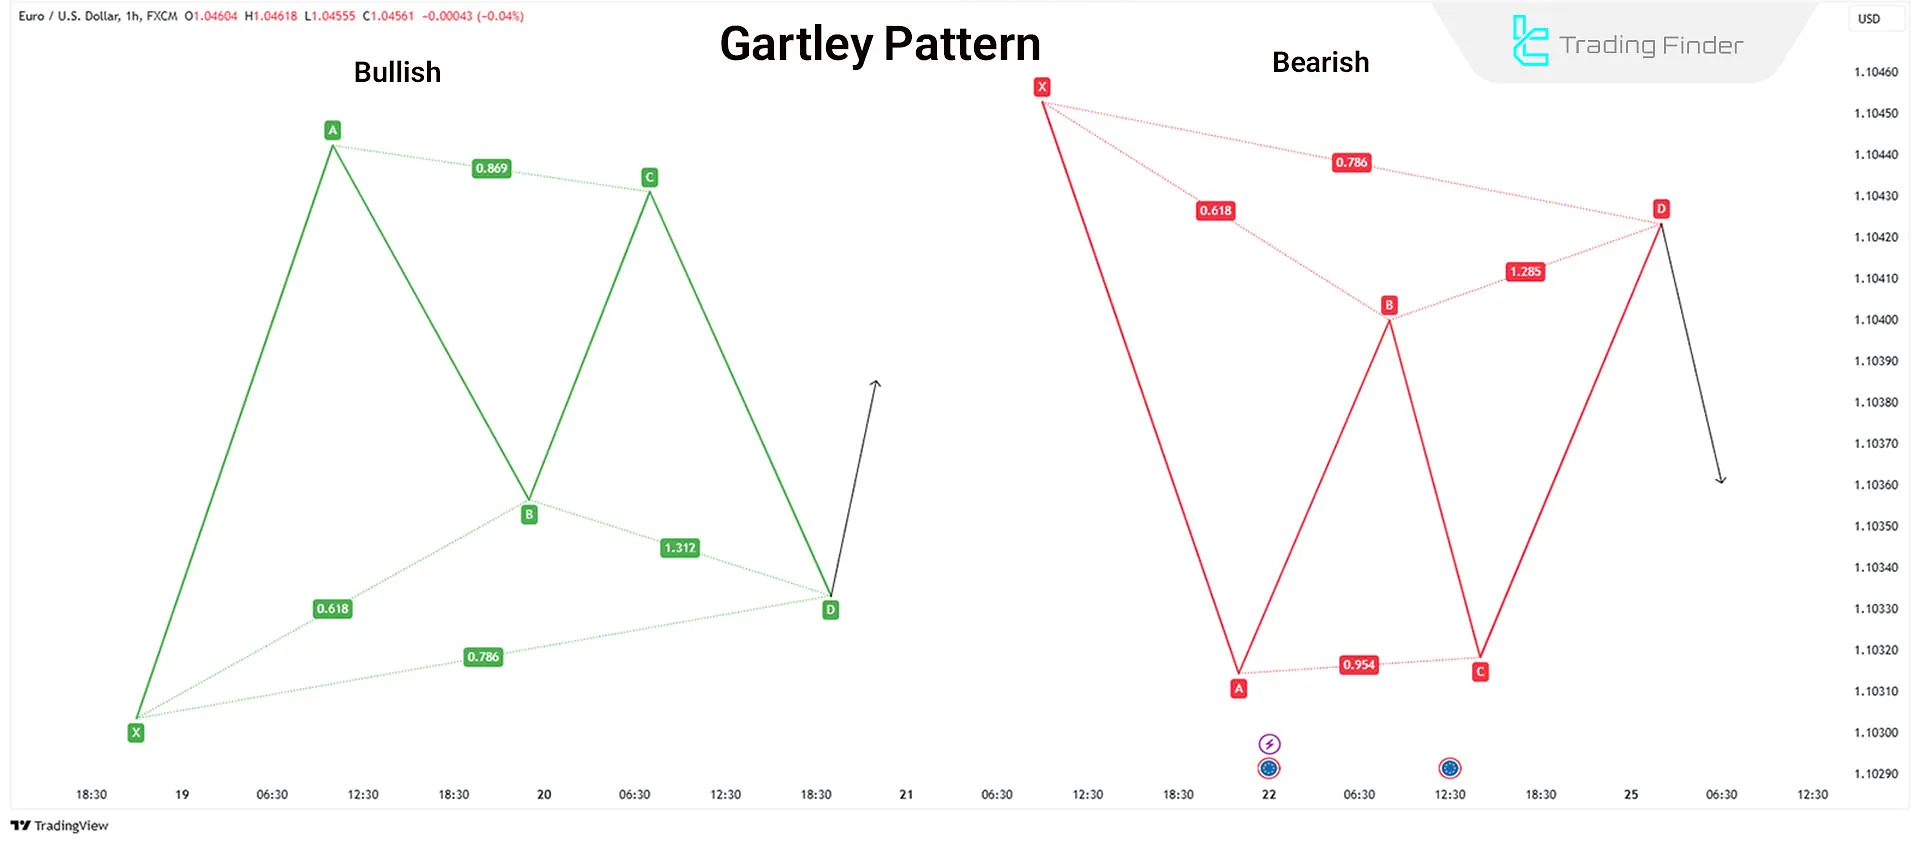
Gartley Pattern
Gartley Pattern by H.M. Gartley, this pattern is similar to the Bat pattern but follows stricter Fibonacci ratios:
- Point B retracement must be 0.618 of XA
- Point D retracement must be 0.786 of XA
Traders can place stop-loss at point X and take-profit at point C.
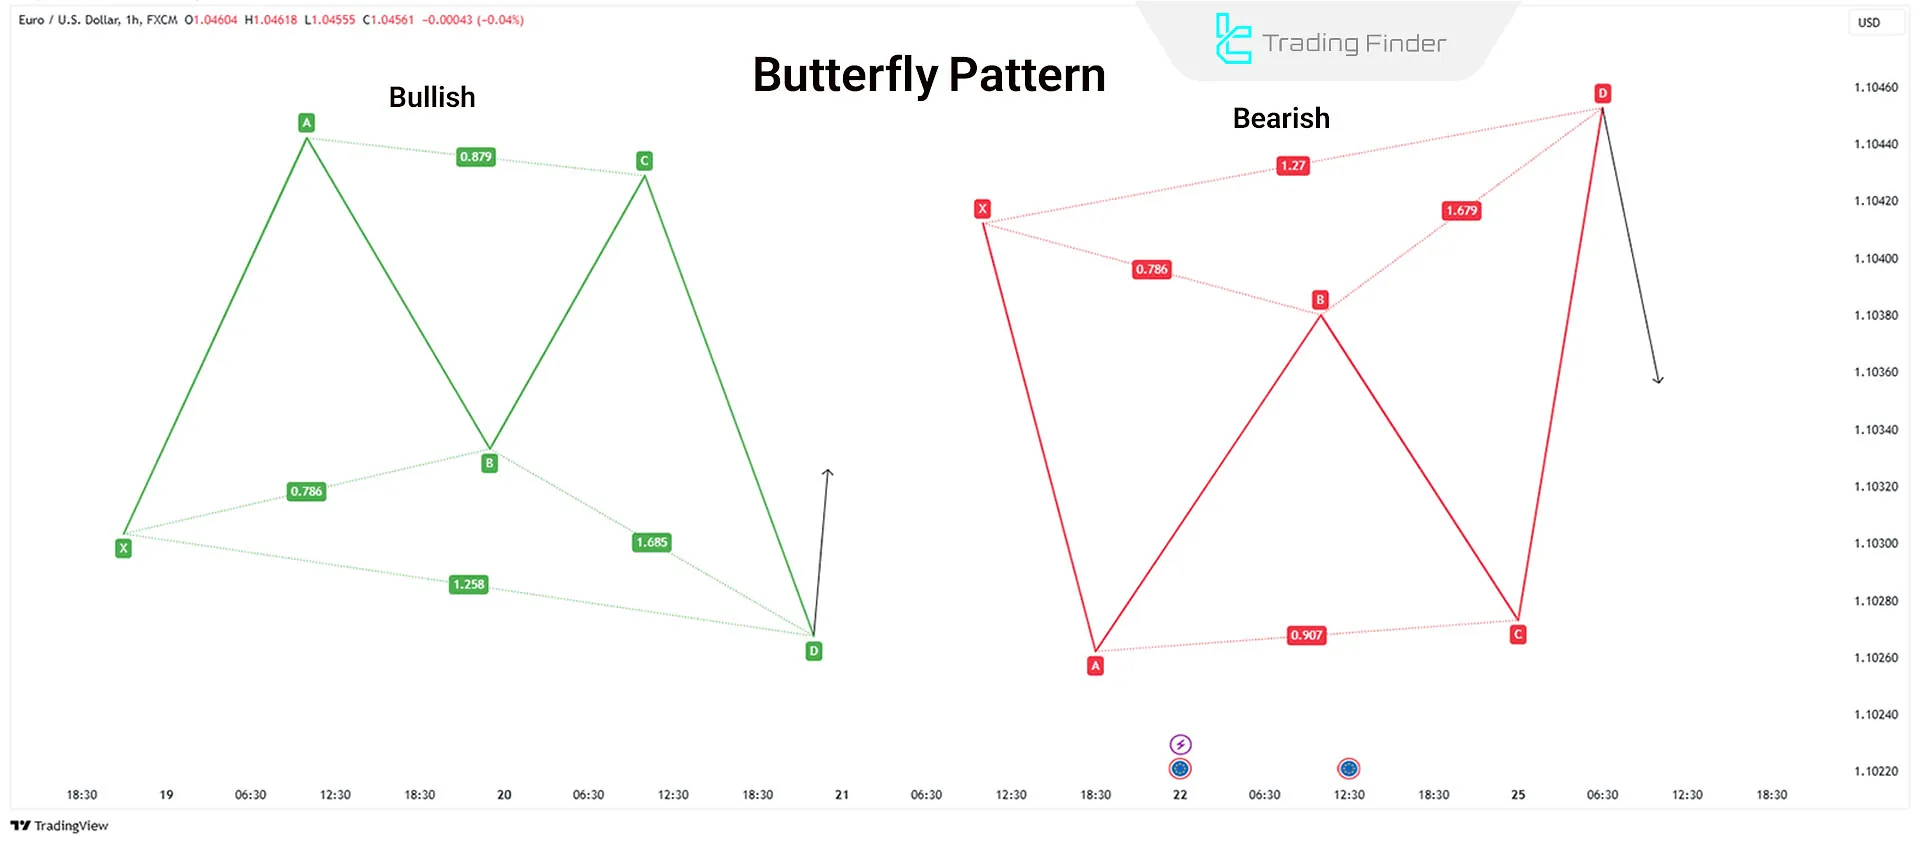
Butterfly Pattern
Bryce Gilmore introduced the butterfly pattern, a reversal pattern composed of four price movements:
- X-A
- A-B
- B-C
- C-D
While the butterfly pattern closely resembles the Gartley pattern, its D point is lower than Gartley’s.
Key Fibonacci Ratio in the Butterfly Pattern:
A 0.786 retracement of XA determines point B and the Potential Reversal Zone (PRZ).
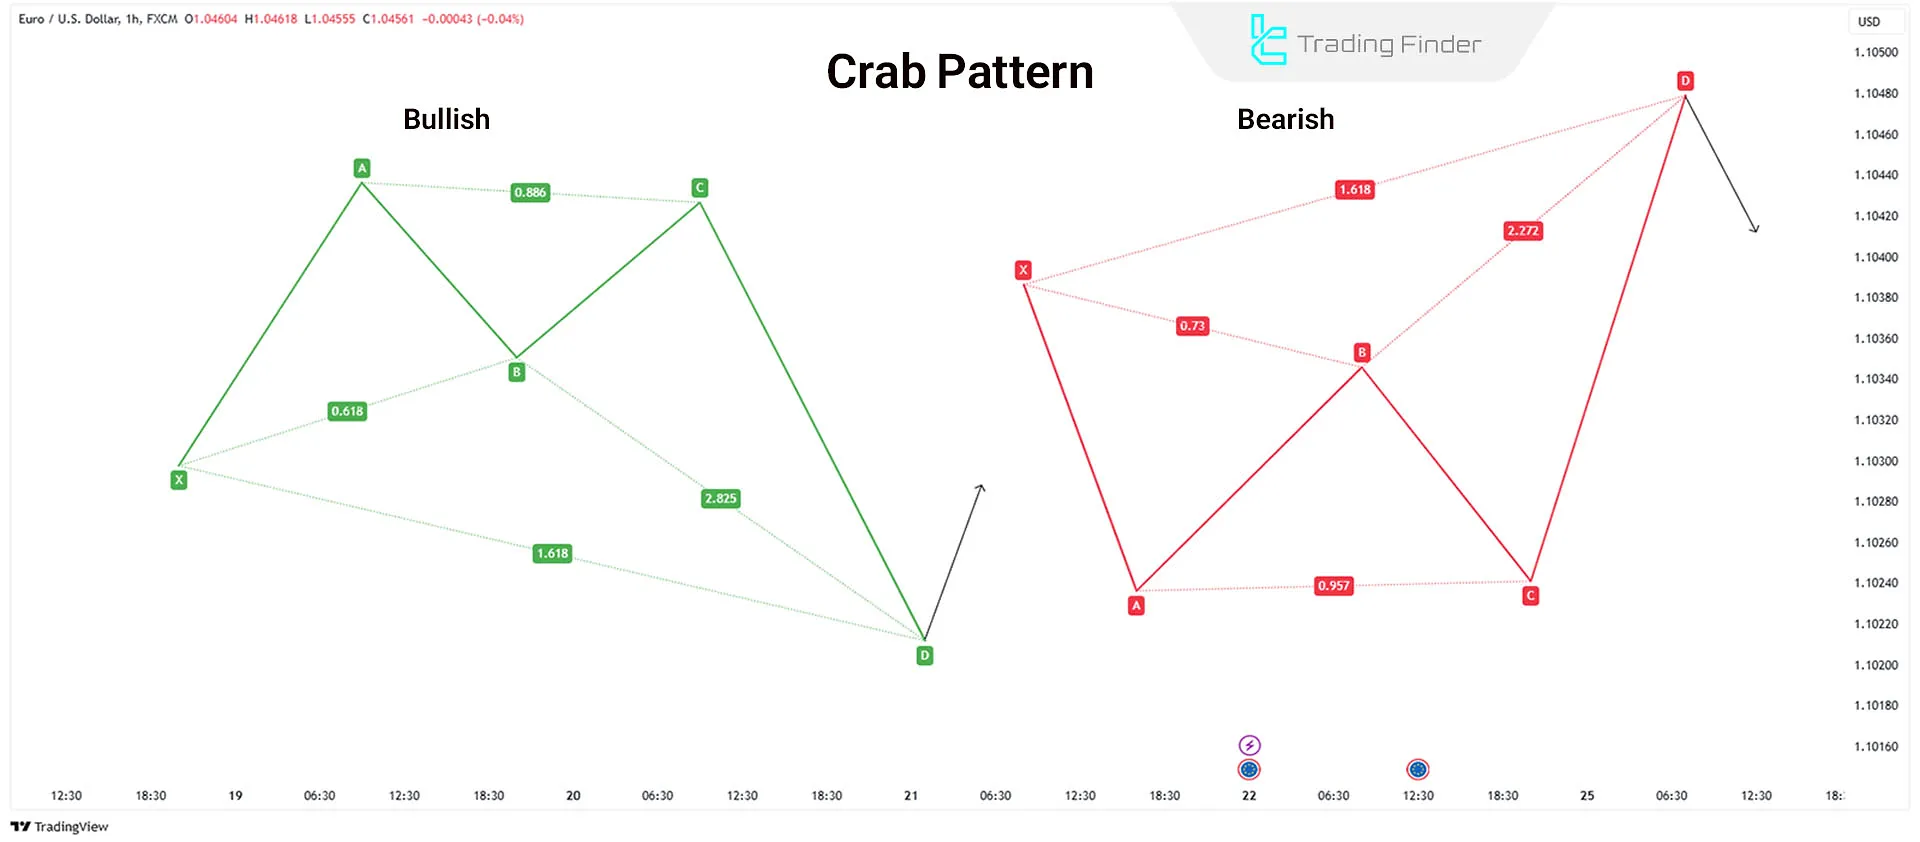
Crab Pattern
Identified by Scott Carney, the Crab pattern allows traders to enter trades at extreme market highs or lows.
Key Fibonacci Ratios in the Crab Pattern:
- Point D must be 1.618 of XA, forming a strong PRZ
- BC extension is typically between 2.618 and 3.618 of AB
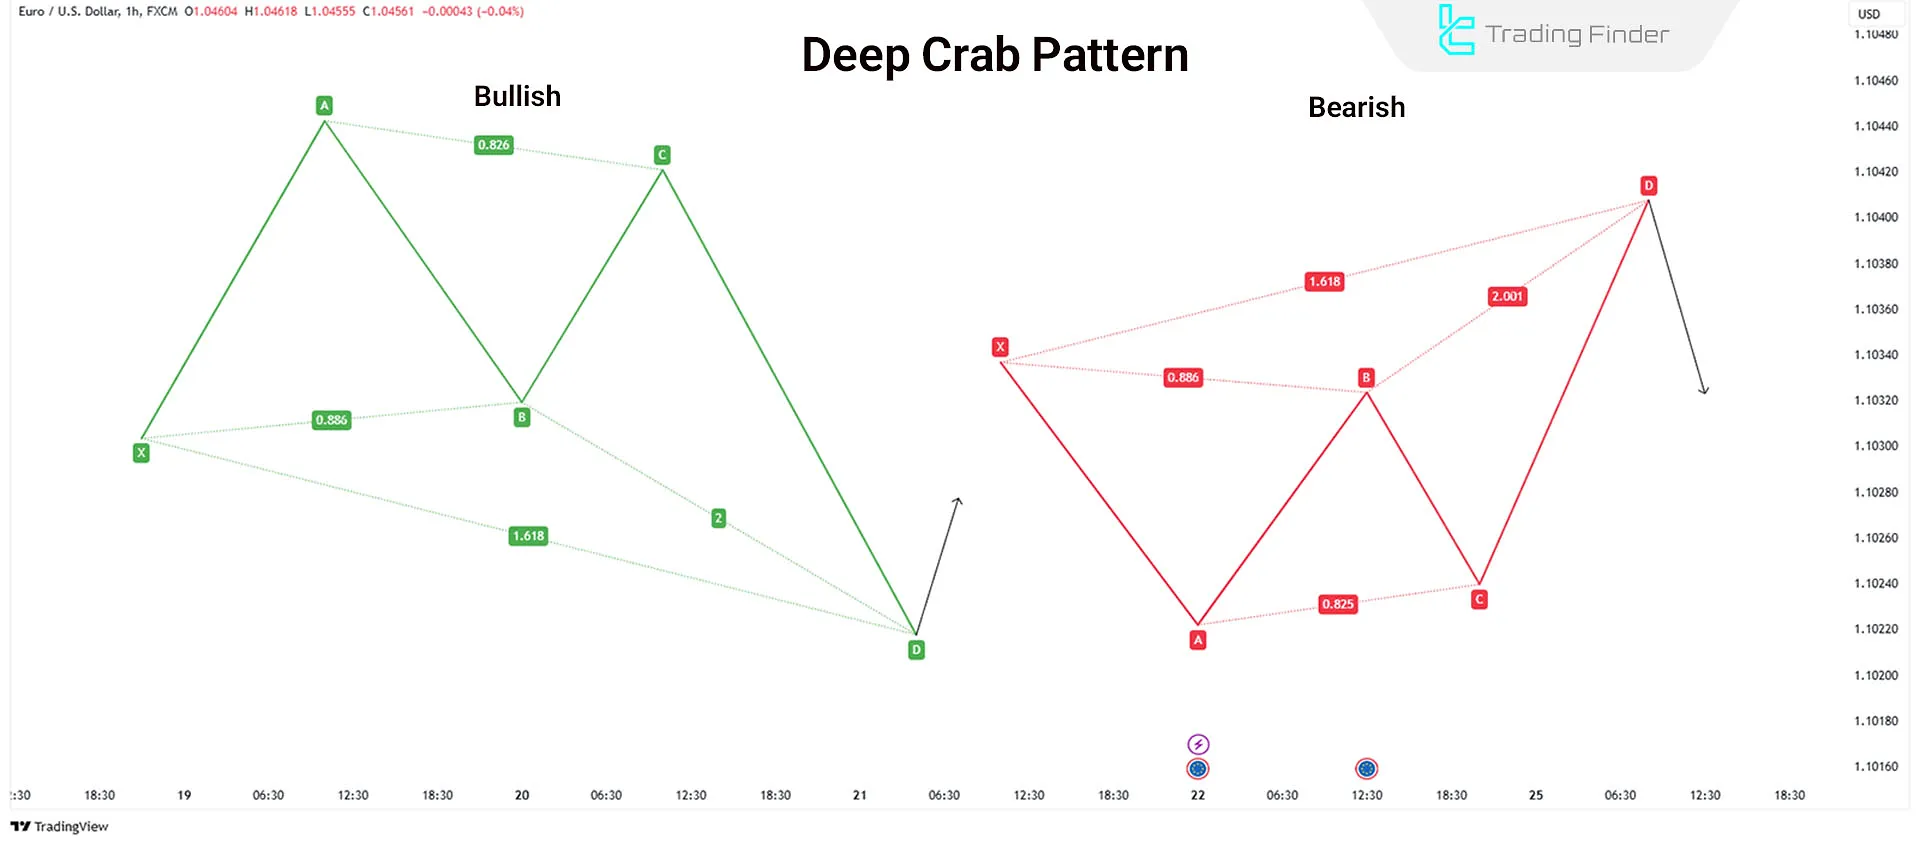
Deep Crab Pattern
The Deep Crab pattern differs slightly from the Crab pattern. The only difference is point B, which should be 0.886 of XA without exceeding it. The BC projection can range from 2.24 to 3.618.
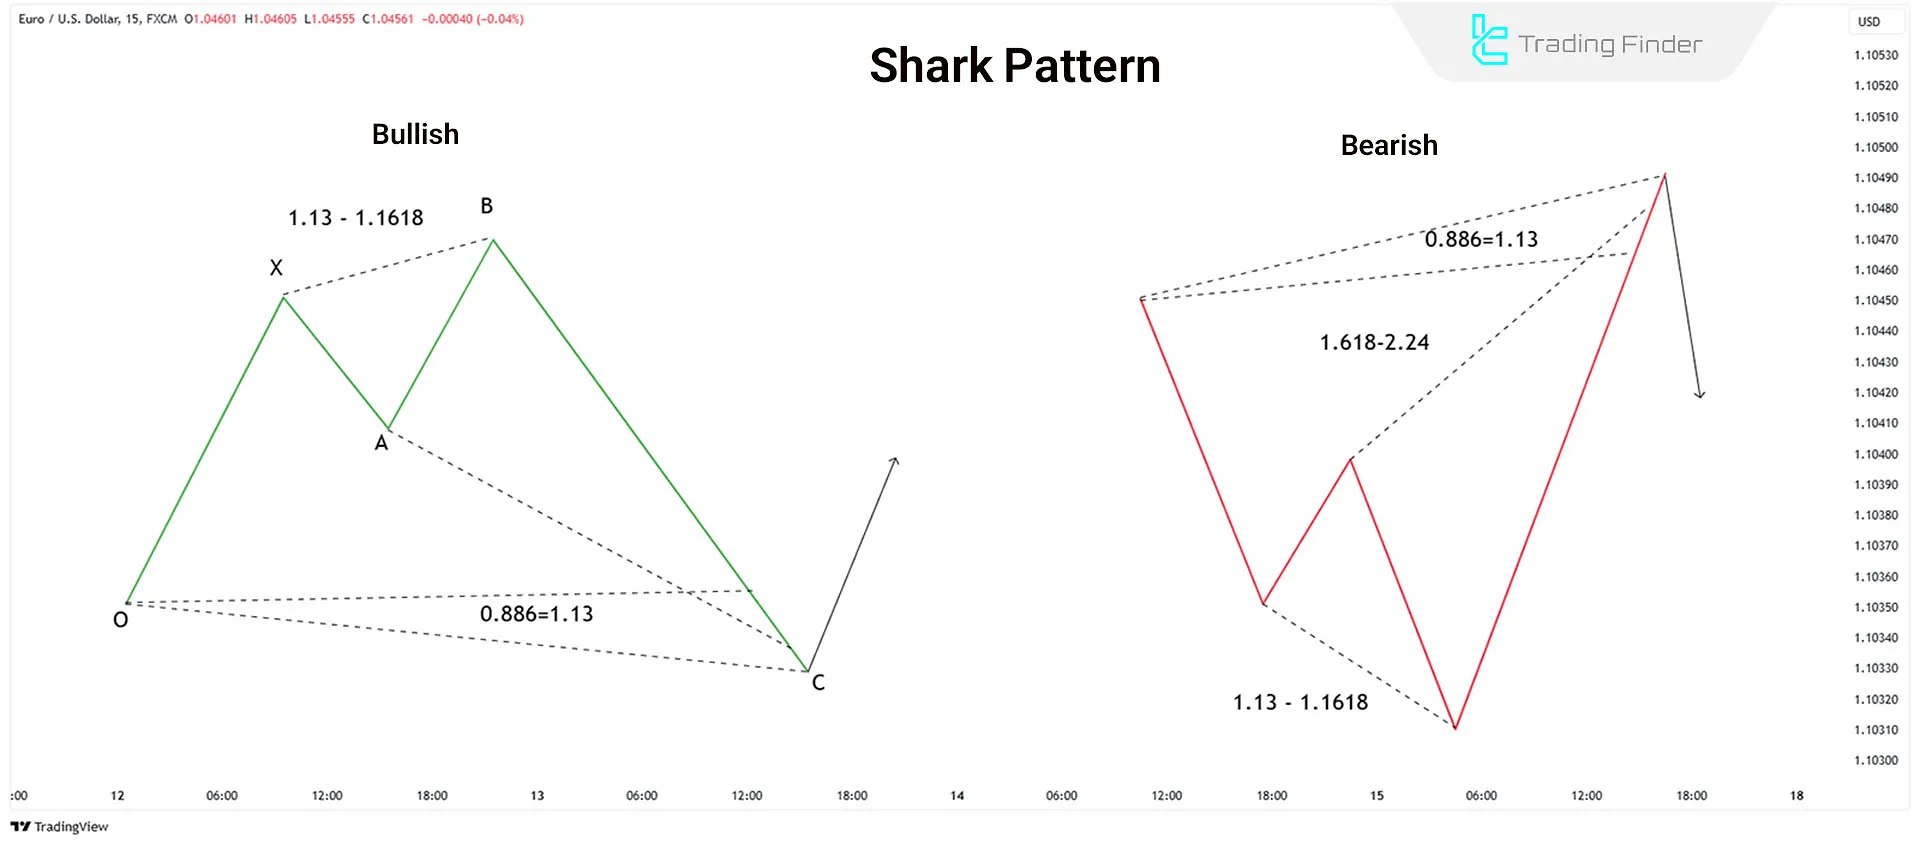
Shark Pattern
Introduced by Scott Carney, the Shark pattern is similar to the Crab pattern but consists of five points:
- O
- X
- A
- B
- X
Key Fibonacci Ratios in the Shark Pattern:
- AB correction should be between 1.13 and 1.618 of XA
- BC extension reaches 113% of OX
- Point D at 50% retracement of BC
In this pattern, trades are initiated at point C, and point D is the profit target.
Identifying and Drawing Harmonic Patterns
The identification of harmonic patterns involves three key steps:
- Locate the primary pivot points (A, B, C, D) on the price chart.
- Measure price retracements and extensions using Fibonacci levels.
- Identify the pattern structure using harmonic pattern recognition tools such as:
- Harmonic Pattern Indicator for MetaTrader 4
- Harmonic Pattern Indicator for MetaTrader 5
- Harmonic Pattern Indicator for TradingView
- Determine stop-loss and take-profit zones based on Fibonacci projections.
Trading Signals & Success Rate of Advanced Harmonic Patterns
Harmonic patterns generate multiple trading signals:
- Potential Reversal Zone (PRZ): Identifies possible trend reversal areas
- Stop-Loss Zone (SLZ): Indicates the point at which a trade should be closed to prevent further loss
- Profit Protection Zone (PPZ): Specifies the appropriate level to secure profits
- Initial Profit Objective (IPO): Defines profit targets based on Fibonacci retracements
Conclusion
Harmonic patterns use Fibonacci ratios to identify price reversal points. The primary patterns include ABCD, Bat, Gartley, Butterfly, Crab, Deep Crab, and Shark.
Combining these patterns with trend indicators and volume analysis enhances trading signal accuracy.


