


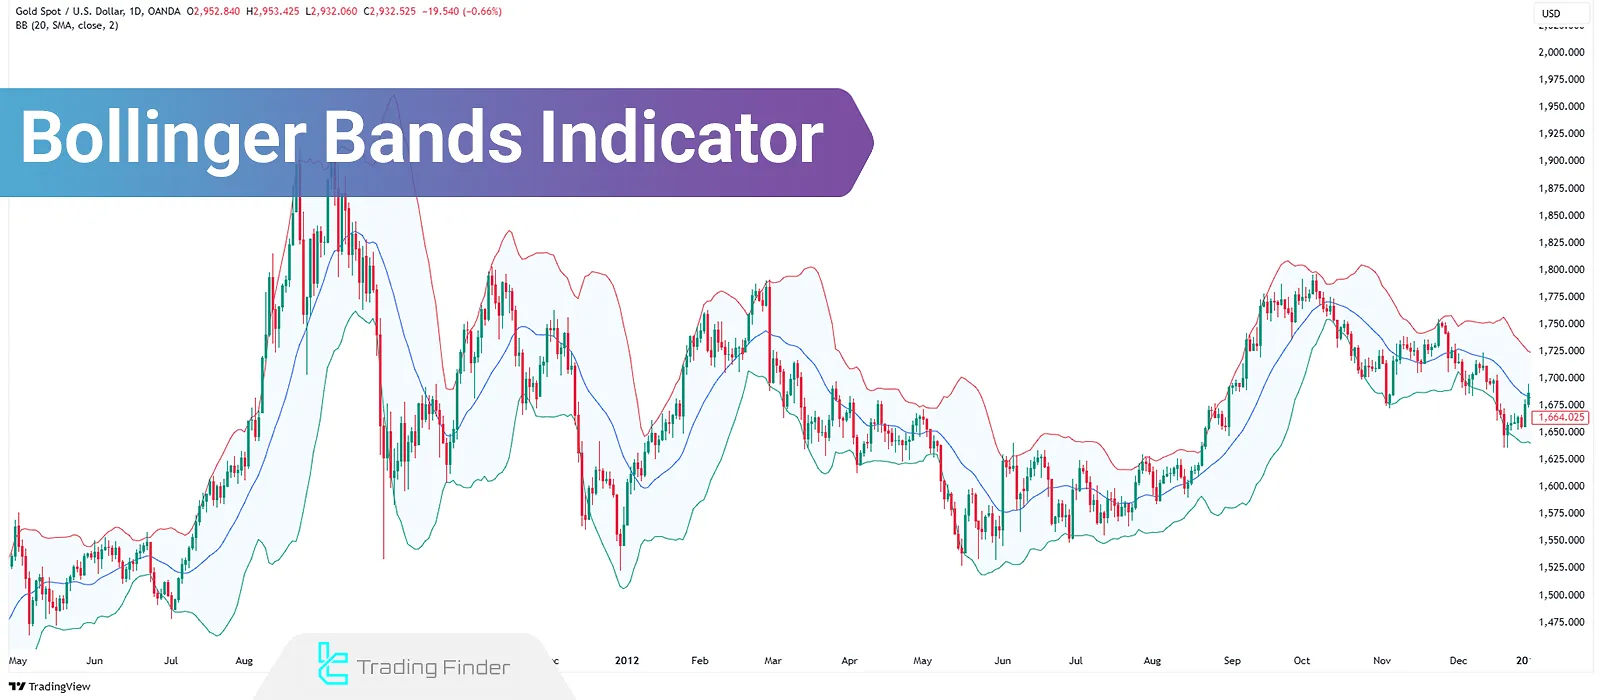
The Bollinger Bands indicator is a powerful technical analysis tool that uses a simple moving average to evaluate pricevolatility.
Well-drawn outer bands allow traders to identify overbought and oversold zones, while changes in bandwidth can signal either trend strength or potential price reversals.
It is often recommended that Bollinger Bands be used alongside other volatility indicators or technical tools to generate more accurate trading signals.
What Are Bollinger Bands?
Bollinger Bands, developed by John Bollinger in the 1980s, are a technical analysis tool that dynamically defines price boundaries to help identify overbought and oversold conditions.
By analyzing the bandwidth and price position relative to the bands, one can assess the likelihood of a trend continuation or a price reversal.
Their adaptability across different market conditions makes them highly effective, especially when combined with complementary indicators.
The Bollinger Bands indicator is used in Forex, cryptocurrencies, equities, and other markets across different timeframes.
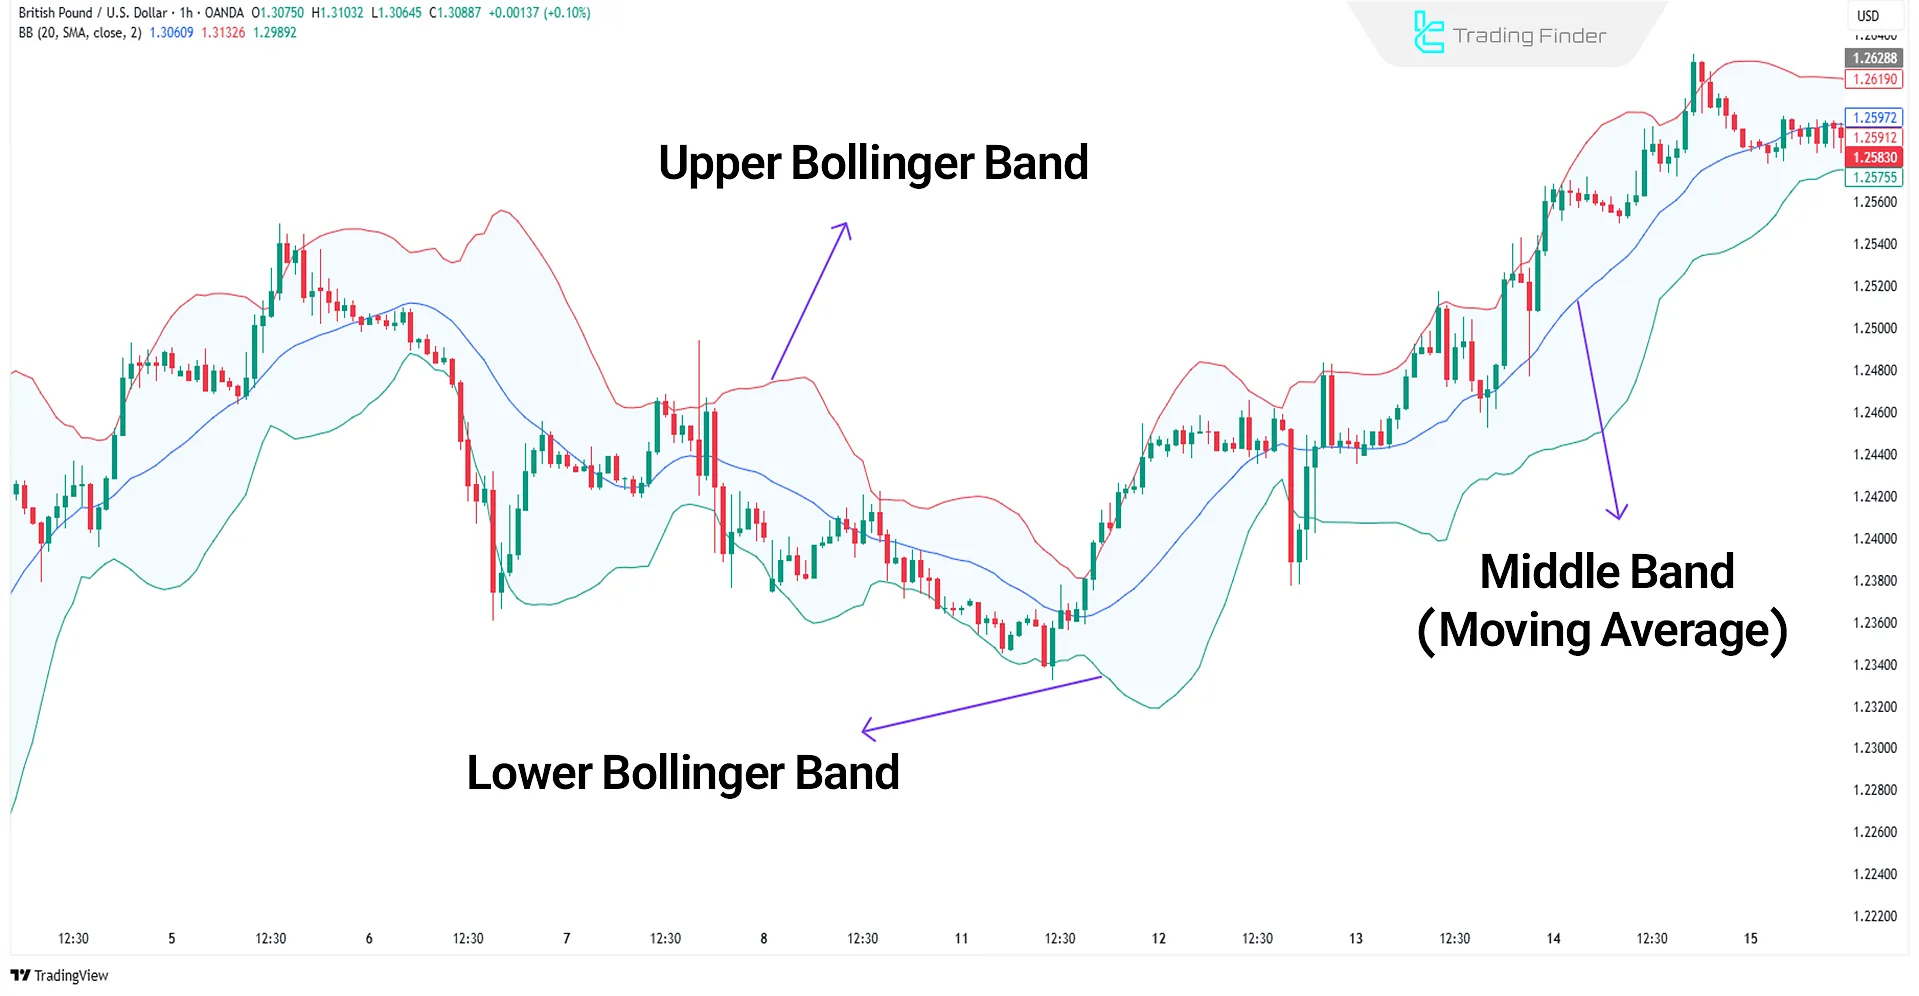
Components of Bollinger Bands
Bollinger Bands consist of three main elements, each contributing to the analysis of price positioning:
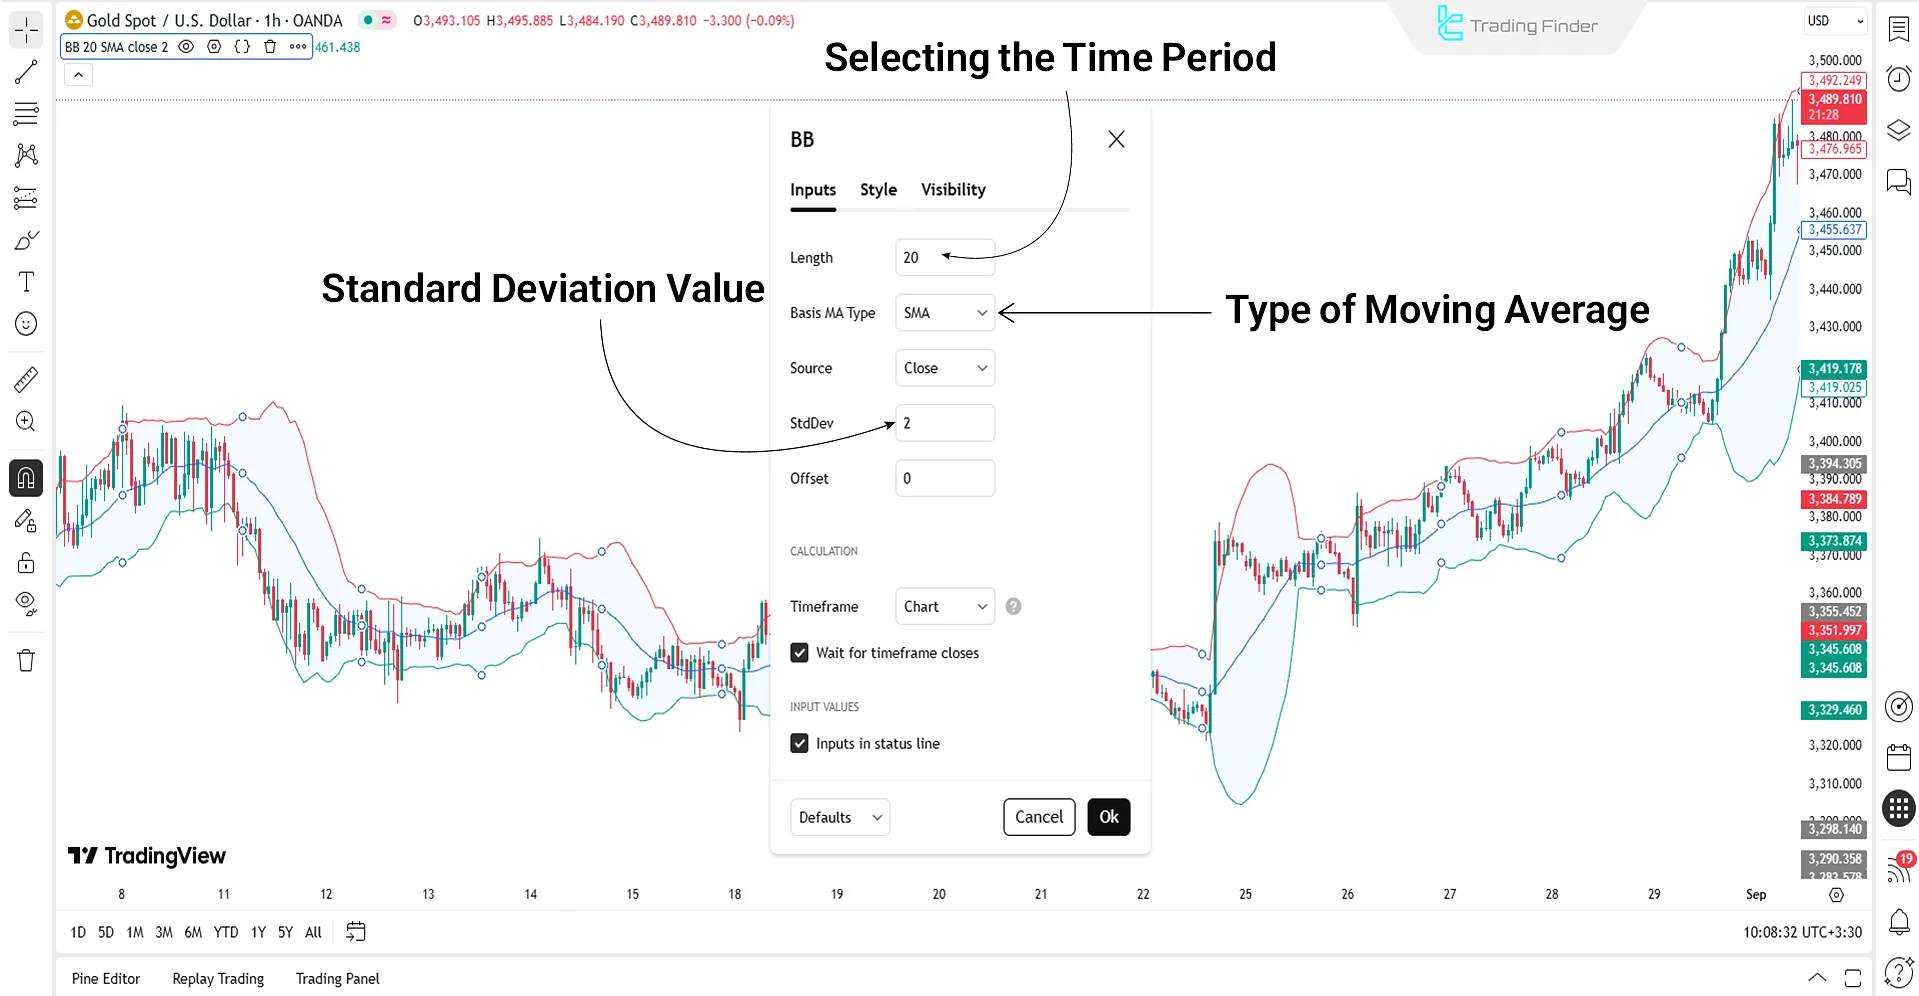
- Middle Band: 20-period simple moving average
- Upper Band: Middle band + 2 standard deviations
- Lower Band: Middle band – 2 standard deviations
The method of calculation and the formula of the Bollinger Band over n periods is as follows.
Simple Moving Average:
Standard Deviation:
Upper band:
Lower band:
Derived indicators of the Bollinger Band (Bollinger %B and Bandwidth)
The indicators derived from the Bollinger Bands are tools developed based on the logic of volatility measurement and dynamic averaging of this indicator.
These indicators address the weaknesses and limitations of the Bollinger Bands and increase signal accuracy under different market conditions.
In general, two important and widely used indicators directly inspired by the Bollinger Bands are:
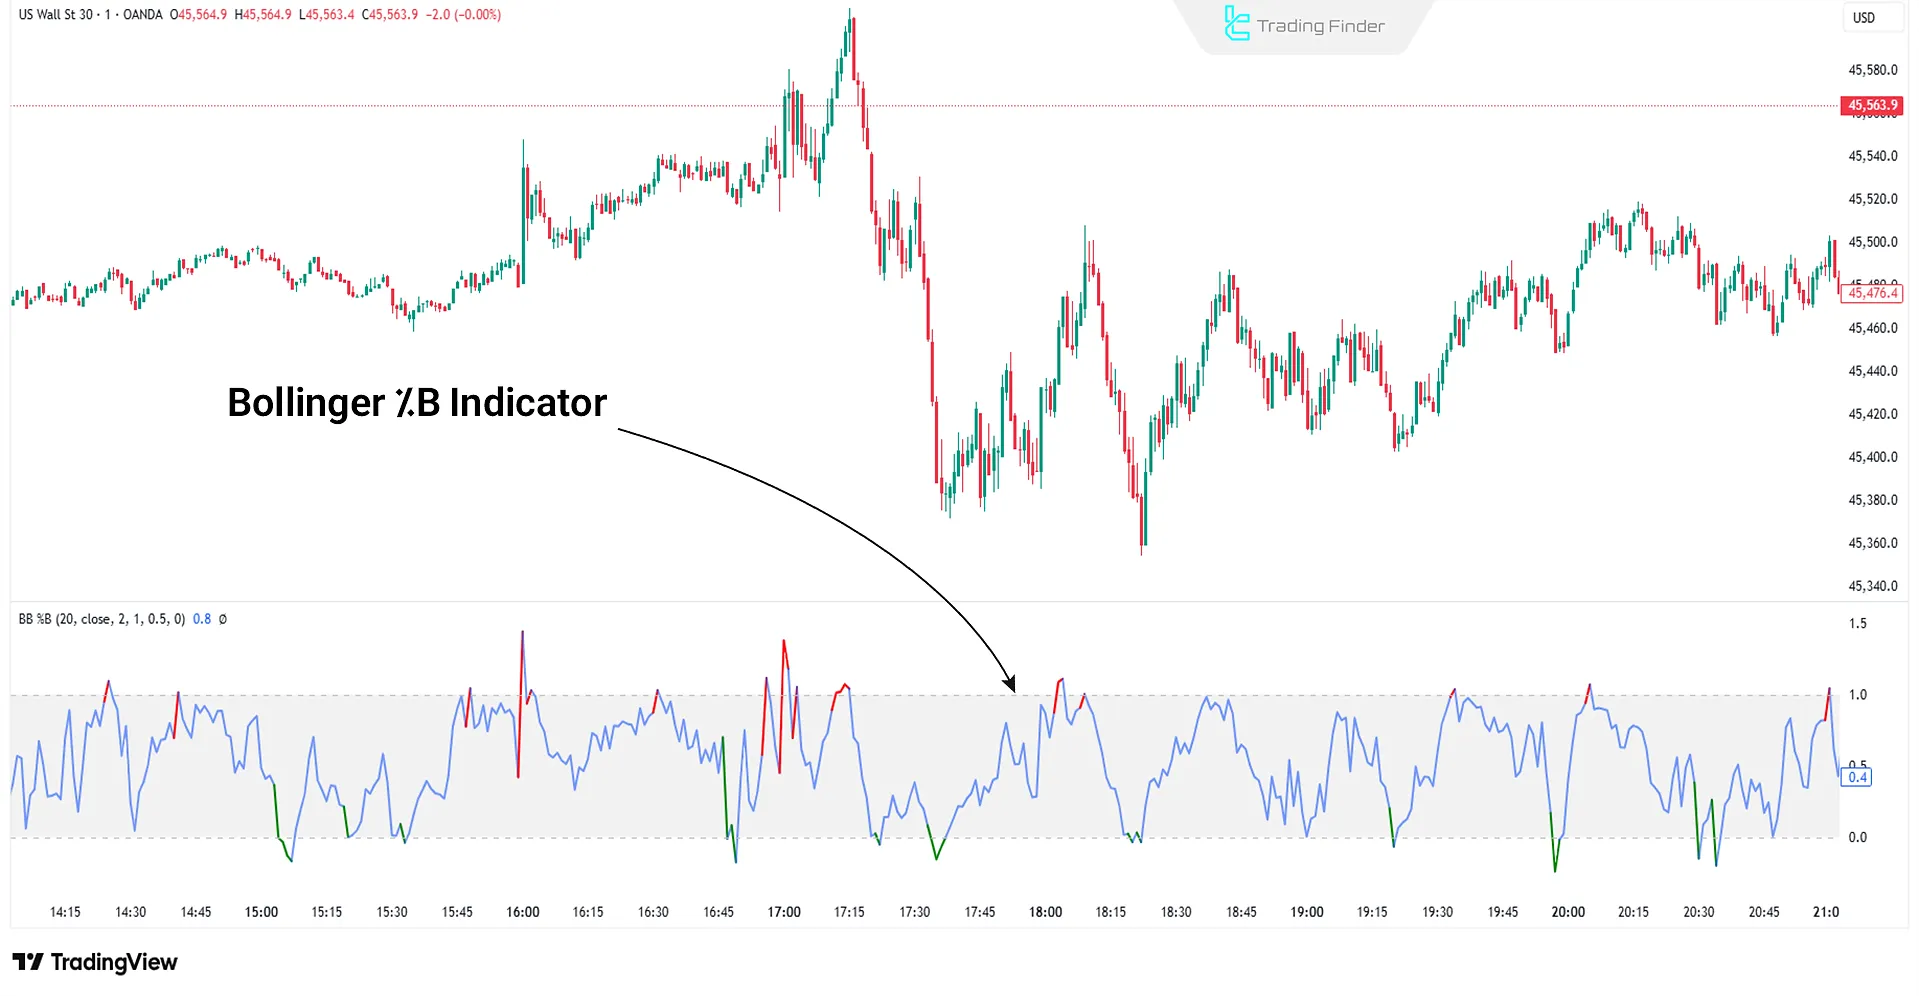
Bollinger %B
This indicator is a normalized measure that shows the price’s position relative to the Bollinger Bands. Values close to 1 indicate the price is at the upper band (potential overbought), and values near zero indicate proximity to the lower band (potential oversold).
Bollinger %B formula:
Crossing above 1 or falling below 0 indicates a temporary band breach and the possibility of a price reversal or trend continuation.
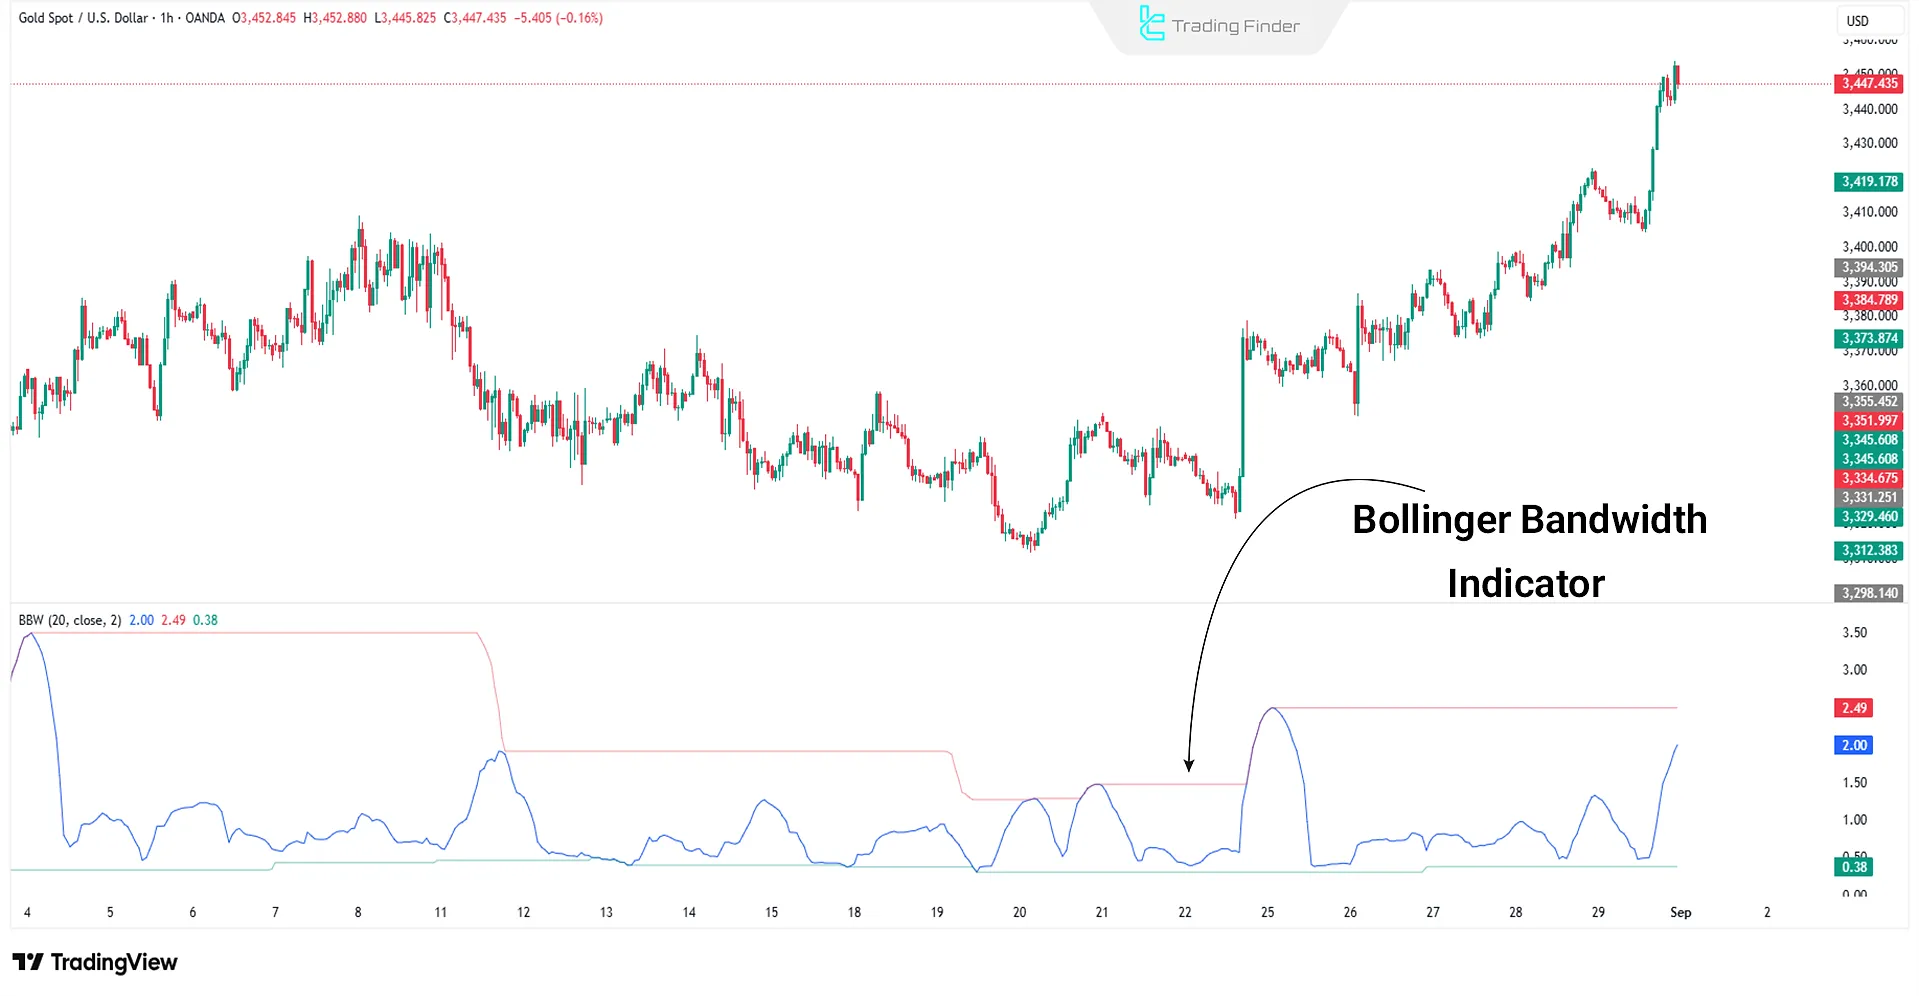
Bandwidth Indicator
The Bollinger Bandwidth indicator is a measure of the relative distance of the bands from the moving average to display market volatility and periods of squeeze or expansion.
In practice, this indicator calculates the relative width of the bands based on the middle moving average; the larger it is, the higher the volatility and the wider the bands.
Bandwidth formula:
Low values in Bandwidth indicate band squeeze and reduced volatility, which is often used as a preliminary signal for an explosive price move.
Comparison of Bollinger Bands with its derived indicators (Bandwidth, Bollinger %B)
Using each version of the Bollinger Bands and its derivatives has its own pros and cons. Below is a comparison of the Bollinger Bands family with practical examples:
Indicator Name | Advantages | Disadvantages | Practical Example / Key Notes |
Bollinger Bands | Identify dynamic support and resistance levels, display market volatility, detect breakouts | False signals in ranging markets, requires combination with other indicators for confirmation | Useful for spotting price reversals near the bands and assessing price breakouts |
Bollinger Bandwidth | Accurate measurement of volatility, detect start or end of strong trends, signals during band squeeze periods | Does not identify market direction, needs interpretation alongside price action or other indicators | High probability of a strong move (breakout) when Bandwidth contracts significantly |
Bollinger %B | Determine overbought/oversold conditions, clarify relative price position, ideal for use with moving average strategies | False signals in highly volatile markets | When %B is near 1, price is in overbought zone; near 0 indicates oversold zone |
Advantages and Disadvantages of Bollinger Bands
Like any other analytical tool, the Bollinger Bands indicator comes with its own set of advantages and limitations:
Advantages | Disadvantages |
Identifies market volatility | Requires complementary indicators |
Simple to use and easy to understand | Not suitable for forecasting |
Detects overbought and oversold conditions | Needs precise configuration |
Defines the range of price fluctuations | May produce false signals in volatile markets |
Using Bollinger Bands to Detect Trends
The reaction of Bollinger Bands to price movement reveals key insights into market trends:
- Band Expansion: Indicates rising volatility and the potential start of a strong bullish or bearish trend;
- Band Contraction: Suggests a drop in volatility, signaling potential entry into a sideways market.
Analyzing the expansion and contraction dynamics of the bands is crucial for identifying the initiation points of strong price moves.
For more information on identifying trends using the Bollinger Band indicator, you can also Learn Bollinger Bands from the article on Investopedia.com.
Measuring Volatility with Bollinger Bands
The space between the upper and lower bands reflects the price volatility range:
- Narrowing bands: indicate decreasing volatility and tight price action, often preceding strong breakouts;
- Widening bands: suggest increased volatility and the potential start of a new trend a basis for entry or exit strategies.
Careful analysis of bandwidth shifts offers an advanced method to detect early market movements.
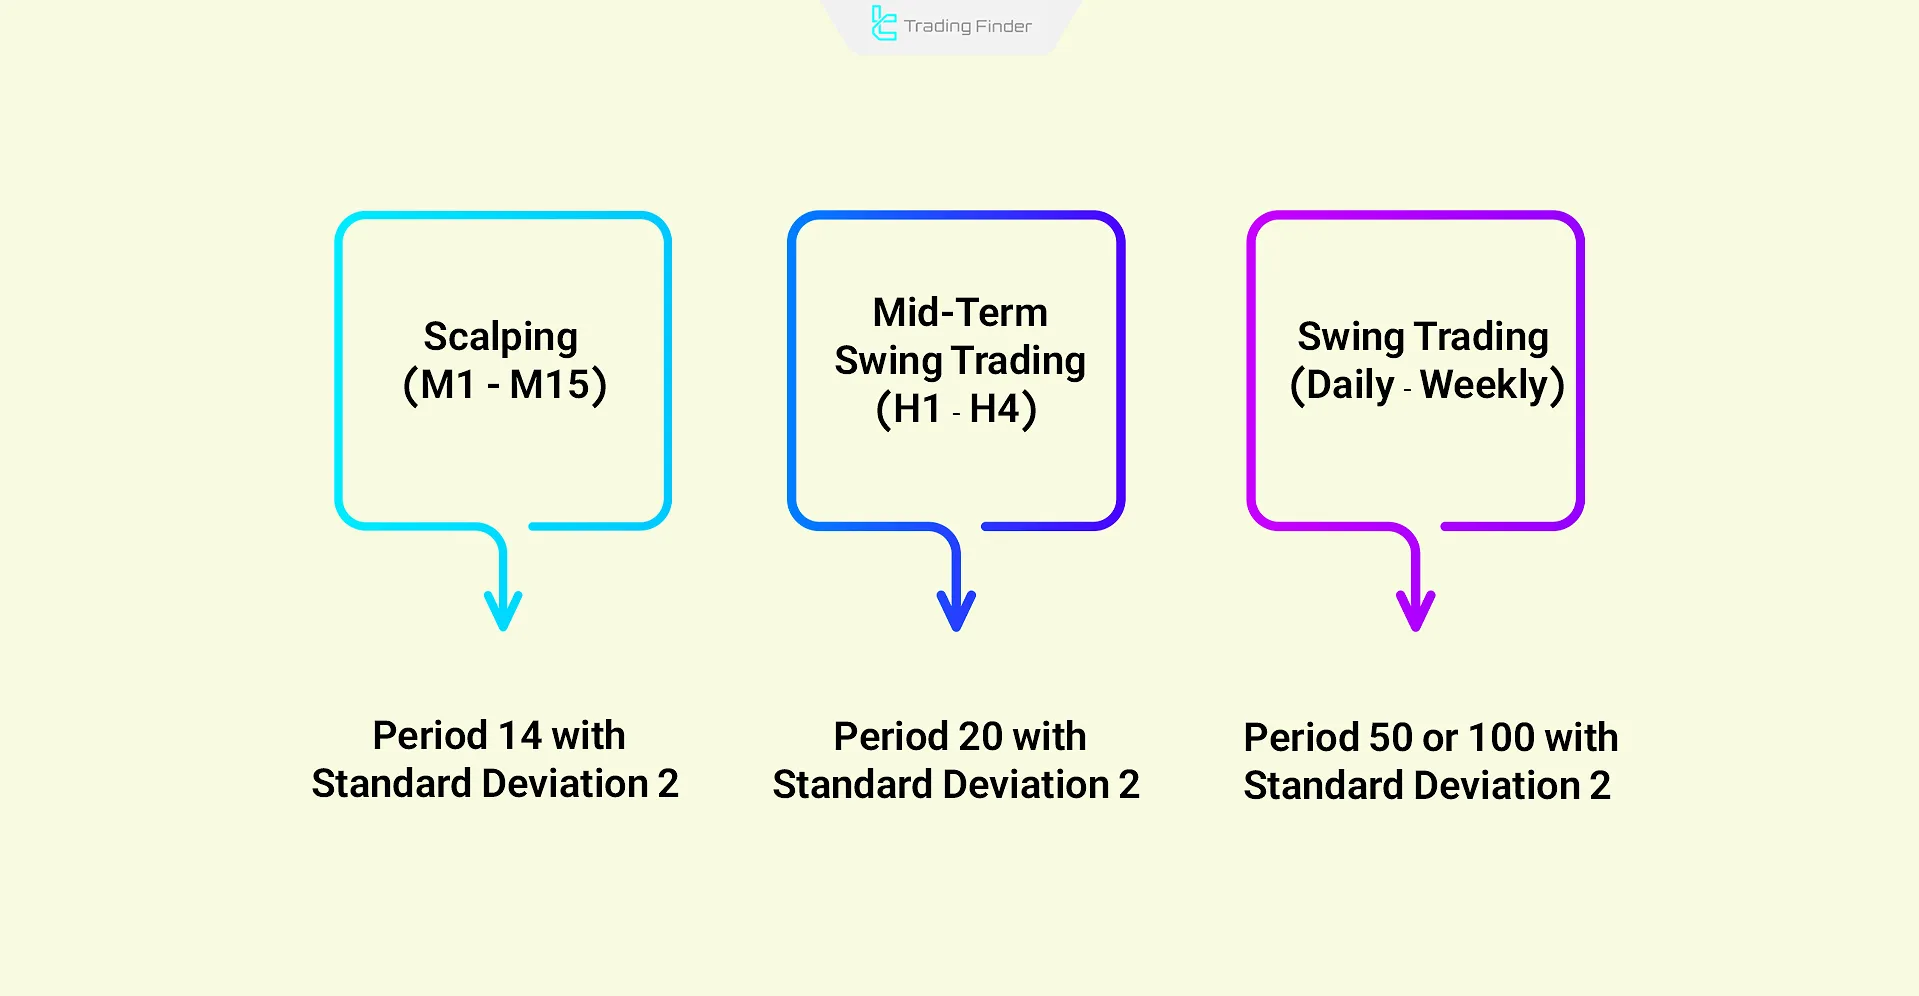
Bollinger Bands indicator settings by market and timeframe
For the best settings of the Bollinger Bands indicator, the default is commonly used, but it should be optimized by market and timeframe. The key is choosing an appropriate Period and Deviation.
Settings by market:
- Forex (currency pairs): period 20 with deviation 2 (for normal volatility); for highly volatile pairs like GBP/JPY, deviation 2.5;
- Stocks (Stock Market): period 20 or 21 with deviation 2; for high-risk, high-volatility stocks, period 10 to 14;
- Cryptocurrency (Crypto): for heavy volatility, use shorter periods (10 to 14) with deviation 2.5 or even 3;
- Commodities and Indices: often period 20 and deviation 2; for markets with explosive moves (such as oil or NASDAQ) deviation 2.5.
Settings by timeframe:
- Scalping (M1 – M15): shorter periods like 10–14 with deviation 2 for quicker responsiveness;
- Mid-term swing (H1 – H4): standard period 20 and deviation 2;
- Swing trading (Daily – Weekly): longer periods like 50 or even 100 with deviation 2 to identify the market’s broader trend.
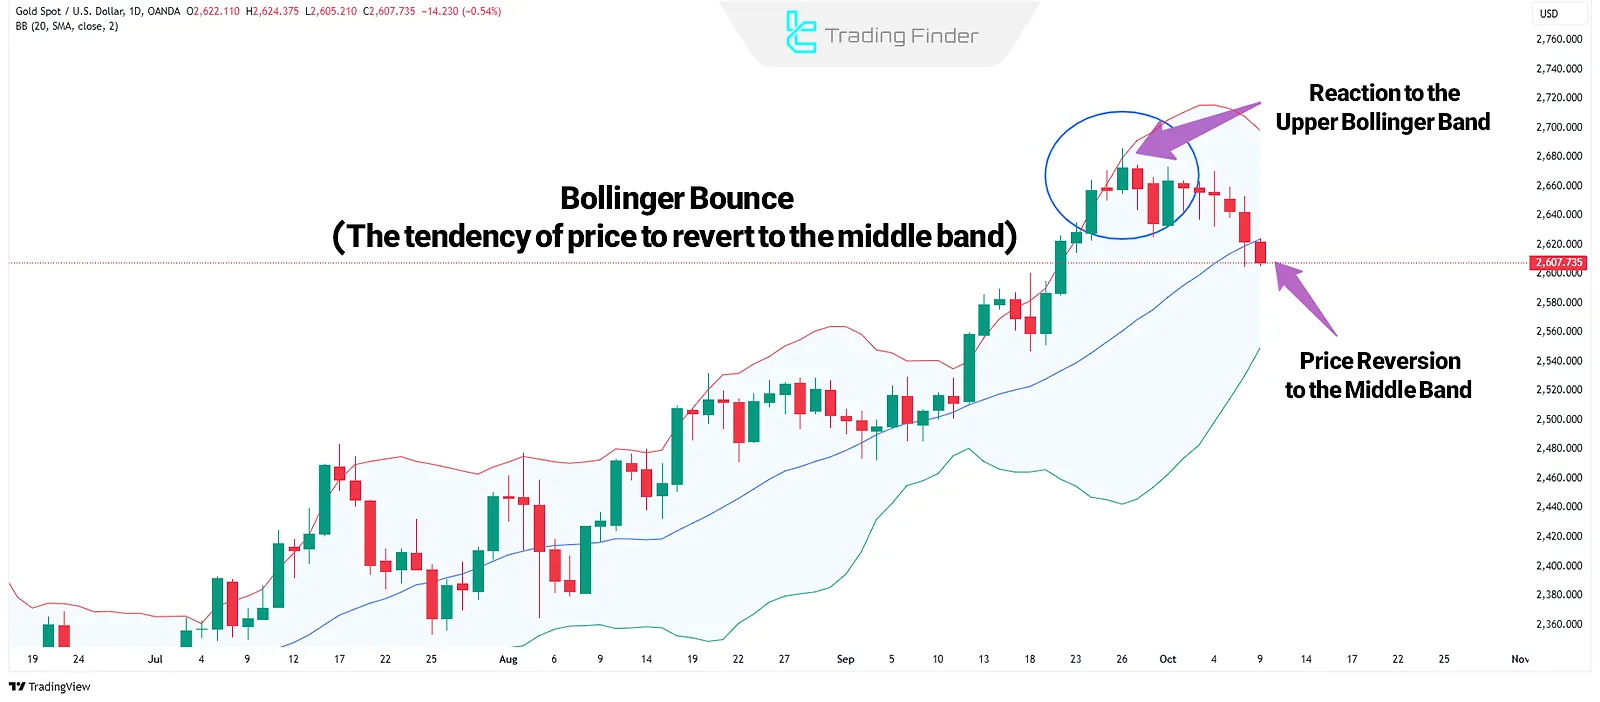
What Is Bollinger Bounce?
Price tends to revert toward the middle band in the Bollinger Bands setup, which often acts as support or resistance.
When the price deviates significantly and moves back toward the middle band, this behavior is known as a Bollinger Bounce.
Trading Strategies with the Bollinger Bands Indicator
To maximize the use of the Bollinger Bands Indicator, traders can apply a variety of strategies focused on price behavior near the bands:
- Walking the Band Strategy
- Double Top or Bottom Strategy
- Reversal Pattern within Bands
- Band Squeeze Breakout Strategy
- Middle Band Range Trading Strategy
For a better understanding of Bollinger Bands Strategy variations, you can watch John Bollinger’s discussion on the MetaStock YouTube channel:
Bollinger Bands and MACD indicator
The Bollinger Bands MACD indicator in MetaTrader is a composite tool that merges two key indicators MACD and Bollinger Bands—so you can analyze both trend and volatility simultaneously. This structure provides an integrated view of direction, momentum strength, and the intensity of price changes.
Its primary use is in Forex, stocks, and cryptocurrencies, where traders need to detect reversals, trend continuations, and define entry/exit zones.
- Bollinger Bands: display volatility; the bands widen in high volatility and contract in calm markets;
- MACD: analyzes trend and momentum; the MACD line crossing the bands or breaking ranges is interpreted as buy/sell signals;
- Combined signaling module: identifies entry and exit conditions with higher precision.
This indicator performs strongly in intraday trading and multi-timeframe analysis and helps filter out false signals.
In an uptrend, the MACD line crossing the upper band along with a color change from purple to green signals strengthening or resumption of the uptrend.
In a downtrend, a MACD color change from green to purple after crossing the upper band is a warning of overbought conditions and a potential price correction.
One of the strengths of this indicator is its fine-tuned configurability. Parameters such as MACD fast and slow periods (12 and 26), Bollinger calculation period (10), standard deviation (2.5), and alert type (audio or email) are customizable.
Ultimately, the Bollinger Bands MACD is an advanced tool that combines trend and volatility analysis which, when used alongside price action or volume indicators, can reduce risk and increase decision-making accuracy in highly volatile markets.
- Download the combined Bollinger Bands and MACD indicator for MetaTrader 4
- Download the combined Bollinger Bands and MACD indicator for MetaTrader 5
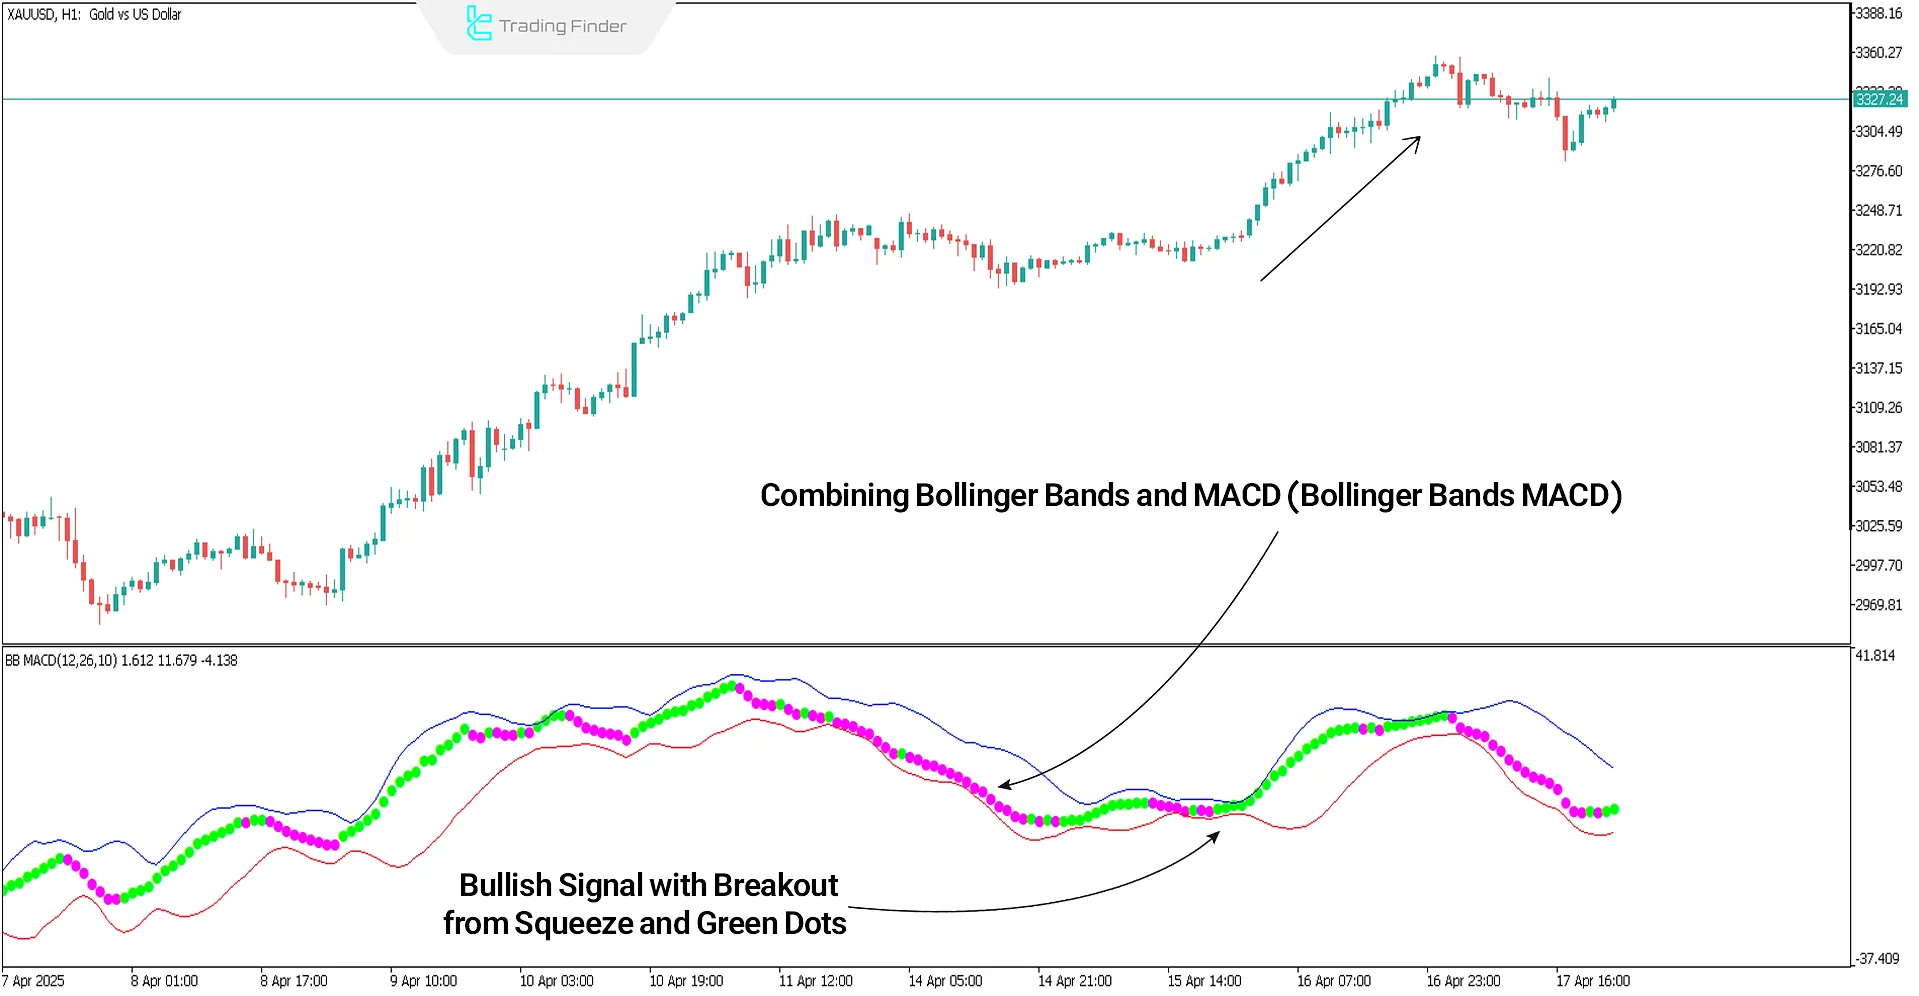
Example of using the Bollinger Bands and MACD indicator
In the example below, green and purple dots represent MACD signals; when the dots turn green and price exits a Bollinger Band squeeze upward, a buy signal is generated.
Conversely, when the dots are purple and price exits a squeeze to the downside, a sell signal is generated.
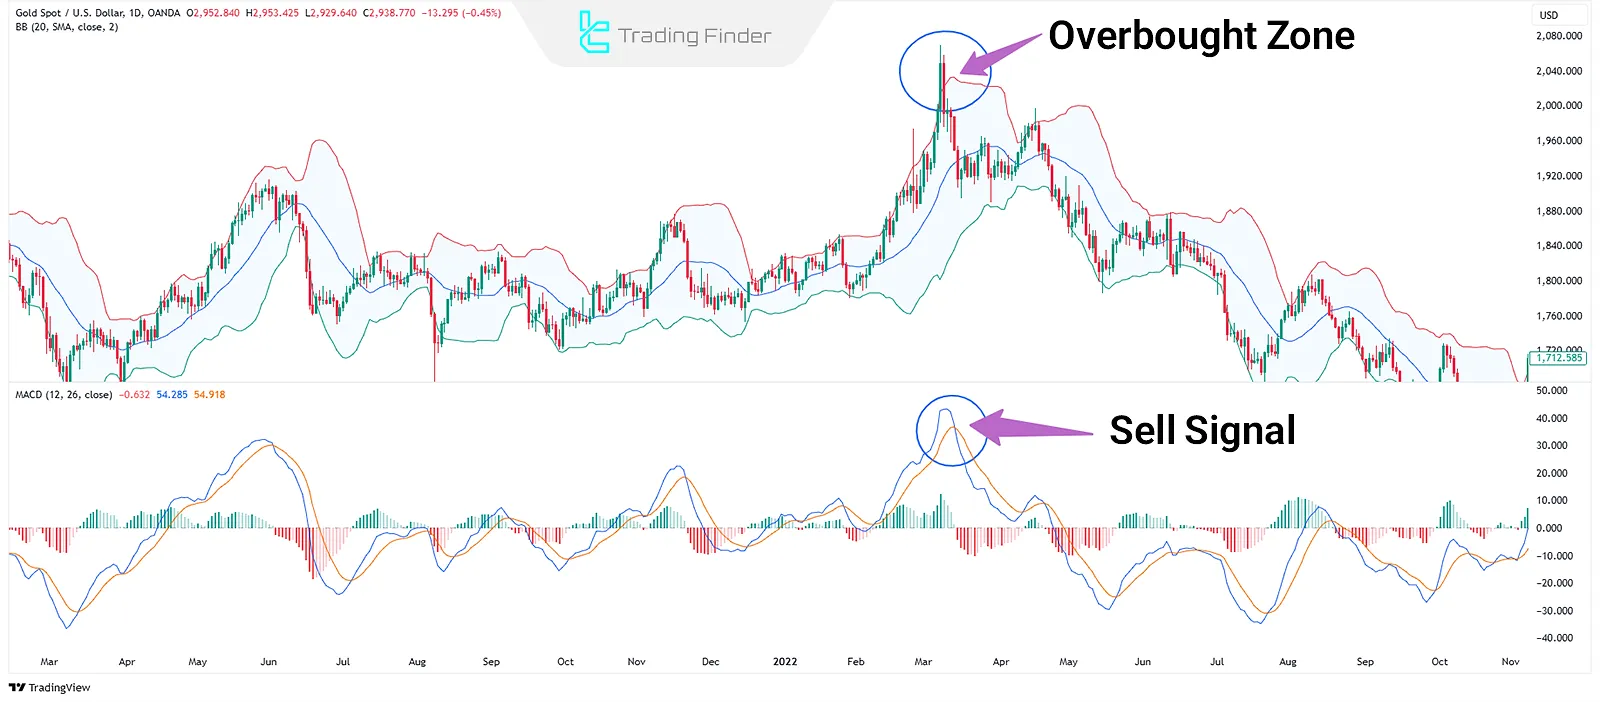
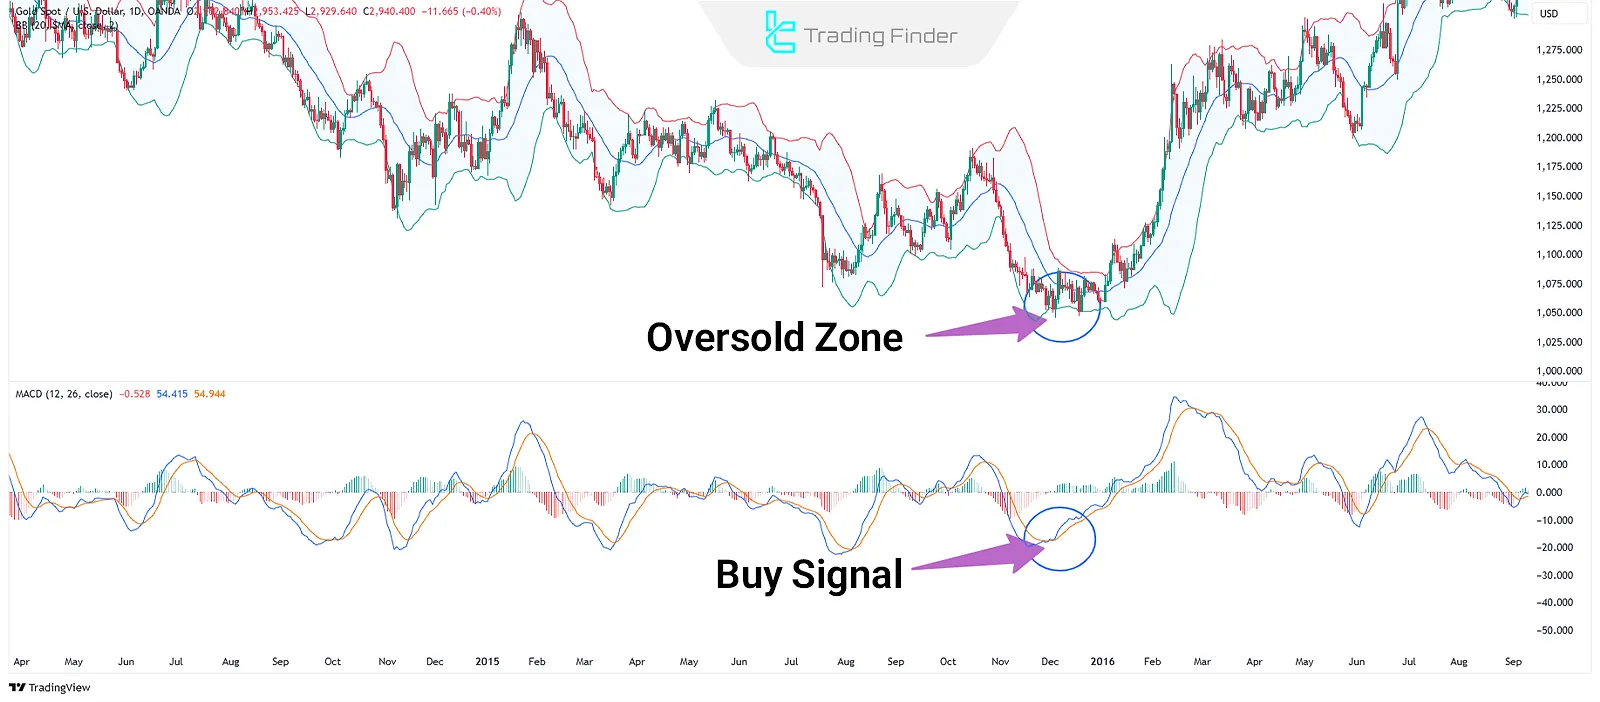
Trading with Bollinger Bands and MACD Combination
When the price reaches overbought or oversold zones on Bollinger Bands, it is essential to cross-check with the MACD indicator. The MACD Line crossing the Signal Line can serve as a trade confirmation.
- Oversold Zone (Lower Band): Look for MACD lines below zero to validate long entries;
- Overbought Zone (Upper Band): MACD lines above zero confirm bearish momentum.
This setup filters out false signals and focuses only on valid market moves.
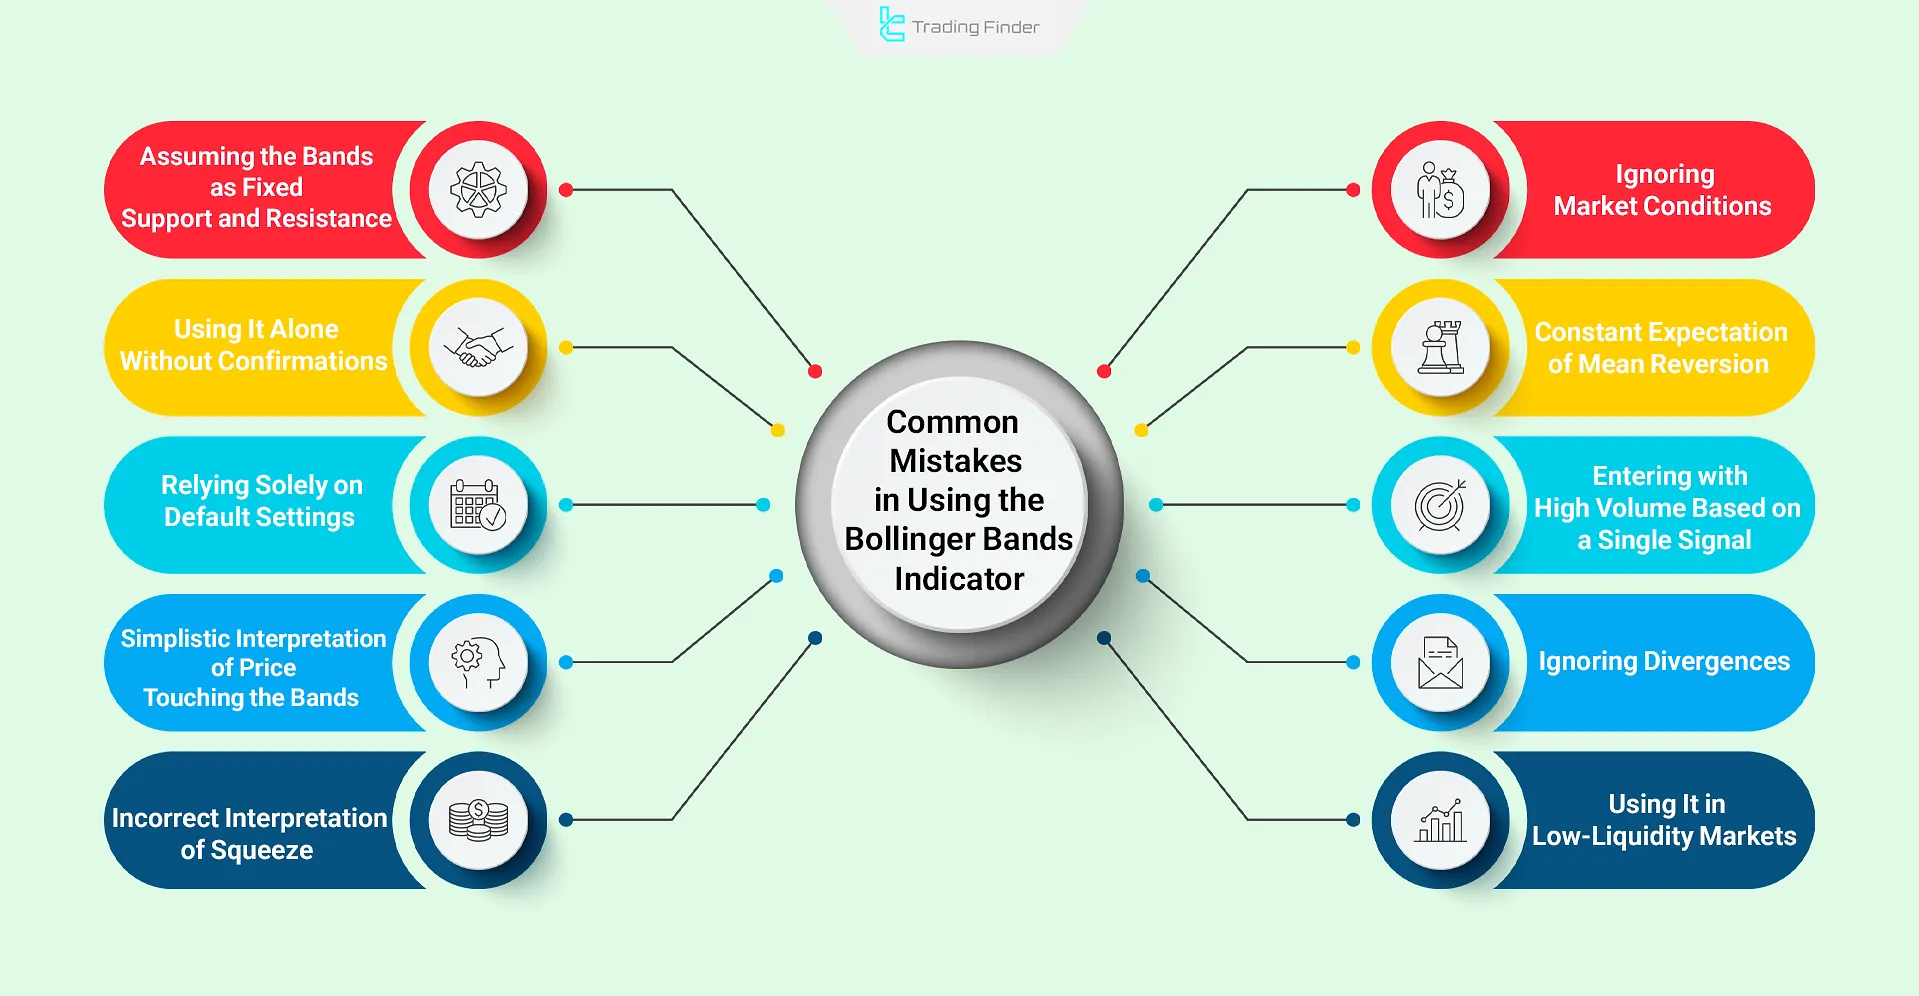
Common mistakes when using the Bollinger Bands indicator
Traders often rely on a Bollinger Bands Strategy with candlestick analysis in their trading, but to use this tool properly, it’s important to be aware of the common mistakes below:
- Assuming the bands are fixed support/resistance: the bands are dynamic and merely show a volatility envelope; there is no certainty of reversal at these zones;
- Using it alone without confirmatory tools: focusing only on the bands produces false signals and it must be combined with tools like RSI or price action;
- Oversimplified interpretation of price touching the bands: immediate entries on a band touch are wrong; in strong trends, price can ride the band for a long time;
- Misinterpreting the squeeze: the squeeze is only a warning of increased volatility; a valid breakout requires confirmation;
- Relying solely on default settings: the 20-period, 2-deviation defaults are not always suitable; they must be adapted to timeframe and market;
- Ignoring market conditions: Bollinger Bands work better in ranging markets; in strong trends they can give misleading signals;
- Expecting a constant mean reversion: the moving average is not always the destination; in trending markets it can move with the trend;
- Entering with large size on a single signal: without risk management, even a small fake breakout can cause a large loss;
- Ignoring divergences: repeated price touches on the bands alongside divergence can be a significant trend-change signal;
- Using it in illiquid markets: on thinly traded assets, band calculations can be noisy and misleading.
Conclusion
The Bollinger Bands indicator is a popular technical analysis tool that provides valuable insight into price volatility, trend strength, and key levels.
Using standard deviation and a simple moving average, it allows traders to spot overbought or oversold conditions, band squeezes and breakout opportunities.
When combined with other tools especially MACD the Bollinger Bands Strategy becomes more precise, particularly during high-volatility or consolidation phases.


