


Average True Range (ATR) is a tool that shows how much a price moves within a specific timeframe (e.g., one day).
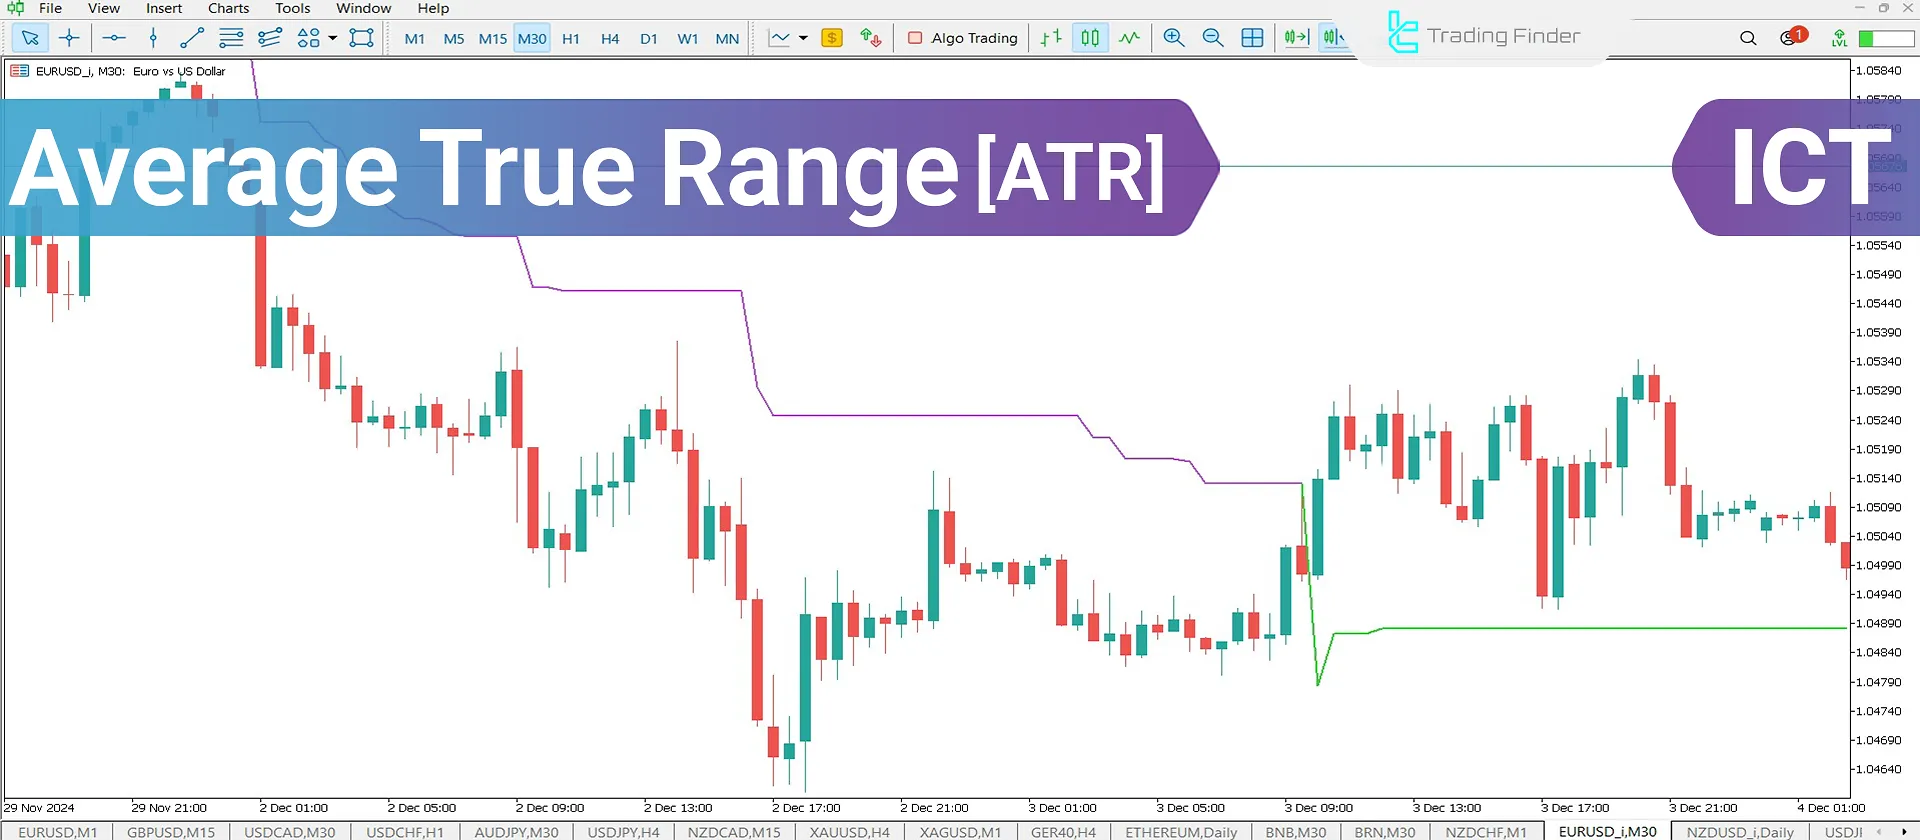
Thismovement includes all price changes, such as increases, decreases, and even price gaps. Simply put, ATR measures price volatility and tells us how active or calm the market currently is.
What is the Average True Range (ATR)?
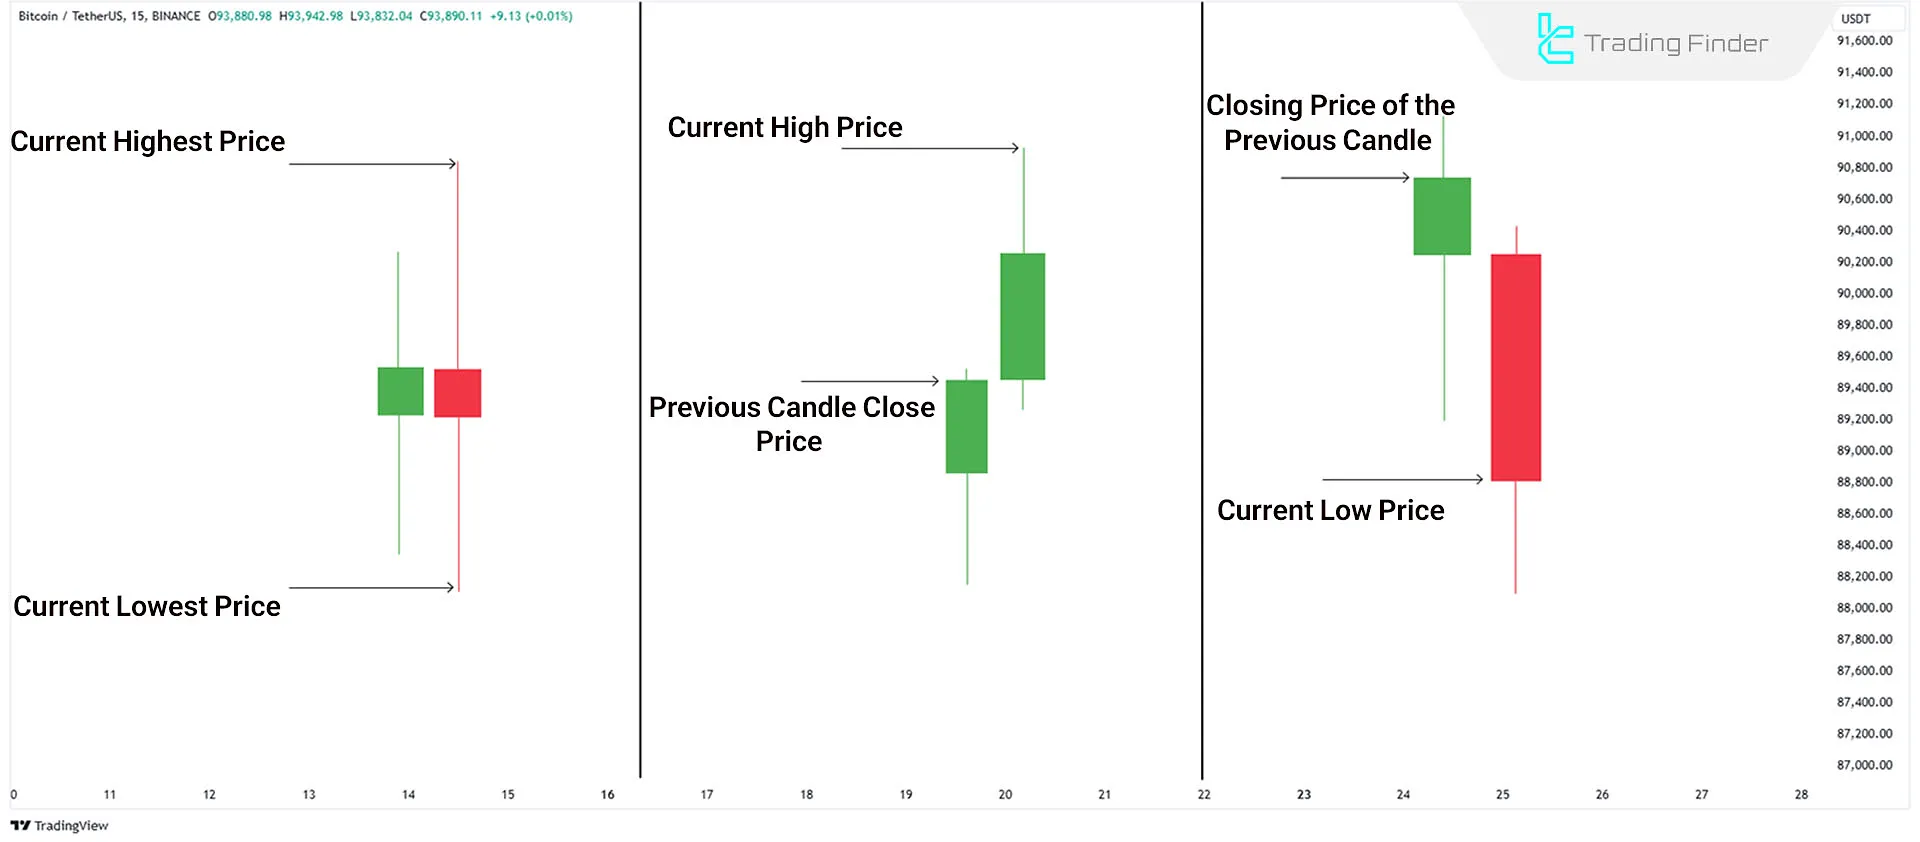
To understandthe Average True Range (ATR), you must first know what True Range (TR) is. True Range refers to the largest price movement within a specific timeframe (e.g., one day) and is calculated in three ways:
- The distance between the current high and low
- The distance between the previous candle’s close and the current high
- The distance between the previous candle’s close and the current low
The largest value among these three is considered the True Range for that timeframe. Then, ATR is calculated by averaging these values over multiple periods (typically 14). This number indicates how much the price has fluctuated, on average, during that time.
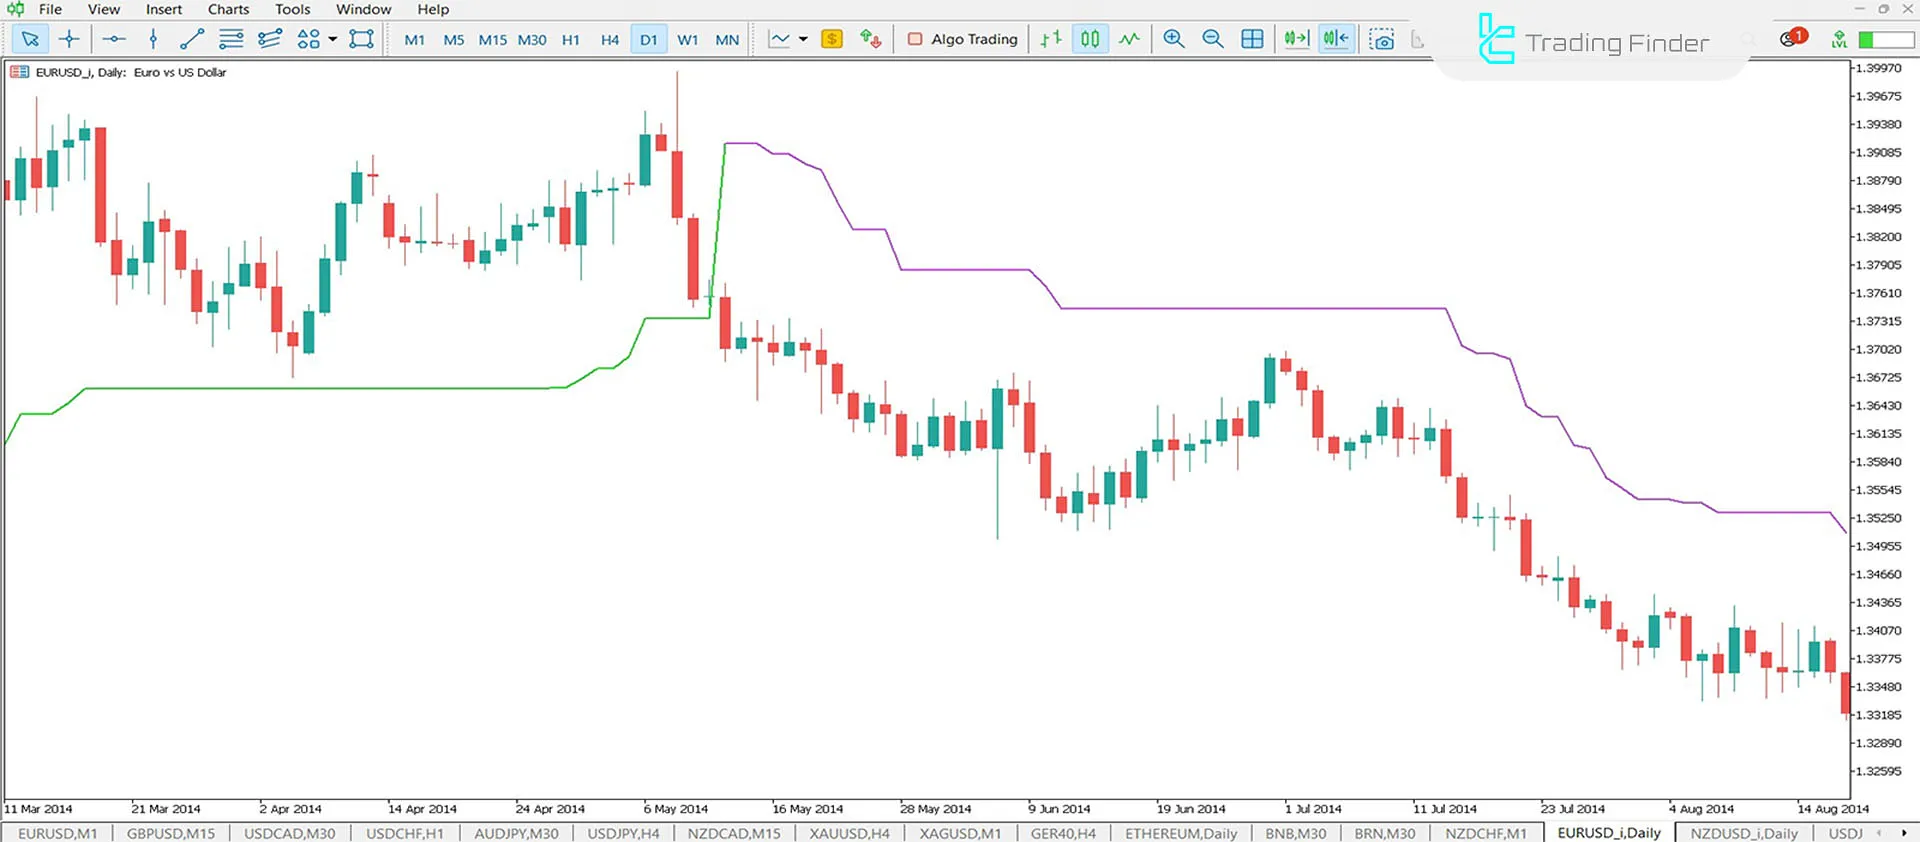
Traders often useATR indicators, such as those available on TradingFinder, for practical application:
- ATR Indicator for MetaTrader 4
- ATR Indicator for MetaTrader 5
- ATR Indicator for TradingView
Why is ATR Important?
Average True Range (ATR) has significant importance in technical analysis, including:
Understanding Market Volatility
ATR shows traders how volatile or calm the market is. High ATR values indicate high volatility, while low ATR values suggest a calm market with smaller price changes.
Identifying Market Conditions
When significant events, such as economic news or unexpected occurrences, happen, ATR values increase. Conversely, when the market is calm and lacks a clear trend, ATR values decrease.
Assisting in Risk Management
Traders can manage their risks better using ATR. In highly volatile markets with high ATR, caution is necessary due to sharp price changes.
Forecasting Future Volatility
ATR can help estimate how much prices may move in the future, aiding in better decision-making.
Advantages and Disadvantages of ATR
The table below outlines the advantages and disadvantages of the Average True Range (ATR) indicator:
Pros | Cons |
Provides an accurate measure of market volatility | Does not determine the price direction (upward or downward) |
Can be used in all markets and asset classes | Requires combination with other tools |
Helps manage risk and adjust trades | - |
Conclusion
Average True Range (ATR) is a simple method to measure price volatility, enabling traders to adjust entry, exit, and position sizing in their trades.
Since ATR does not indicate price direction, combining it with other tools is advisable for better risk management and successful trading outcomes.


