


Break of Structure (BOS) refers to continuing the market trend by breaking the previous structure. By leveraging the Break of Structure (BOS) concept, traders can identify trend-following trades and determine the market direction.
A bullish BOS indicates higher prices in the future, while a bearish BOS signals lower prices.
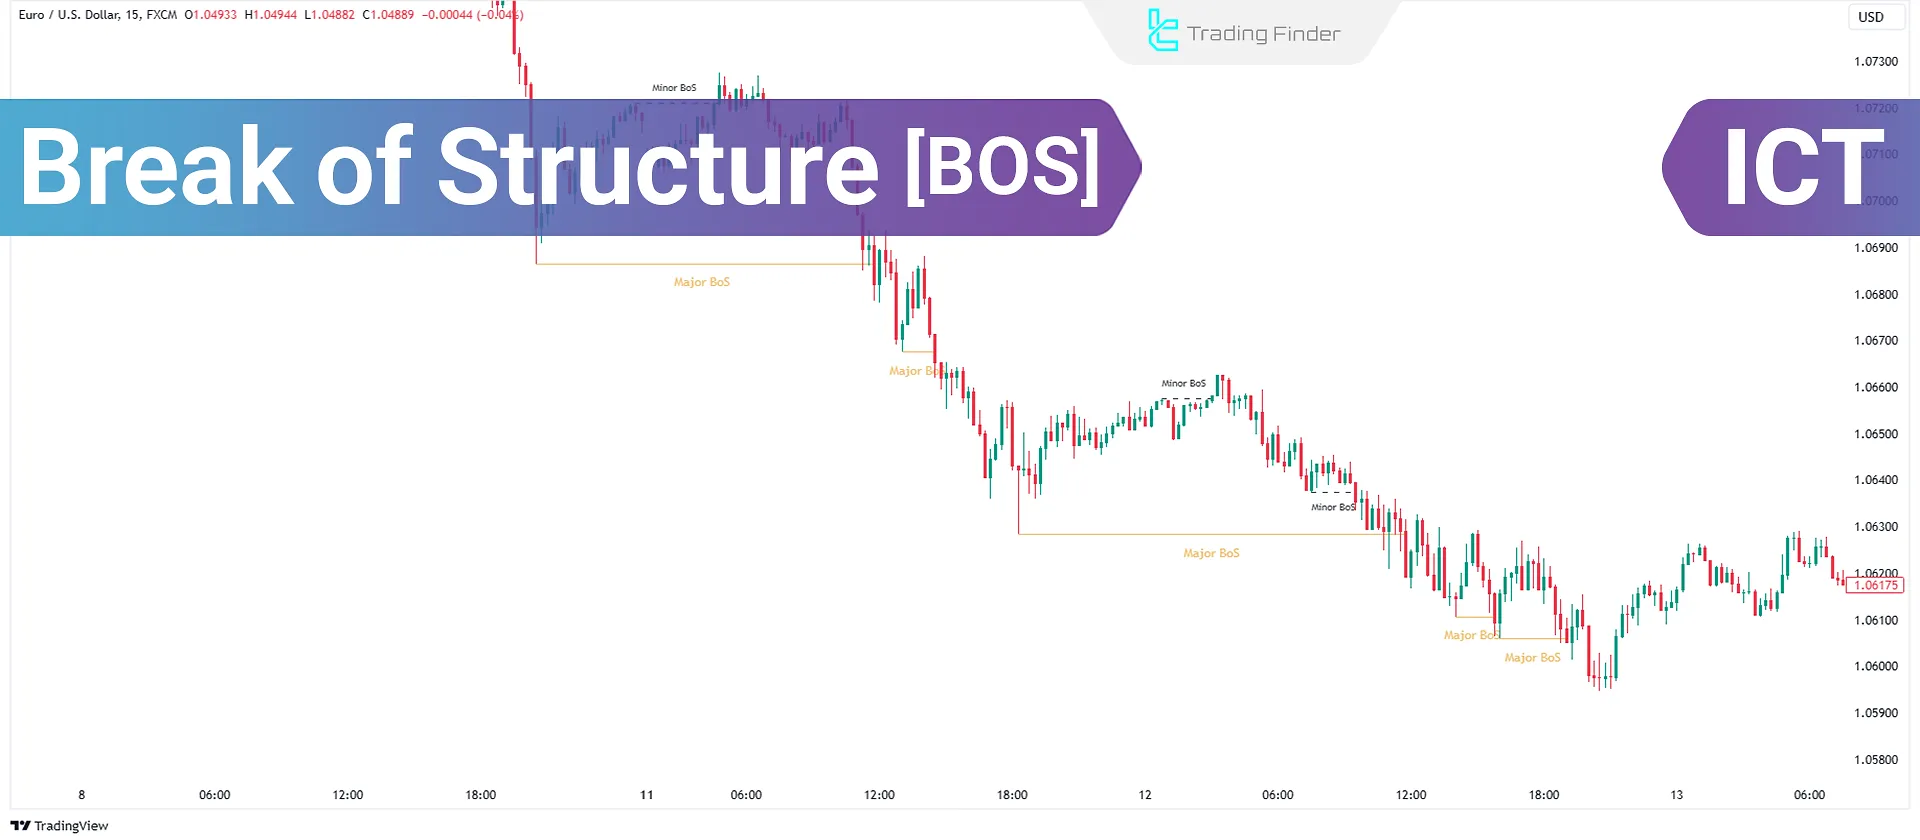
What Is Break of Market Structure or BOS?
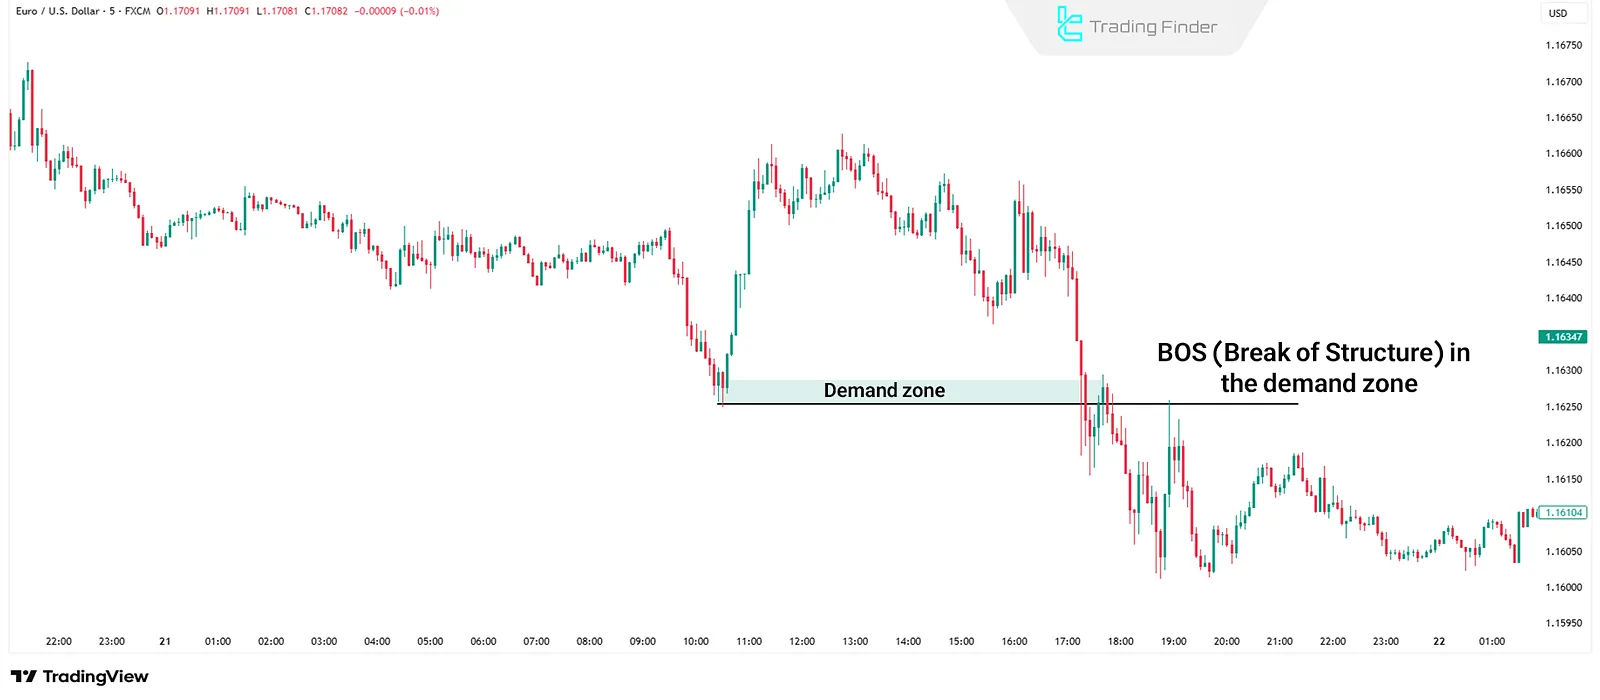
Break of Structure (BOS) is a concept in technical analysis that refers to the breaking of market support and resistance levels.
This change indicates the inflow of new liquidity into the market and can signal the beginning of a new trend or the continuation of an existing one.
In an uptrend, when the price surpasses a key resistance level, it is recognized as a bullish BOS, while in a downtrend, the break of a support level indicates a bearish BOS.
The break of market structure essentially serves as a framework for identifying significant changes in the market’s formation. It enables traders to determine precise entry and exit points and predict the probable direction of price movement.
For a visual explanation of the Break of Market Structure, you can also refer to the instructional video on the TJRTrades channel:
How do you identify a break in structure in trading?
Before delving deeper into the concept of Break of Structure, it is essential to understand Inducement, since a structure break that occurs after liquidity inducement is considered a valid BOS.
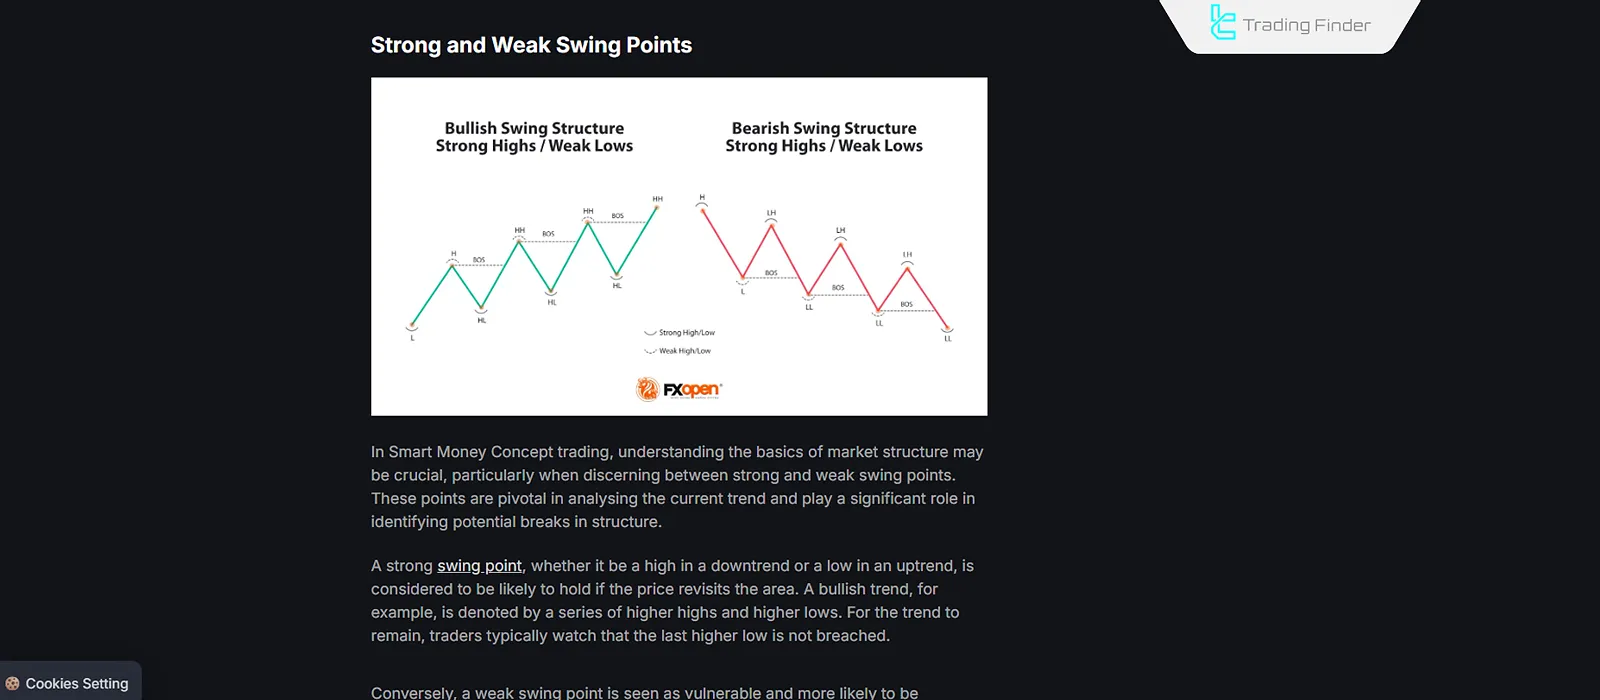
Based on the market trend and the Smart Money concept, Break of Structure is divided into two types, which can be observed in the educational bullish and bearish schematics of BOS presented by the FXopen website:
#1 Bullish Break of Structure
New highs are formed when the market is in an uptrend, breaking the previous highs. This is referred to as a Bullish Break of Structure (BOS.)
For a BOS to be valid, Inducement must first be absorbed. In simpler terms, the price must first absorb the Inducement before breaking the previous high.
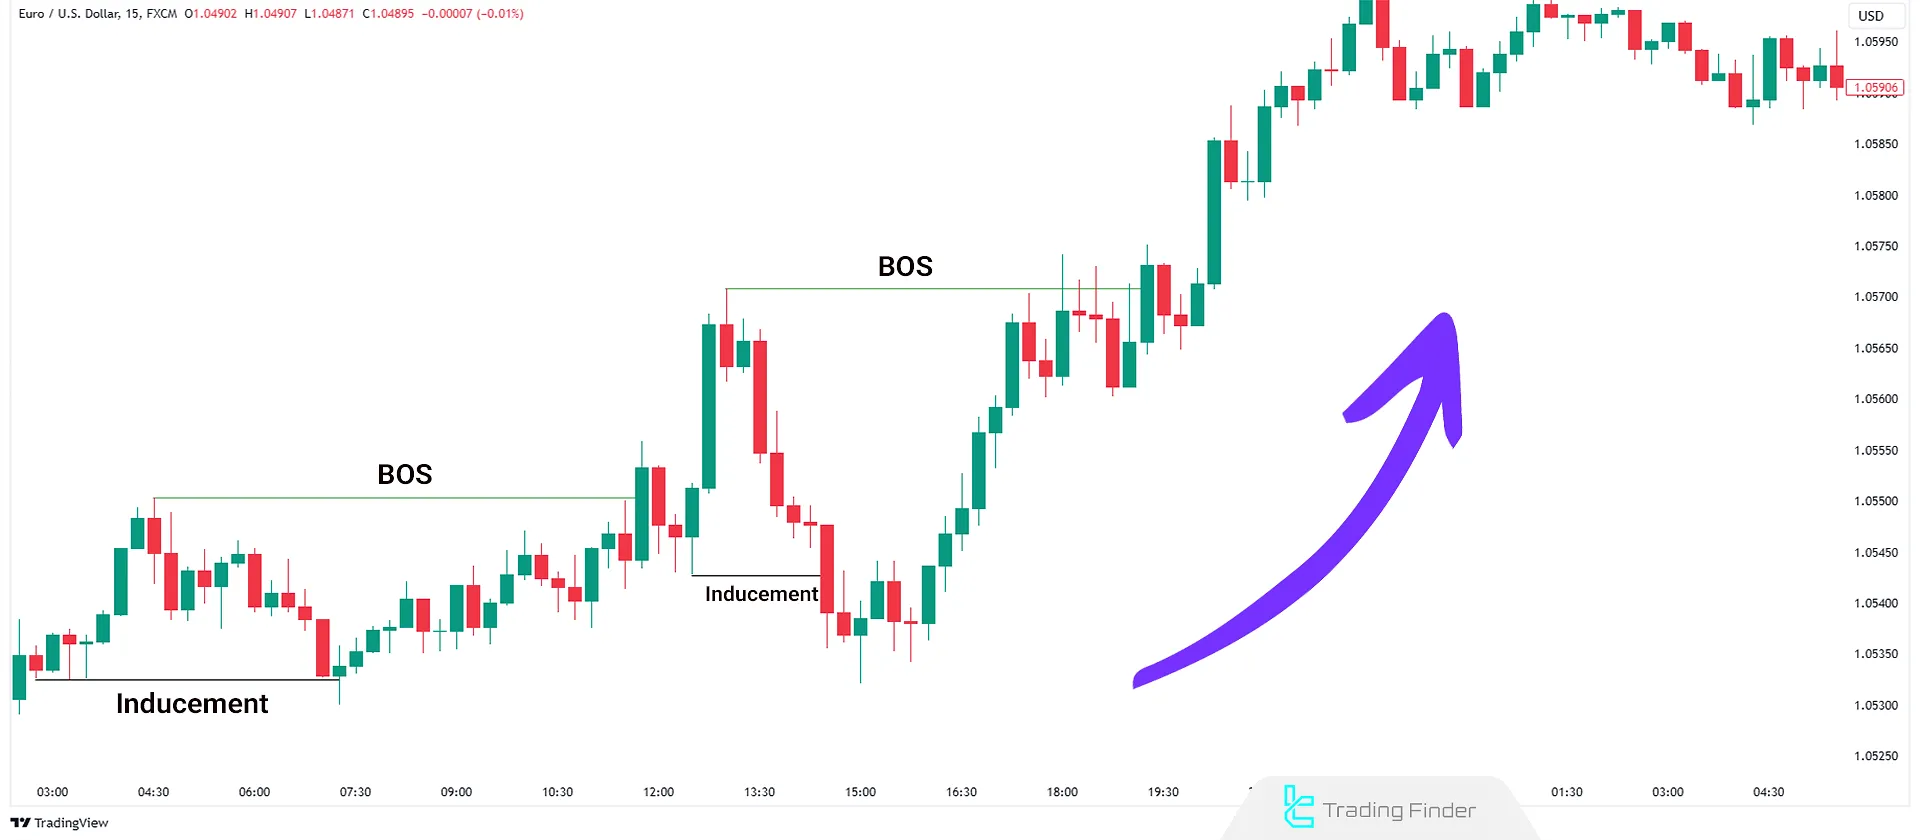
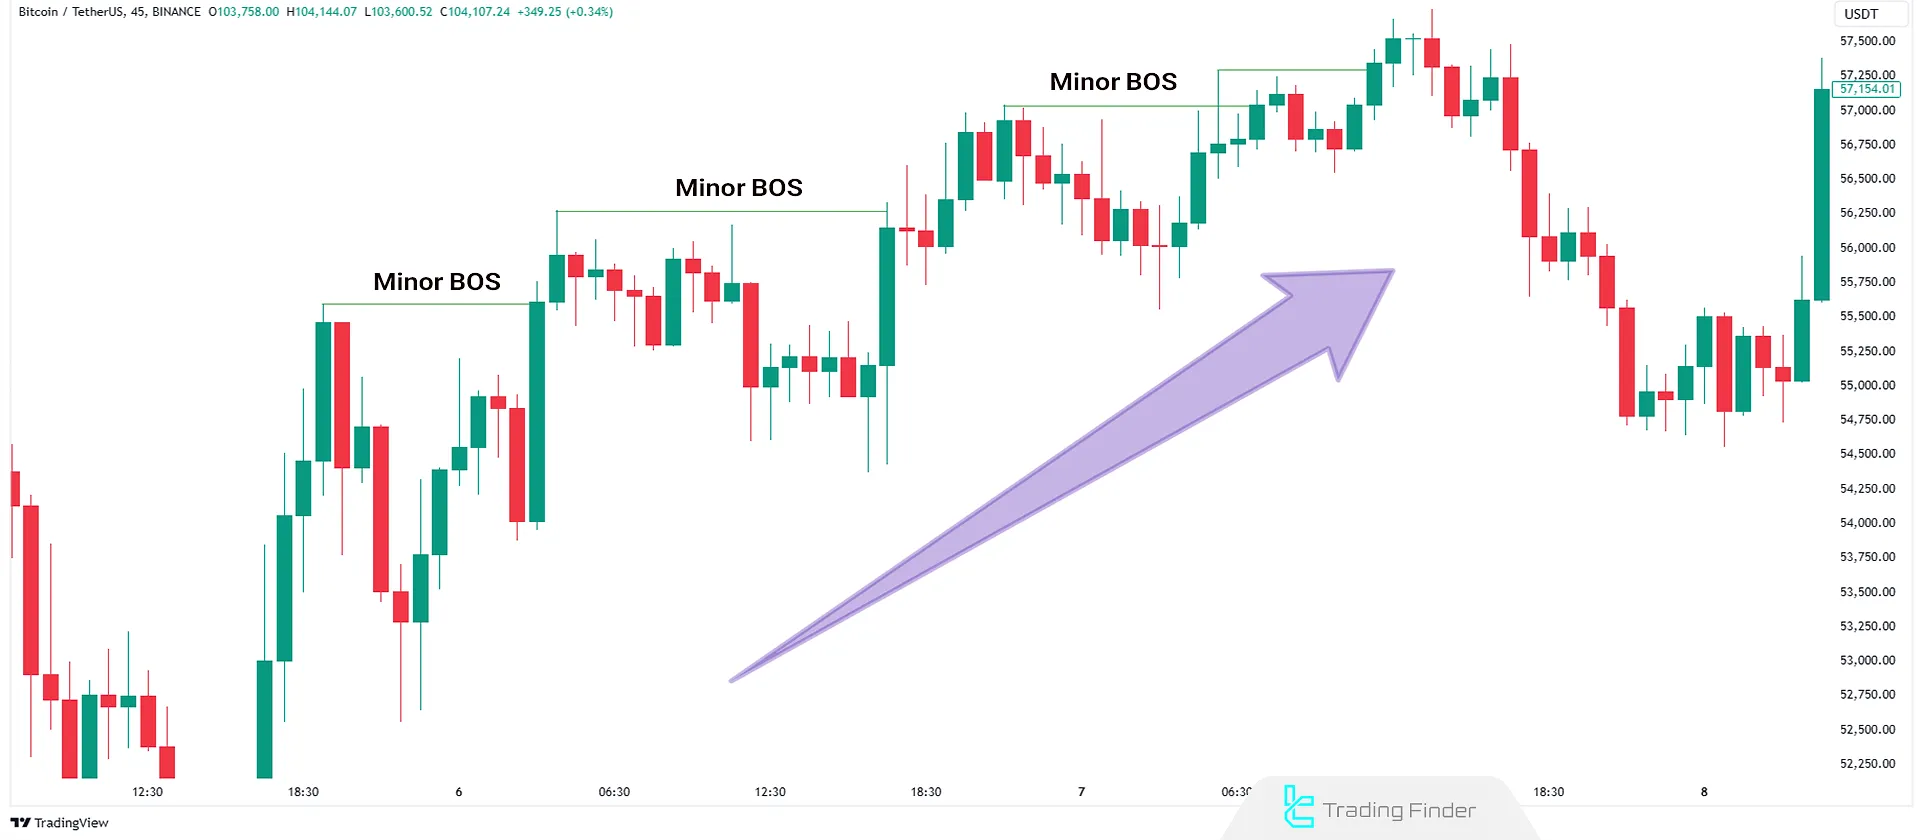
If the price breaks the previous high without absorbing the Inducement, it is considered a Minor Bullish BOS. In this case, a new high is created, but the previous low remains unchanged.
#2 Bearish Break of Structure
In a downtrend, new lows are formed, breaking the previous lows. This is referred to as Bearish Break of Structure (BOS).
For a valid BOS, Inducement must be absorbed first. In other words, the price must absorb the Inducement and break the previous low.
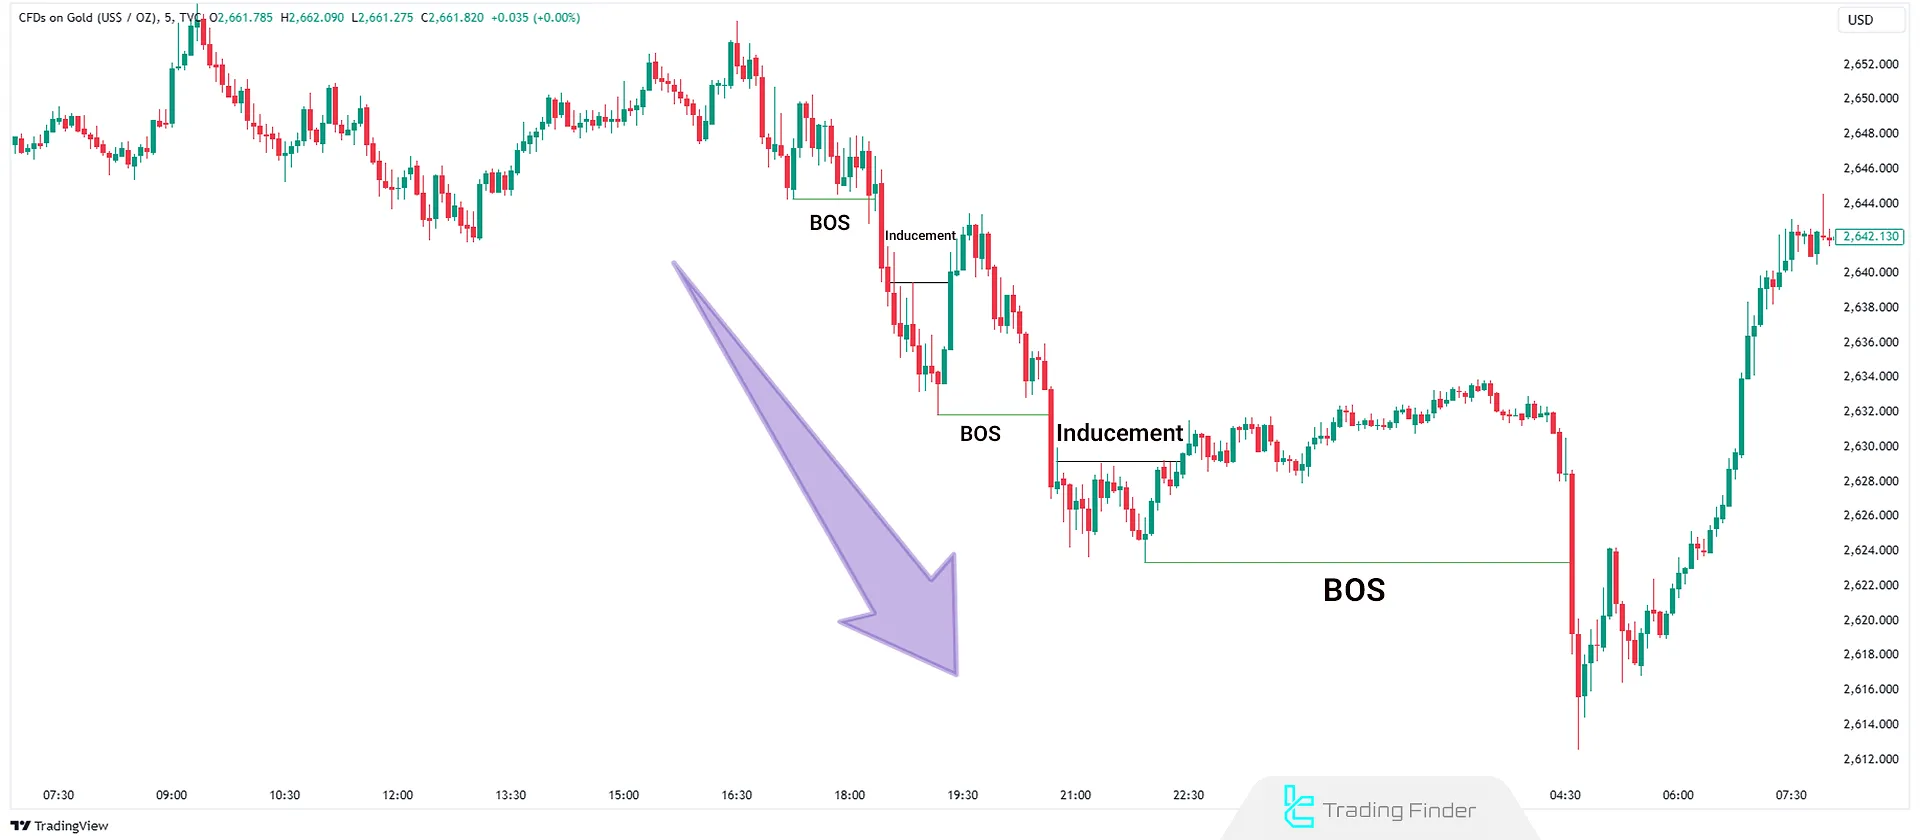
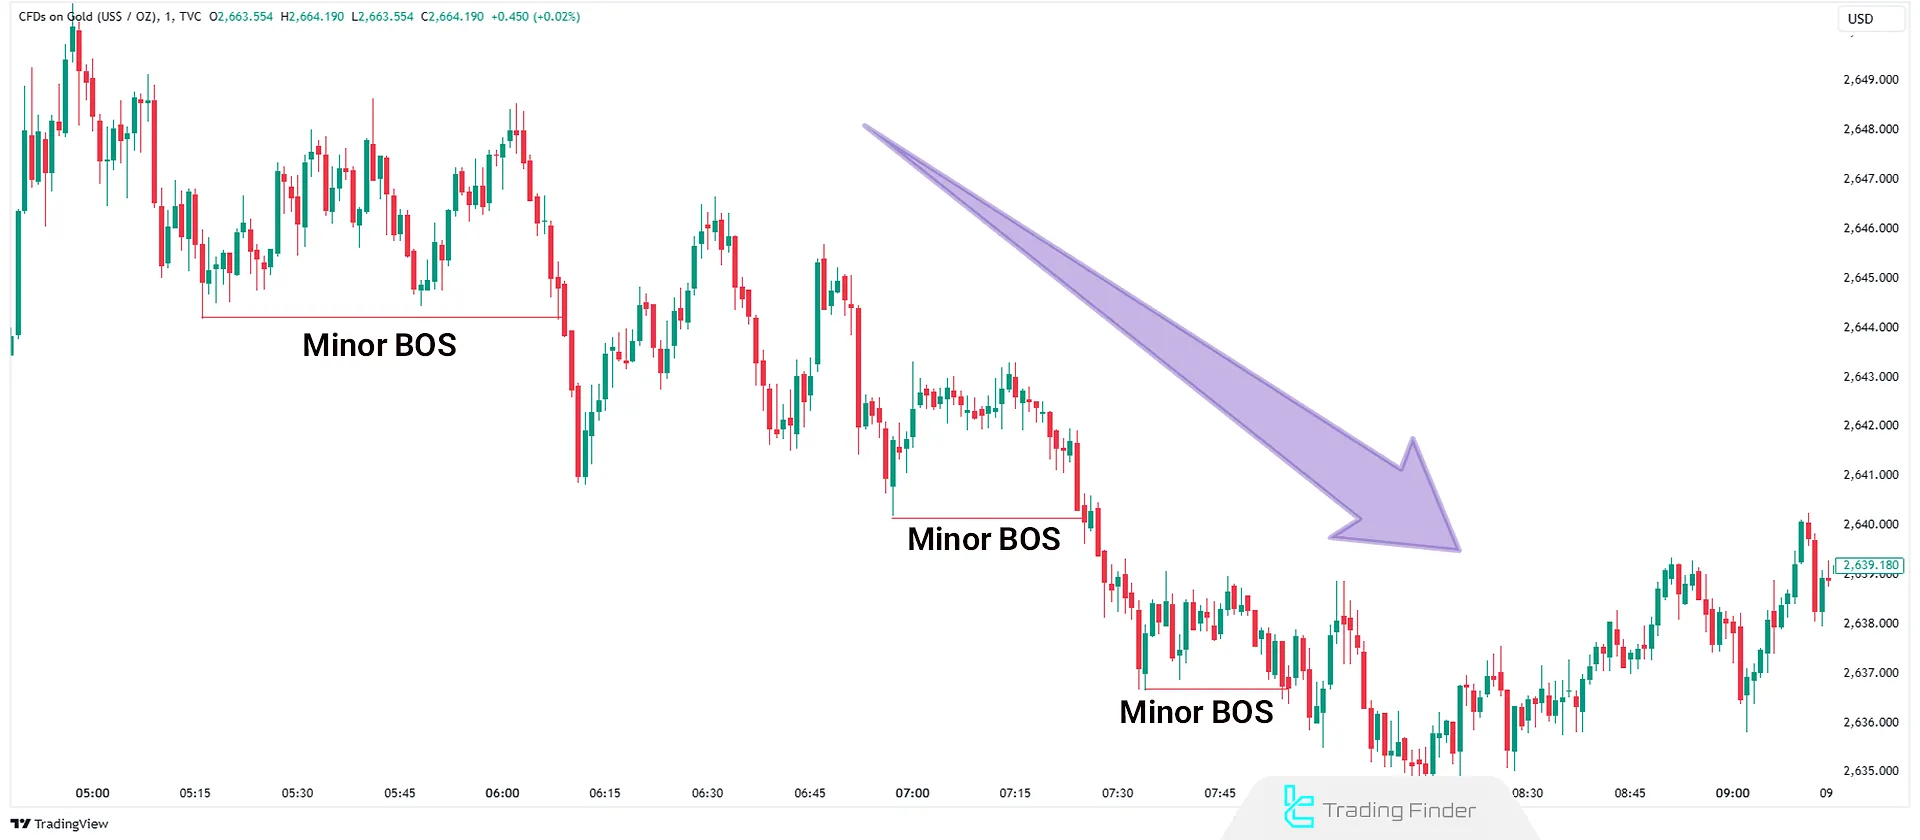
If the price breaks the previous low without absorbing the Inducement, it is considered a Minor Bearish BOS. A new low is created here, but the previous high remains intact.
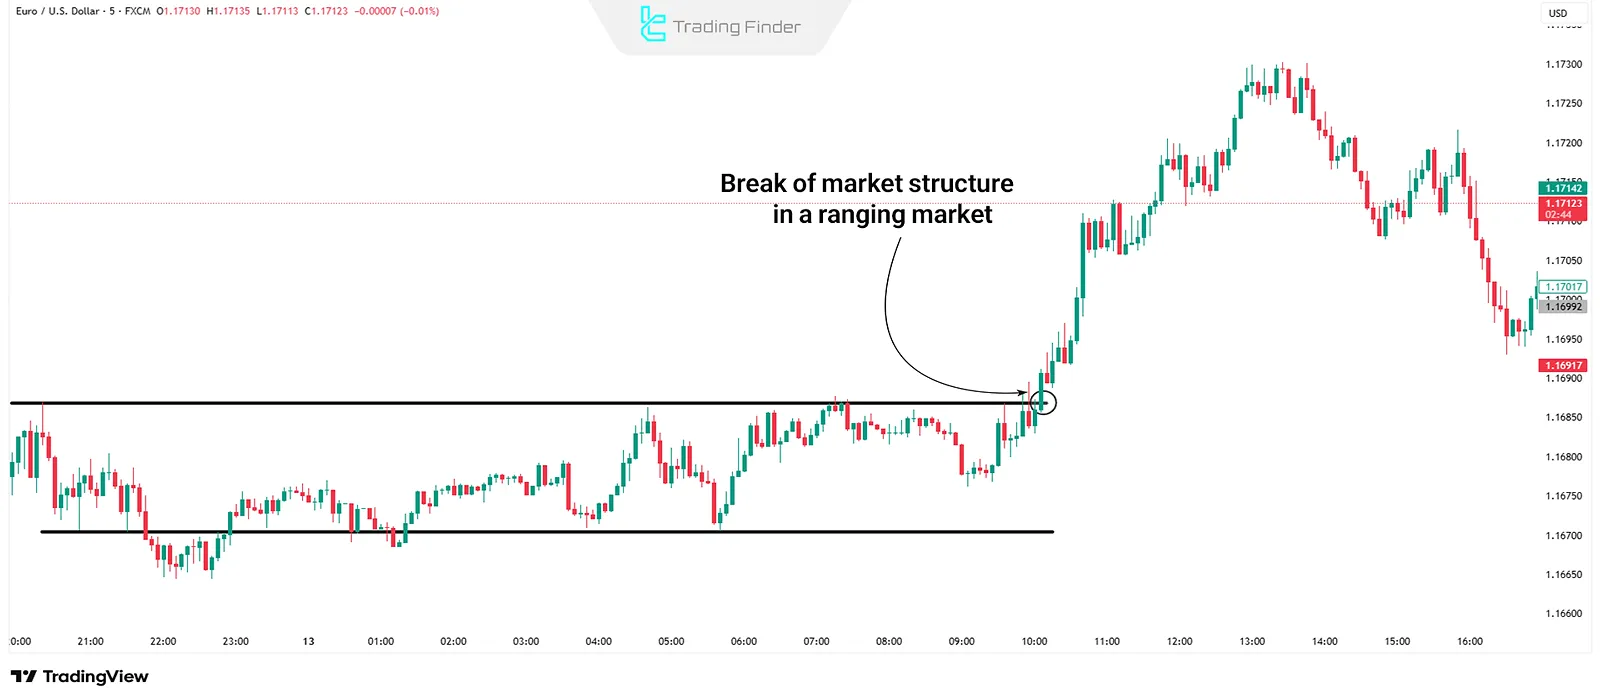
BOS in Ranging vs Trending Markets
In ranging or sideways markets, the price fluctuates within a defined zone, making the BOS strategy in Forex difficult to identify. In such situations, traders should wait for a breakout from the support and resistance zones (Support/Resistance Zone).
Most traders manage risk during this phase by placing trailing stop losses along the boundaries of the range and only entering a trade when a strong breakout occurs.
The standard R:R ratio in BOS setups is at least 2, and trailing can also be applied after structure confirmation for better trade management.
Advantages and Disadvantages of BOS in the Forex Market
BOS confirms the trend continuation and helps reduce trading risk by improving entry confidence.
On the other hand, this same feature can sometimes delay the recognition of a trend reversal or cause false signals in ranging markets. Table of Advantages and Disadvantages of BOS:
Advantages | Disadvantages |
Confirms trend continuation and increases entry confidence | Does not show potential trend reversal |
Reduces risk by trading in the direction of the main trend | Possible late entries and missing part of the move |
Applicable in multiple timeframes | May generate false signals in ranging markets |
Defines entry and exit points | Requires combination with other tools for improved accuracy |
Which Timeframe is Best for Identifying a Break of Structure?
Market structure exists in all timeframes, and you might observe different structures in each timeframe.
To identify BOS in any timeframe, simply mark the previous structure; The best practice is to have a comprehensive market view by analyzing structures across multiple timeframes.
This approach, called Top-Down Analysis, involves connecting market structures across timeframes to gain accurate insights.
How do you trade a break of structure in Forex?
BOS can be applied in both bullish and bearish markets:
#1 Bullish Market
When the price breaks a structure, mark the inducement level and wait for the price to return to it. Once the price absorbs the Inducement, enter buy positions.
For better entries, use confirmations like Interaction with Higher Timeframe PD Array, market structure shifts or trend reversals in lower timeframes.
#2 Bearish Market
When the price breaks a structure, mark the inducement level and wait for the price to return to it. Once the price absorbs the Inducement, enter sell positions.
Confirmations like Interaction with Higher Timeframe Order Block, market structure shifts or trend reversals in lower timeframes can be used to refine entries.
Break of Market Structure (BOS) Indicator
For further study and more information about the BOS indicator, traders can refer to the Trading Funder Indicator.
The BOS indicator is a specialized analytical tool that automatically detects Breaks of Structure (BOS) on the chart and marks them with labels.
This feature is particularly valuable for traders using ICT and Smart Money Concepts (SMC), as it enables quick identification of both major and minor market trends.
Using its proprietary algorithm, the indicator records all price breaks at highs and lows and accurately displays shifts in market behavior.
This allows traders to clearly see key points of trend reversals or market continuation. Educational video BOS Indicator Tutorial:
One of the key features of this indicator is the use of color-coding to distinguish between different types of structural changes and shifts.
Major market structure changes are shown in red, minor changes in pink, primary structure breaks in turquoise, and secondary structure breaks in blue.
This color-coded system makes market analysis simpler and more transparent. The indicator is designed for multi-timeframe use, making it suitable for everything from day trading to scalping.
It belongs to several indicator categories, including ICT Trading Style, Smart Money, Market Cycle, and Breakout indicators in MetaTrader 4.
Additionally, it can be applied across various markets such as Forex, Cryptocurrency, and Indices.
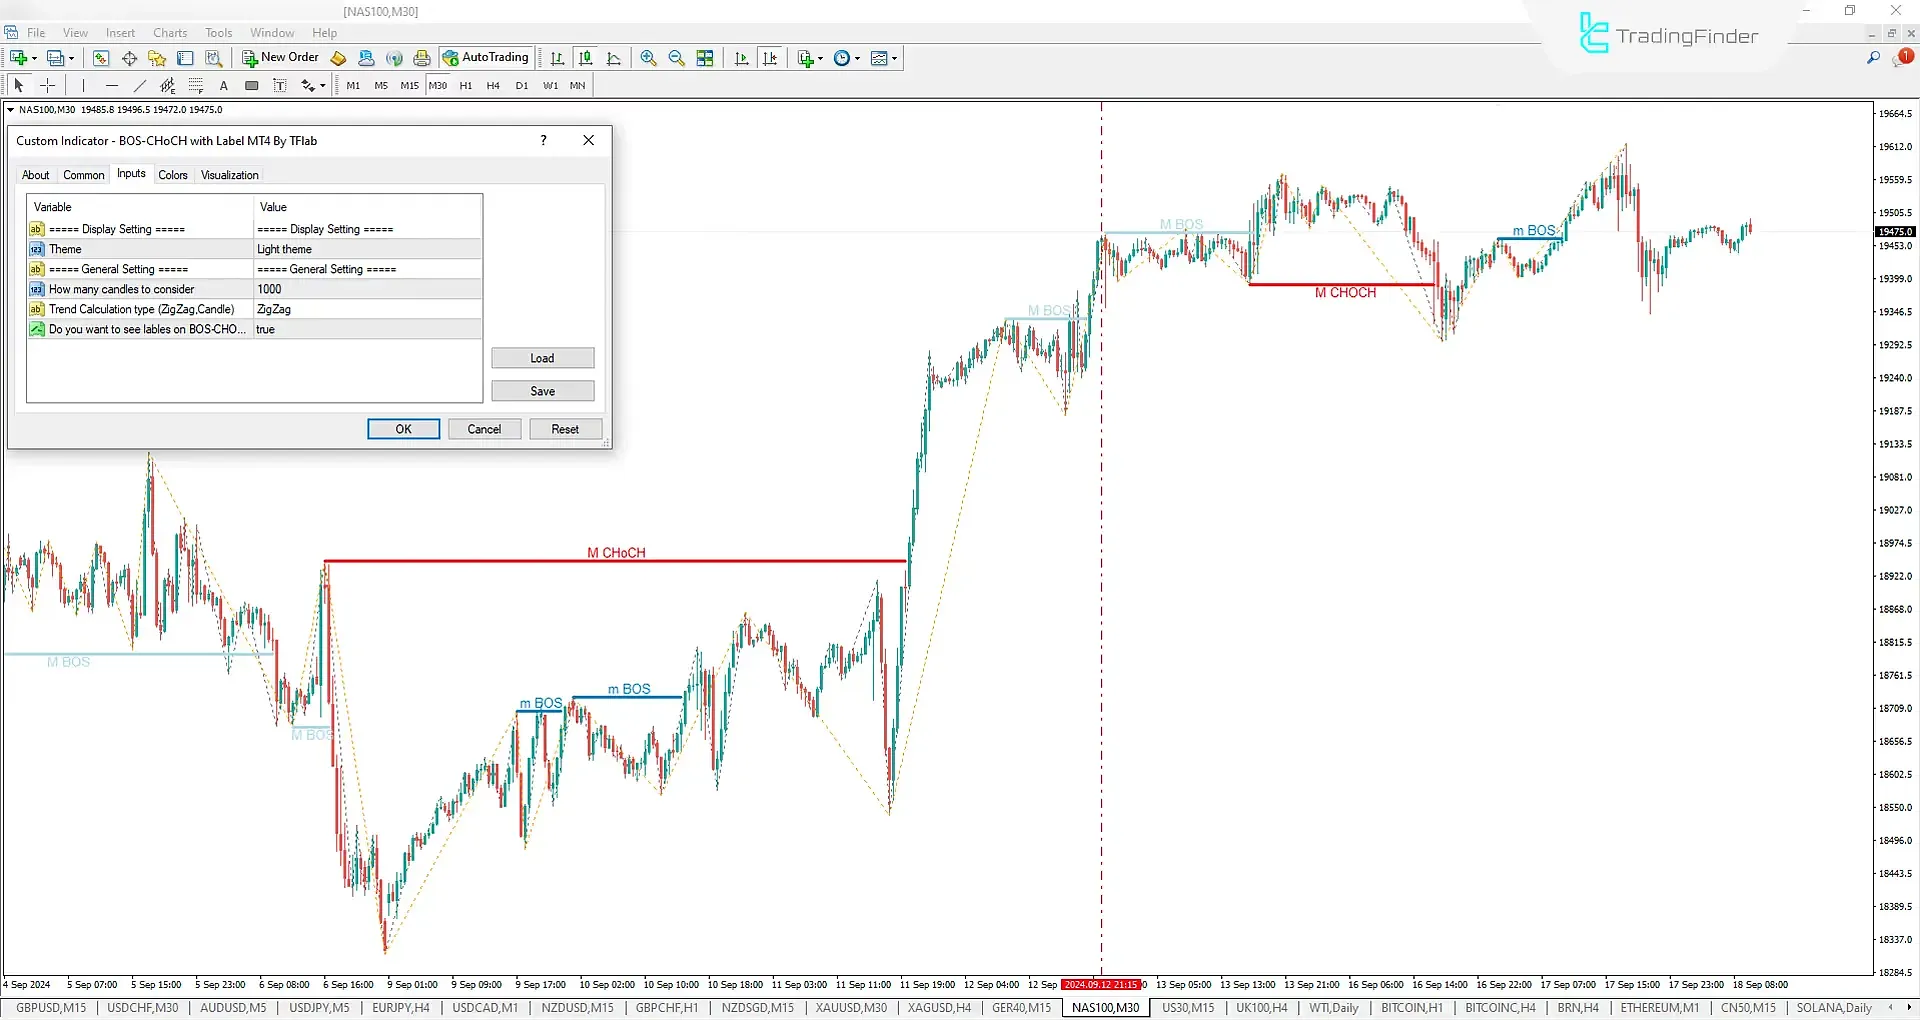
The indicator’s flexible settings panel is one of its key strengths. Users can select the theme (light, dark, or auto mode) and also set the number of candles used in calculations.
The trend calculation method can be adjusted based on the ZigZag Candle model. In addition, users can enable or disable the display of structure labels as needed. BOS Indicator Links Across Platforms:
The Relationship Between Market Structure Break (BOS) and Smart Money
Break of Structure is not merely a technical signal; it represents the entry of smart liquidity into the market.
For this reason, many traders interpret BOS as an indication of market maker activity.
When a trader is able to combine supply and demand zones with BOS, the accuracy of entry and exit points increases significantly.
Difference Between CHoCH and BOS in ICT Price Action Confirmation
In Forex market analysis, Break of Structure (BOS) and Change of Character (CHoCH) are two essential concepts for understanding market behavior.
BOS mainly indicates the continuation of the existing trend, while CHoCH serves as the first signal of a potential trend reversal .
Recognizing the difference between these two concepts is crucial for determining accurate entry and exit points. Table of Key Differences Between BOS and CHoCH:
Feature | BOS (Break of Structure) | CHoCH (Change of Character) |
Definition | Break of a previous high or low in continuation of the current trend | The first sign of trend reversal after a previous structure break |
Nature | Confirms trend continuation | Early warning for the beginning of a reversal trend |
Main Application | Identifying continuation of movement in the direction of the current trend | Identifying possible trend reversal and start of a new structure |
Time of Occurrence | After price breaks key levels in the direction of the trend | After a structure break occurs against the dominant trend |
Trading Signal | Entry in the direction of the trend for continued movement | Preparation for reversal entry or exit from previous positions |
Risk Level | Lower, as it aligns with the dominant trend | Higher, due to the unconfirmed nature of the reversal |
Best Candle Triggers After BOS
Candle patterns that appear after a Break of Structure (BOS) play an important role in confirming the validity of the structure break.
These patterns reflect sufficient price strength and participation from either buyers or sellers.
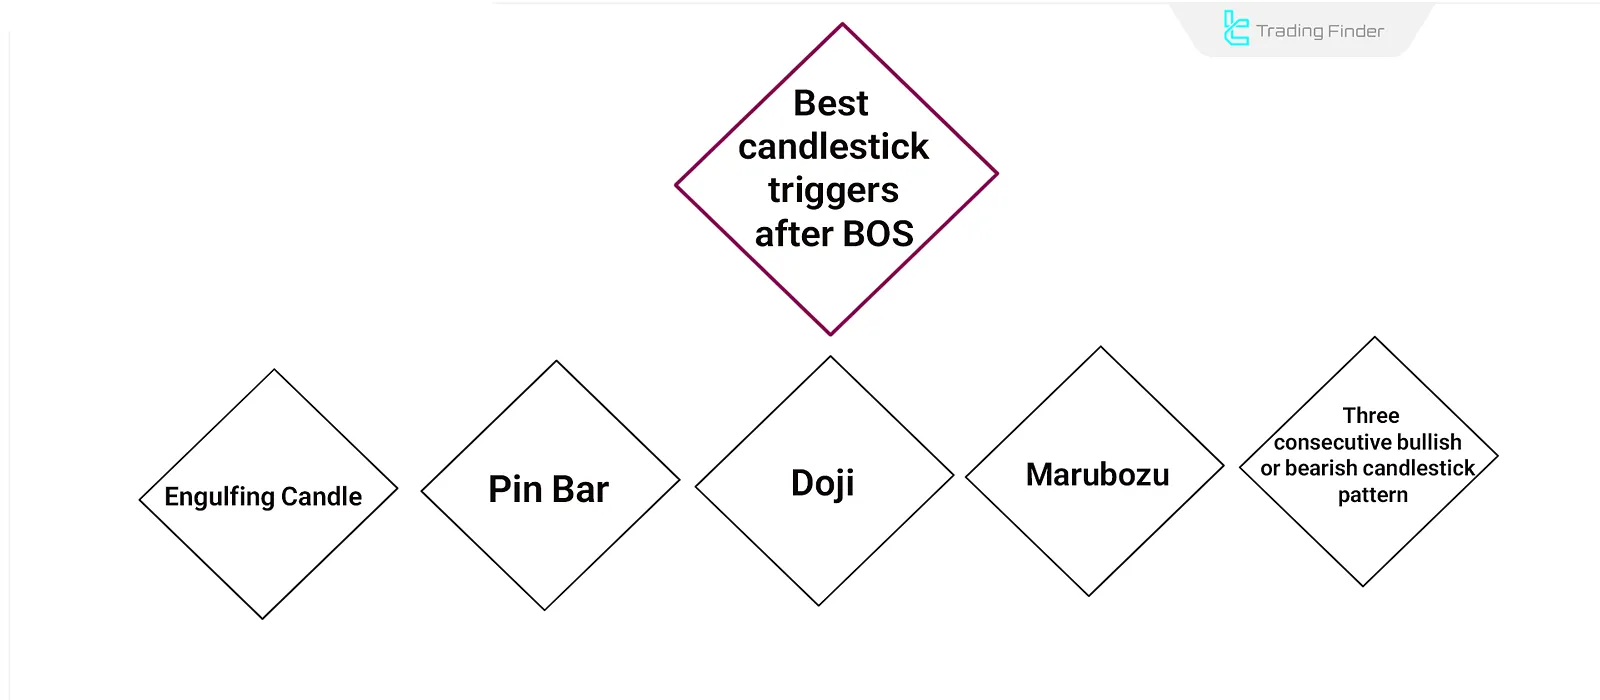
Recognizing candle formations following BOS helps traders evaluate the breakout signal more precisely and avoid premature entries. Types of Candle Patterns Confirming BOS:
- Engulfing Candle: When a new candle completely engulfs the previous one, it indicates strong buying or selling pressure following the structure break;
- Pin Bar: The presence of a long wick and price rejection at the breakout level shows liquidity entry and confirms BOS;
- Doji: Indicates market indecision after the breakout; if confirmed in the direction of the break, it strengthens the validity of BOS;
- Marubozu Candle: A candle that closes without or with a very short wick demonstrates strong momentum in the direction of the breakout;
- Three Consecutive Bullish or Bearish Candles: Confirms the continuation of the trend after BOS and signals strong liquidity flow into the market.
Difference Between BOS and MSS
Break of Structure (BOS) refers to the breaking of a previous high or low after the absorption of inducement .
Market Structure Shift (MSS), on the other hand, refers to the break of a Swing Low or Swing High within the market.
The main difference between BOS and MSS lies in inducement absorption. BOS represents a larger shift in the price trend, whereas MSS indicates an initial change in the market structure.
Conclusion
Break of Structure (BOS) occurs when the price breaks the previous high or low after absorbing Inducement.
This signals a significant change in market trend and is commonly used as a confirmation for trend continuation. BOS can happen in both bullish and bearish trends, to start the new market movements.


