


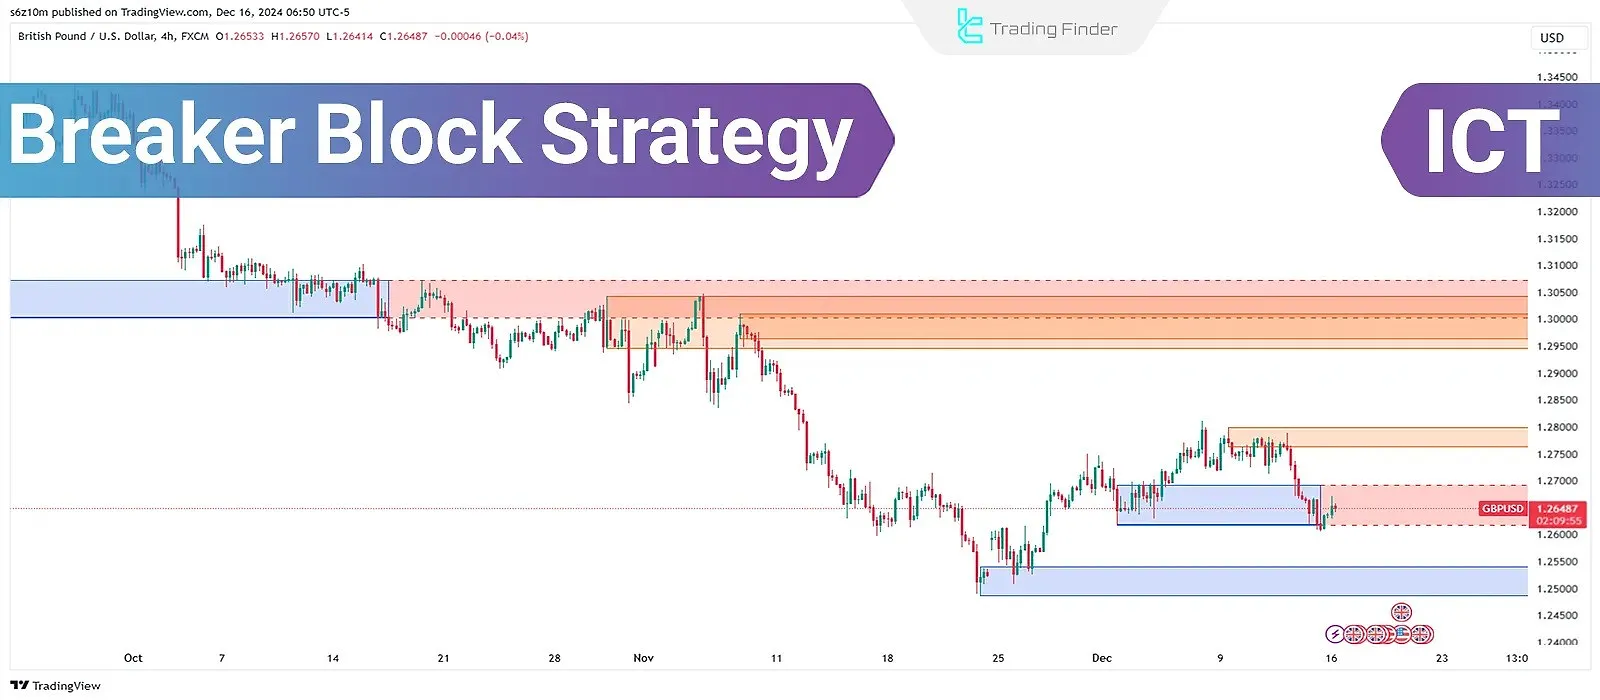
The Breaker Block is one of the concepts in the ICT trading style. This method focuses on the break of Order Blocks(OB) and their transformation into new zones for price retracement, creating an entry area for trading based on the Breaker Block (BB) strategy.
This concept indicates that after absorbing liquidity and breaking the previous structure, the market tends to return to the breaker block area to confirm its new direction.
Therefore, correctly identifying these zones can provide high-probability trading opportunities and serve as a basis for precise entries in the direction of the prevailing trend.
What is a Breaker Block?
A Breaker Block is an Order Block (OB) that, once broken by price, transforms into a new support or resistance zone for price retracements.
This shift usually occurs due to a Liquidity Sweep and a Market Structure Shift (MSS). Video tutorial on how to use Breaker Block from the TTrades YouTube channel:
Why Does the Breaker Block Strategy Work?
The Breaker Block strategy works because of the underlying market psychology and liquidity behavior. When the price breaks through an order block, it essentially absorbs the liquidity behind that area and confirms the new market direction.
After the breakout, many retail traders enter positions against the main trend, while large institutions use the price’s return to that same zone to re-enter in the direction of the prevailing trend.
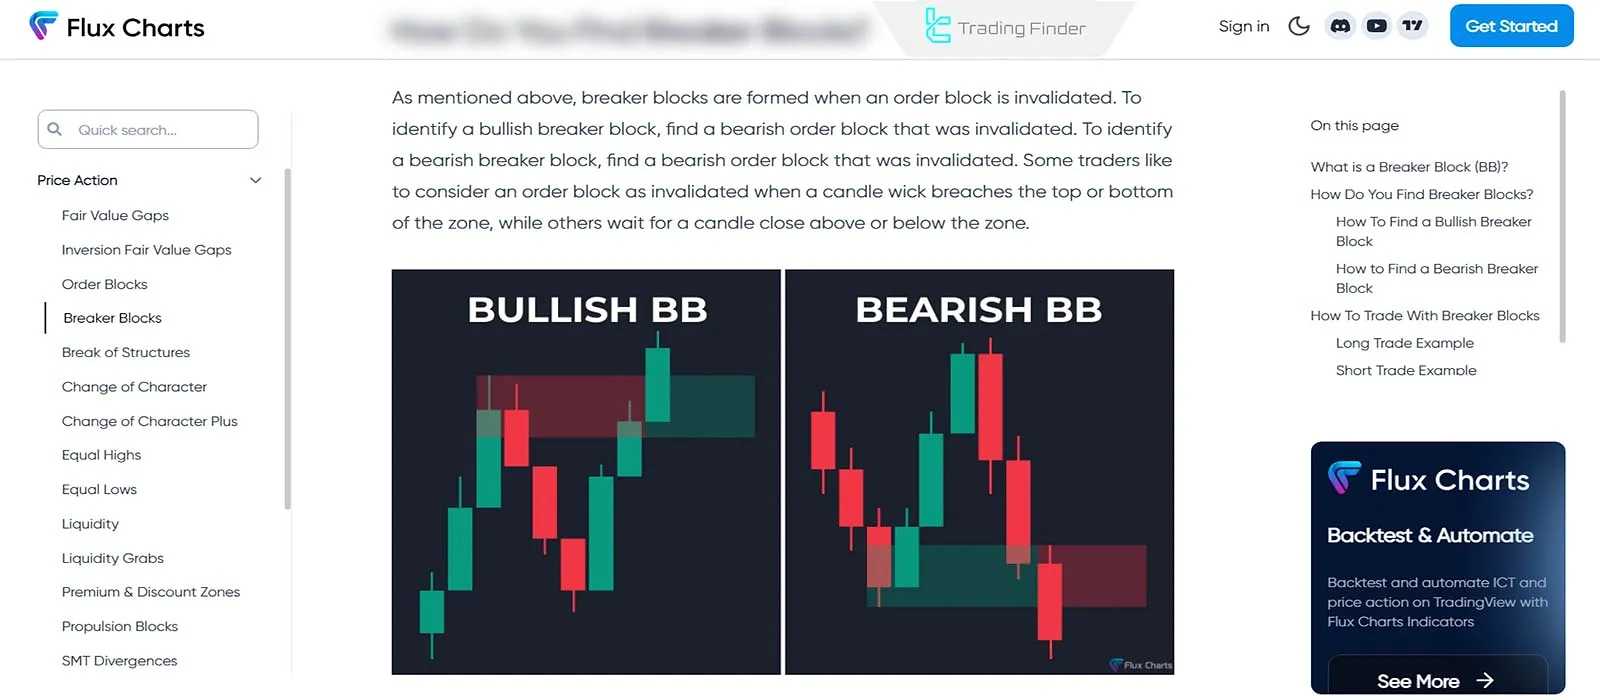
This repetitive reaction causes breaker blocks to become key support or resistance levels. Tutorial on how to find Breaker Blocks from the Flux Charts website:
Types of Breaker Blocks
Breaker Blocks are divided into two types bullish and bearish depending on the direction of the market structure break.
In the bullish type, the market enters a growth phase after absorbing liquidity from the lows and breaking resistances, while in the bearish type, the price decline begins following liquidity absorption from the highs and the breaking of support levels.
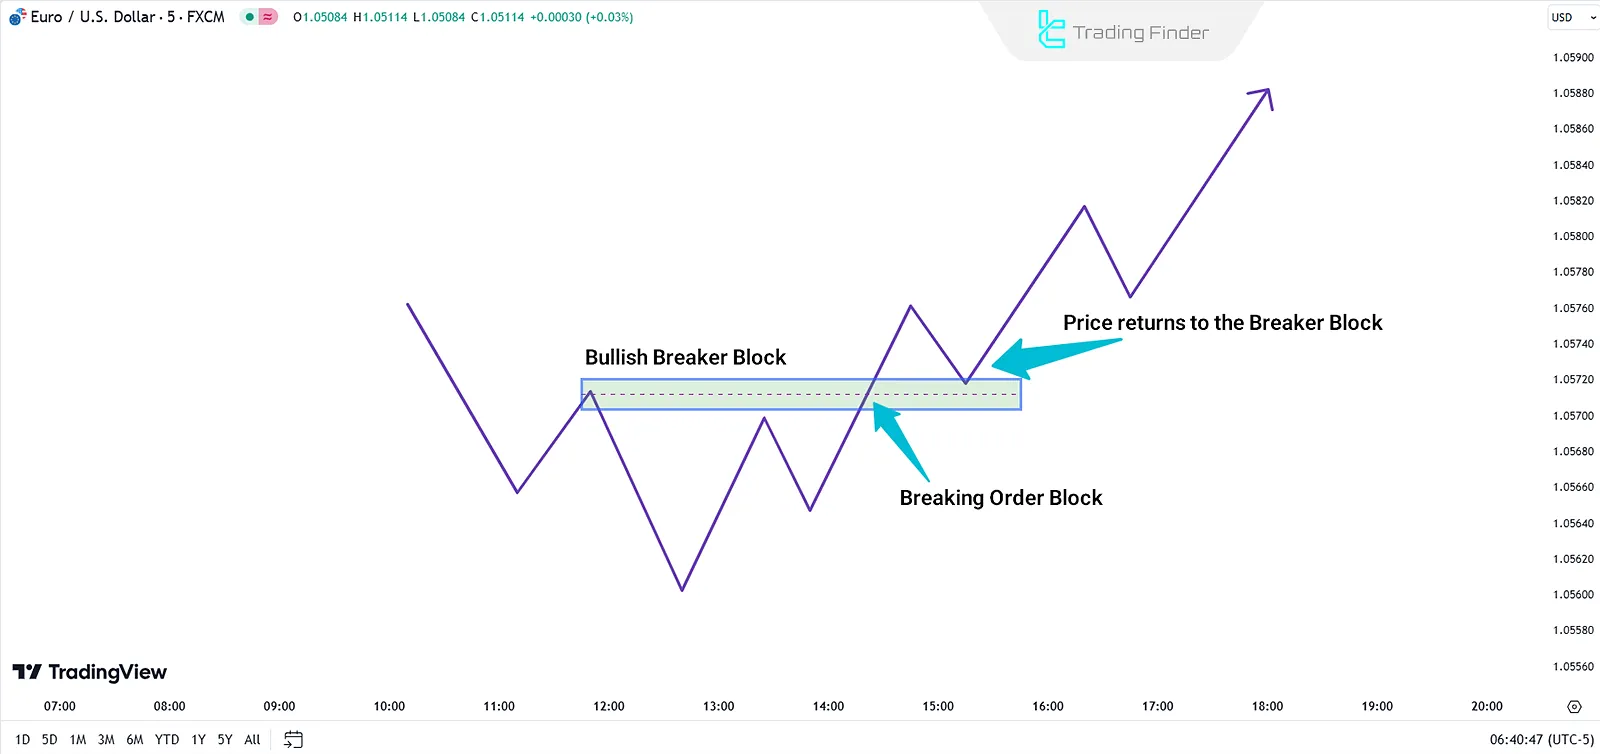
Bullish Breaker Block
A bearish Order Block (OB−) is broken by an upward price movement. After the break, it shifts to act as a support zone, aiding further price increases.
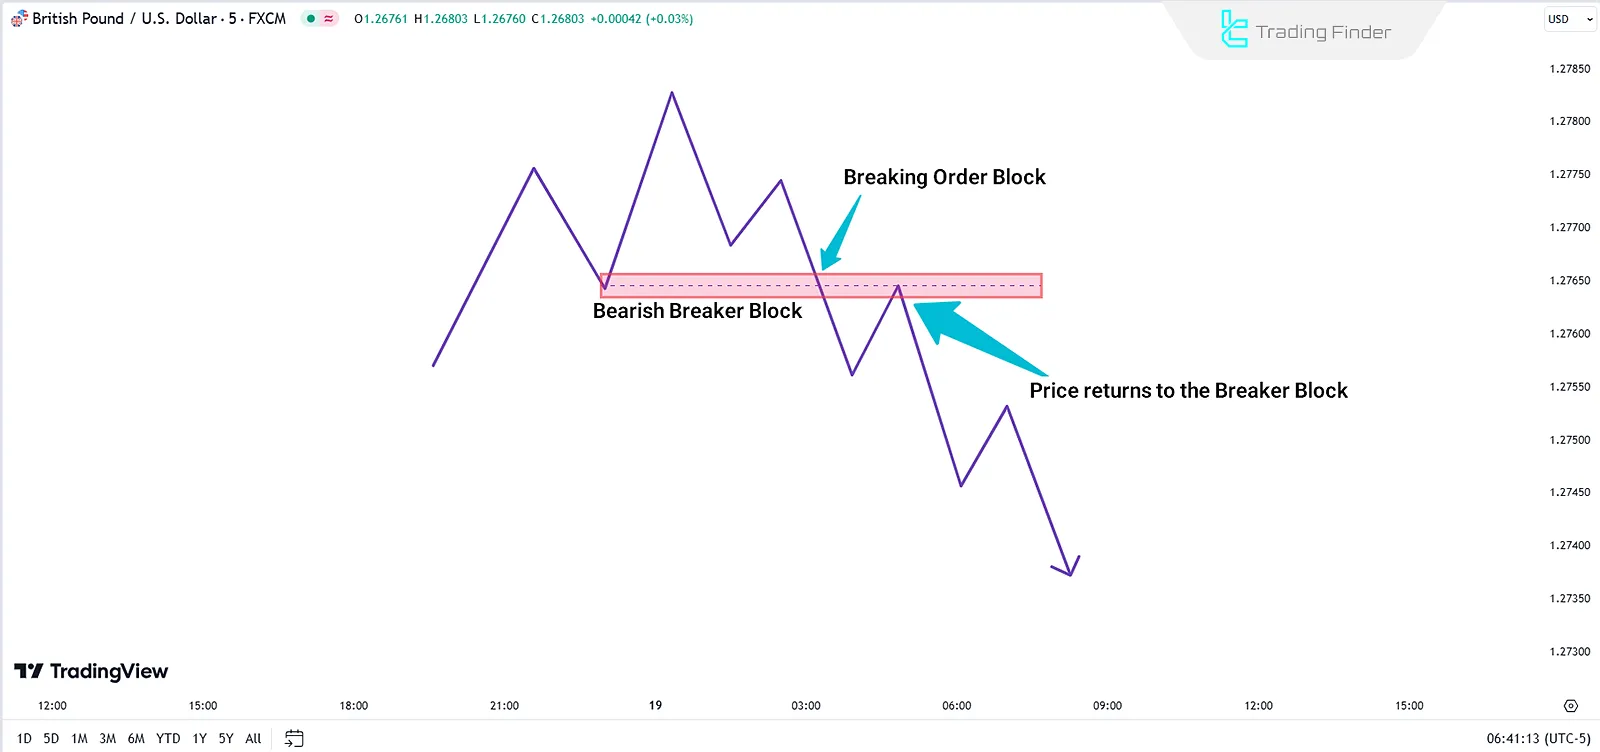
Bearish Breaker Block
A bullish Order Block (OB+) is broken by a downward price movement. After the break, it shifts to act as a resistance zone, aiding further price decreases.
Principles for Identifying a Breaker Block (BB)
To validate a Breaker Block, the following points should be assessed:
- Liquidity Sweep: At first, price will capture liquidity located behind a specific zone;
- Order Block Break: Price breaches the upper limit (in bearish OB) or lower limit (in bullish OB), invalidating it;
- Market Structure Shift (MSS): A confirmed trend reversal (from bullish to bearish or vice versa) must occur.
The Role of Liquidity in the Formation of Breaker Blocks
Liquidity plays a crucial role in the formation of Breaker Blocks, as these zones are directly created by the price’s movement toward areas where liquidity is concentrated.
In fact, before a Breaker Block forms, the market typically collects liquidity by absorbing buy or sell orders around structural highs and lows.
After this phase, the price breaks through the order block and, following the full absorption of opposing orders, begins its main movement in the new direction.
Step-by-Step Guide for Trading with Breaker Blocks
To execute the Break Block trading strategy, follow the steps below to identify market structure shift zones, align your entries with the flow of smart money liquidity, and achieve an optimal risk-to-reward ratio.
#1 Identify the Market’s Overall Trend
To determine the overall market direction, use the price structure and liquidity zones on higher timeframes to identify the dominant trend (bullish or bearish); then, align with that direction by locating the Breaker Block that confirms the trend, and avoid taking entries against the primary market flow.
#2 Wait for a Liquidity Sweep
Wait for the price to move toward liquidity pools and absorb the pending orders resting above or below them; after this liquidity grab, a market structure shift typically occurs, and the price often reverses direction toward an optimal entry point (OEP) for a high-probability setup.
#3 Identify the Order Block Break (OB)
When the price breaks an Order Block, it will turn into a Breaker Block (BB):
- If the price closes above a bearish Order Block, a Bullish Breaker Block forms;
- If the price closes below a bullish Order Block, a Bearish Breaker Block forms.
#4 Enter the Trade
Once the Breaker Block area forms, wait for the price to retrace to this zone and enter the trade with MSS or CHoCH confirmation signals.
In the image below, a short trade entry using this strategy can be seen:
Now, let's define trade parameters for both bullish and bearish setups:
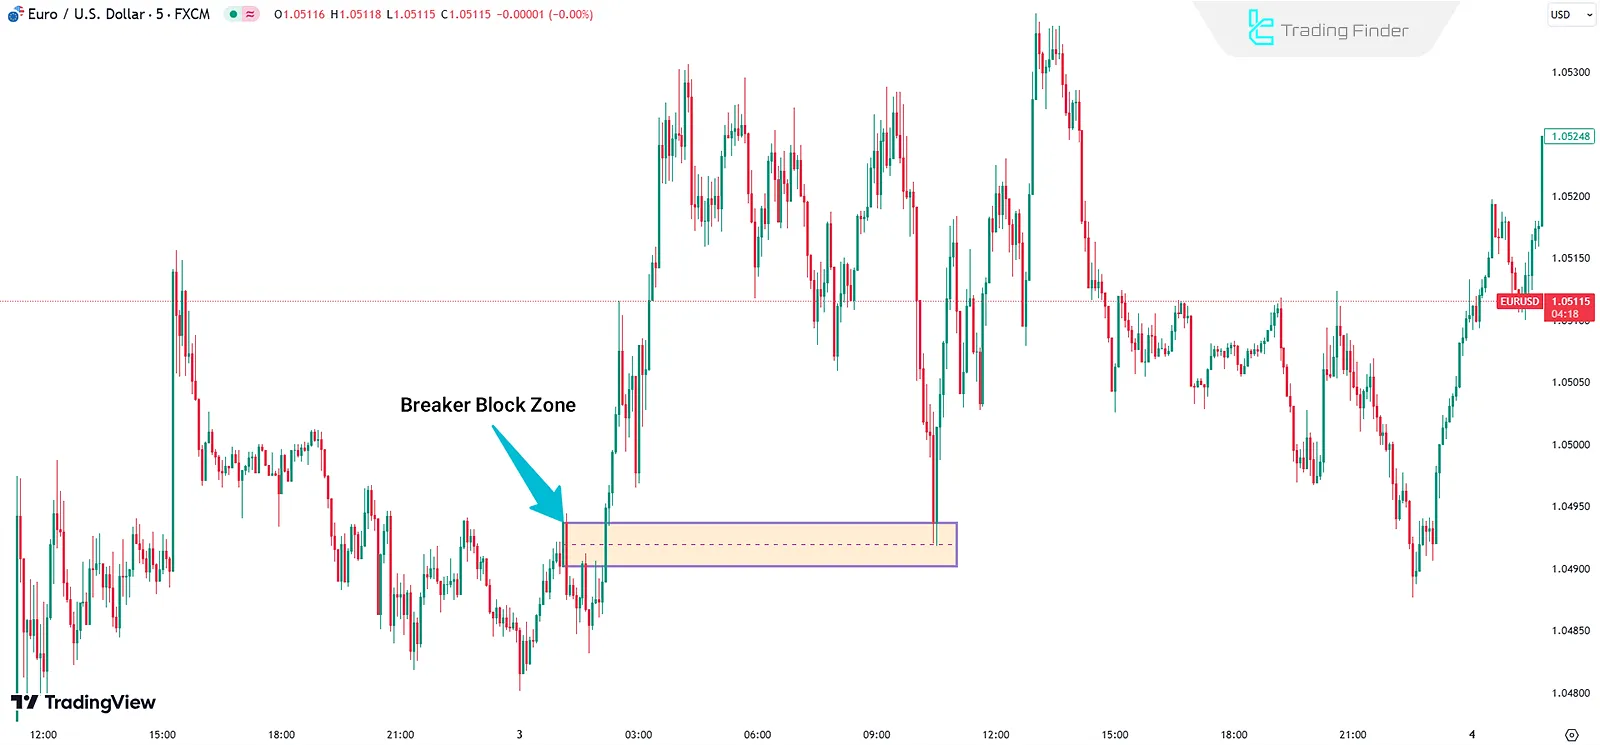
Example of a Bullish Breaker Block
In the Breaker Block strategy, accurately determining entry points, stop loss, and take profit levels plays a vital role in controlling risk and improving trading precision.
By applying market structure logic and identifying liquidity zones, traders can purposefully define three main trade setups.
In the Breaker Block strategy, accurately determining entry points, stop loss, and take profit levels plays a vital role in controlling risk and improving trading precision.
By applying market structure logic and identifying liquidity zones, traders can purposefully define three main trade setups.
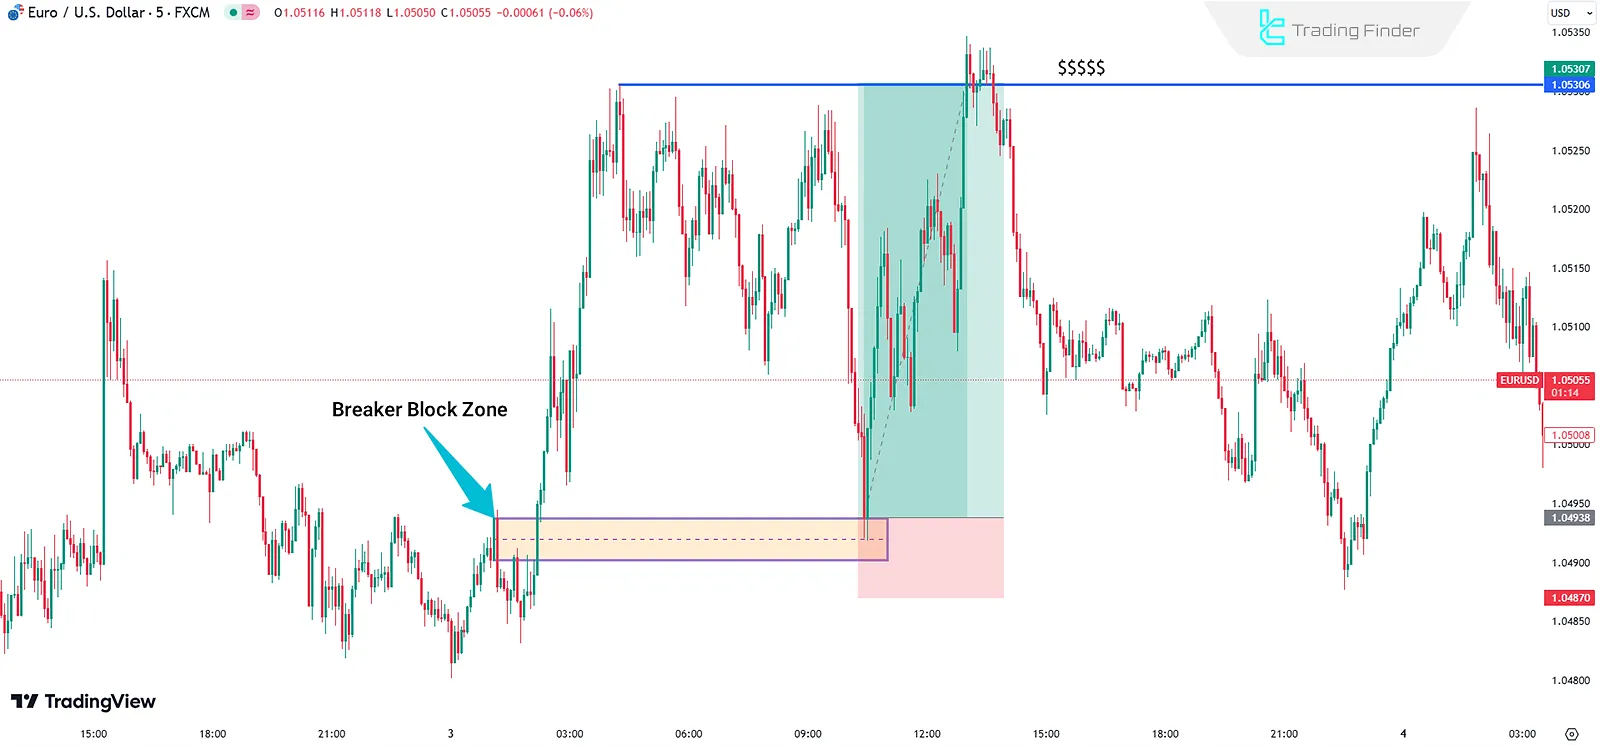
- Entry Point: When the price retraces to the BB zone
- Stop Loss (SL): Slightly below the BB area
- Take Profit (TP): Liquidity levels on the opposite side
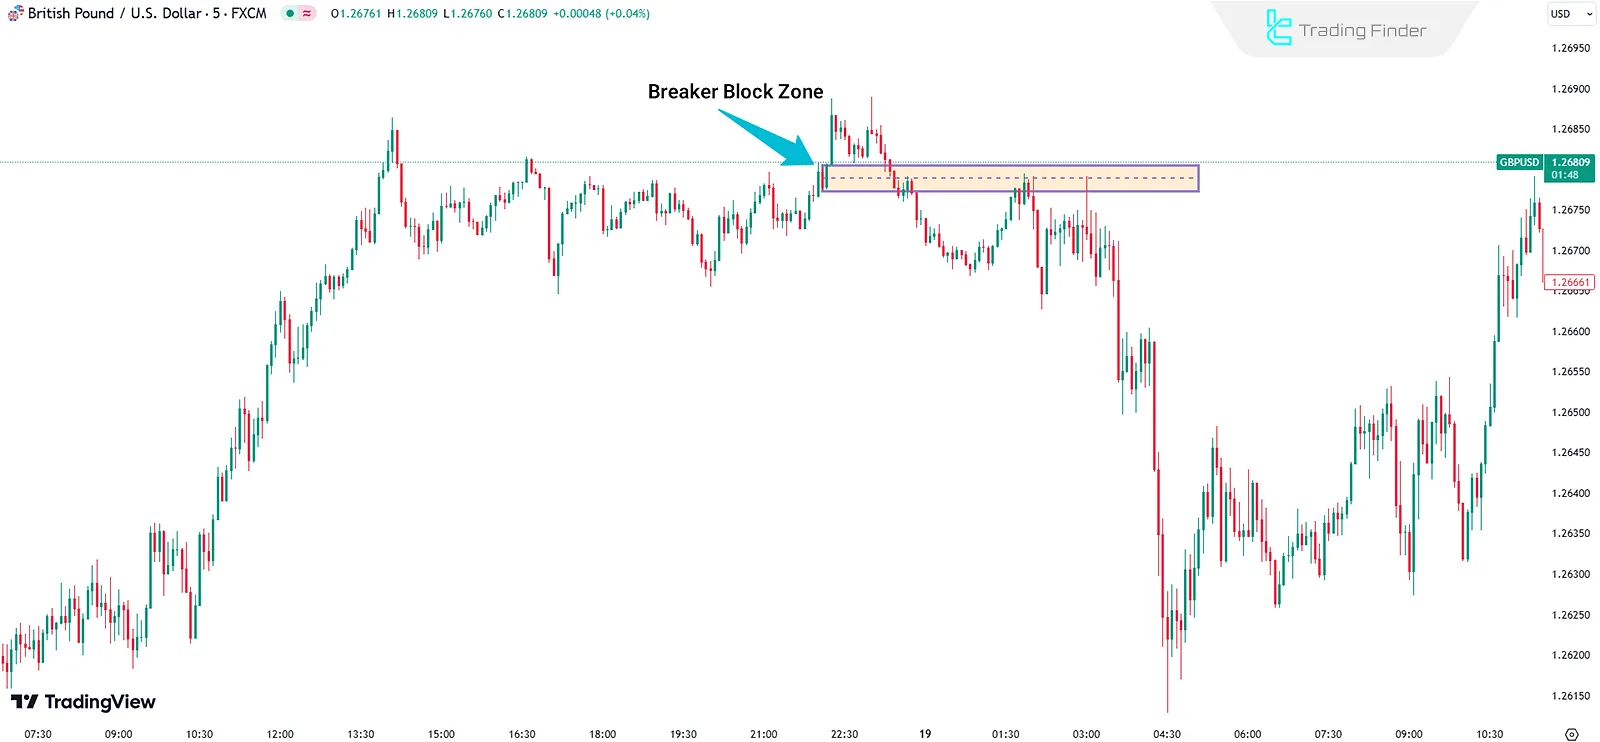
Example of a Bearish Breaker Block
In bearish trades based on the Breaker Block strategy, the main focus is on entering at the reversal zone after the bullish structure has been broken and upper liquidity has been absorbed.
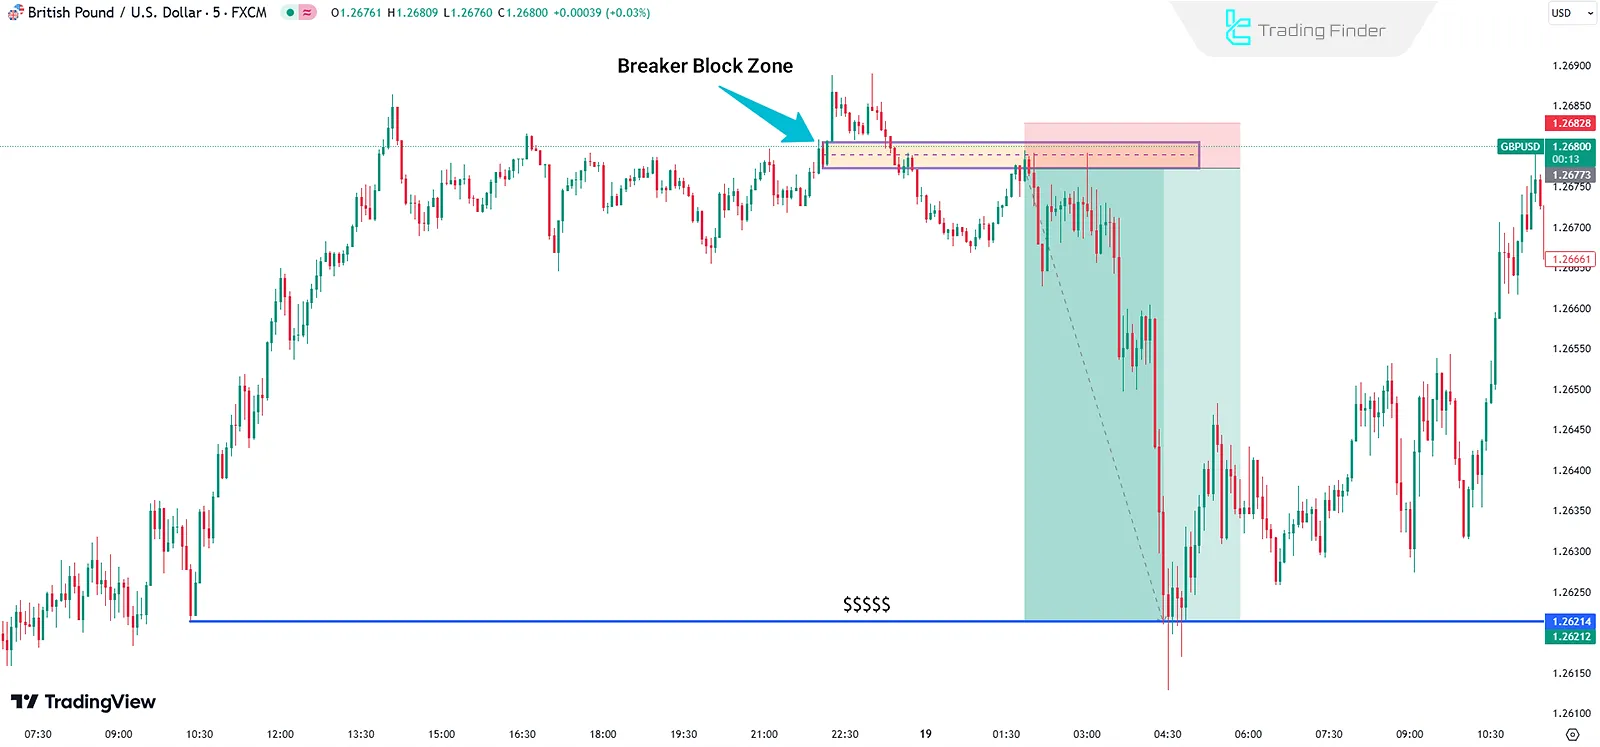
In this case, the entry points, stop loss, and take profit levels are determined based on the bearish Breaker Block zone.
- Entry Point: When the price retraces to the BB zone
- Stop Loss (SL): Slightly above the BB area
- Take Profit (TP): At liquidity levels on the opposite side
Best Timeframes and Markets for Breaker Blocks
The Breaker Block strategy, like other ICT-based structures, adheres to specific timeframes for effective use; it is typically most effective on 15-minute to 1-hour charts for precise entries, and on 4-hour to daily timeframes for identifying the broader market structure and directional bias.
Timeframes:
- Use daily timeframes to analyze overall trends
- Lower timeframes (5 or 15 minutes) are suitable for precise entries
Markets: Forex, futures, and cryptocurrency markets
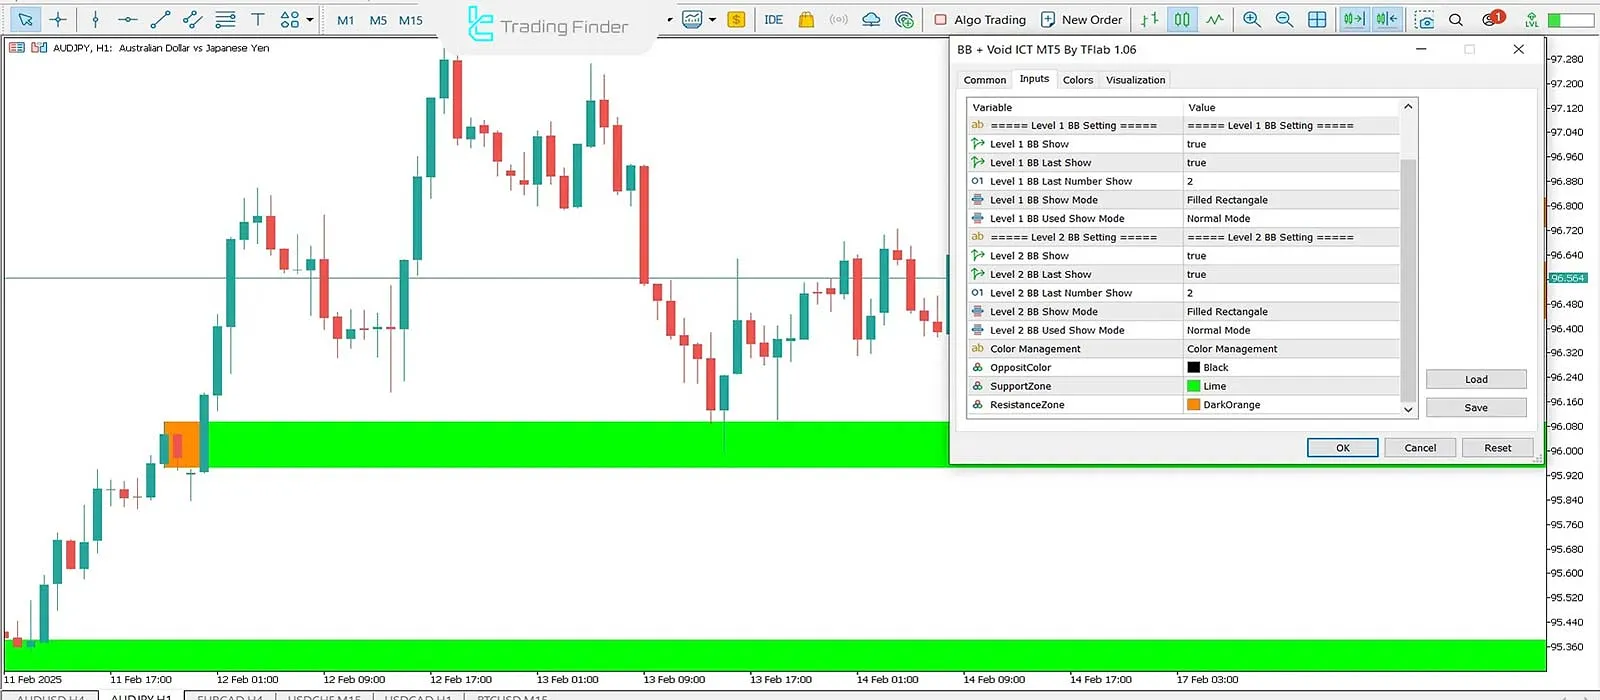
Breaker Block Indicator
The Breaker Block Indicator, designed based on ICT and Smart Money concepts (Smart Money), identifies broken Order Blocks and marks the Pullback Zones, allowing traders to find more precise entry and exit points in various markets, including Forex, crypto, indices, and stocks.
Educational video on how to use the Breaker Block Indicator:
In its functional structure, bullish Breaker Blocks are displayed in green, bearish Breaker Blocks in red, and consumed areas in gray.
This color display helps users quickly identify the market condition.
The concept of the “Void” in this indicator refers to parts of the chart where a price gap has formed between candles, which often has a high probability of being filled in the future.
The Breaker Block Indicator becomes active when the price breaks an Order Block and then, on the retracement, tests the same level as new support or resistance.
In bullish trends, after the break and retest, the price movement usually continues upward, and in bearish trends, the opposite happens.
This repetitive behavior indicates liquidity absorption and confirms a change in market structure.
In the settings section, the user can control parameters such as the display level of Breaker Blocks (Level 1 and Level 2), the color of support and resistance zones, the number of candles (Bar Count), and the display mode of consumed areas.
Due to its high flexibility, this indicator can be used for multiple timeframes and various trading styles, from scalping to day trading.
In the end, the Breaker Block Indicator is an analytical tool for identifying key trend reversal zones, which, by combining liquidity concepts, Order Blocks, and structure breaks, provides traders with trading opportunities featuring controlled risk and high precision. Links for using the Breaker Block Indicator:
Common Mistakes When Using the Breaker Block
Identifying and properly using Breaker Blocks requires understanding market structure and liquidity behavior.
However, many traders make repetitive analytical mistakes, leading to misinterpretation of breaks, premature entries, and ultimately reduced trading accuracy.
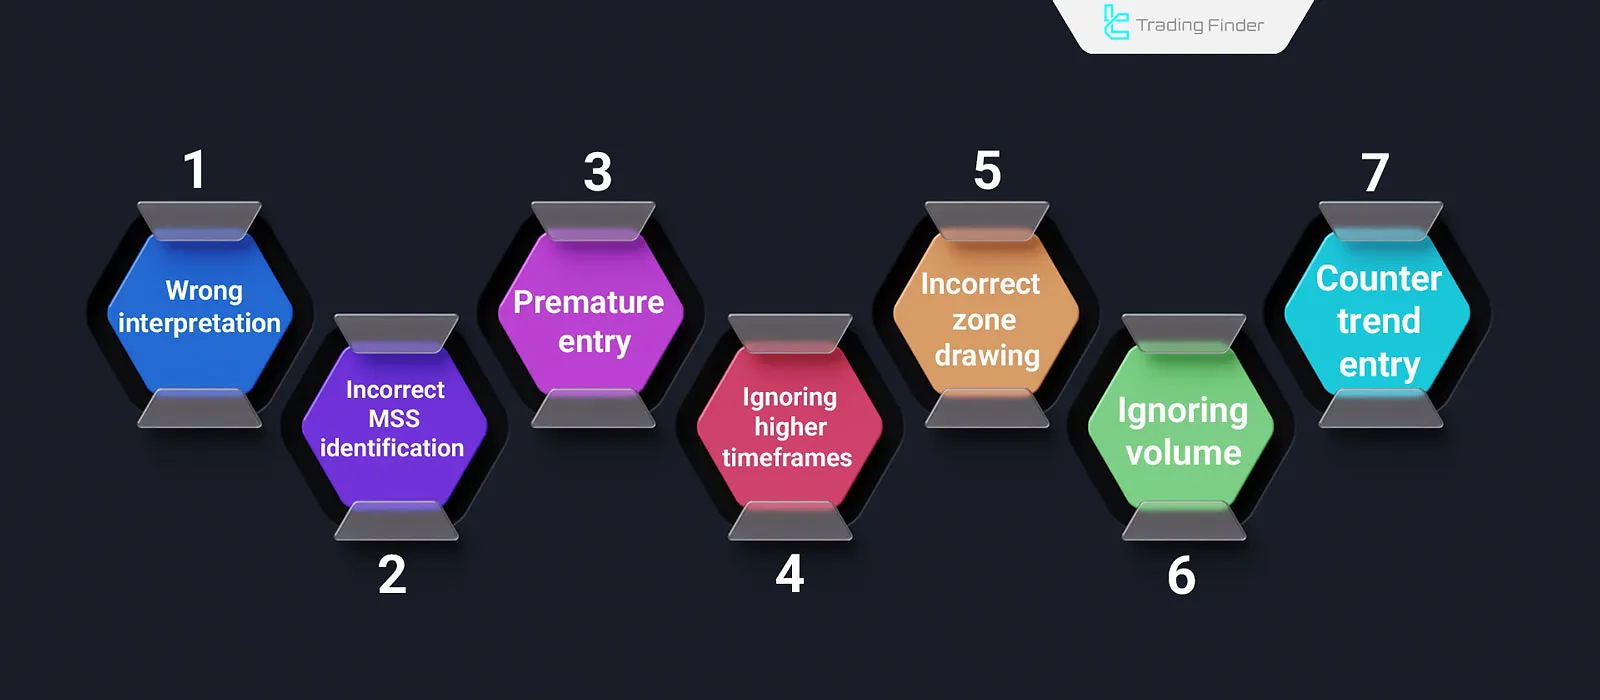
- Misinterpreting every price break as a Breaker Block without considering liquidity absorption or actual structural change;
- Incorrect identification of BOS or MSS using a Breaker Block when the market structure has not yet changed;
- Premature trade entry before confirming the price’s return to the Breaker Block area or seeing a valid reaction;
- Ignoring higher timeframes analyzing Breaker Blocks only on lower timeframes, resulting in false signals;
- Incorrect drawing of the Breaker Block zone for example, selecting the wrong candle or misdefining the boundary between the Breaker Block and Order Block;
- Ignoring liquidity volume failing to check whether the break occurred with sufficient order absorption;
- Entering against the main trend taking positions without considering the strength of the overall market structure.
Advantages and Limitations of the Breaker Block Strategy
The Breaker Block strategy, due to its focus on market structure breaks and liquidity absorption, provides high accuracy in identifying reversal zones. However, there is also the possibility of generating false signals. Advantages and disadvantages of the Breaker Block strategy:
Advantages | Limitations |
Accurately identifies zones with liquidity bias. | Requires advanced skills for proper zone identification |
Broad applicability across different markets | Risk of false signals in highly volatile markets |
Enhances trading precision when combined with MSS | - |
Comparison of Breaker Block and Order Block
To better understand the role of each zone in price behavior, it is essential to compare the Order Block (OB) and the Breaker Block (BB).
Although these two concepts originate from the same structural logic in the ICT methodology, they differ in terms of formation timing, type of involved liquidity, and trading application. Comparison Table of Order Block vs Breaker Block:
Feature | Order Block (OB) | Breaker Block (BB) |
Definition | A zone where institutional or large players’ orders are placed before a strong price movement | A zone formed after the break of an Order Block and a shift in market structure |
Main Role in the Market | Indicates the beginning of a strong movement and a potential area for price retracement in the same initial direction | Indicates a trend reversal after liquidity absorption and a break of previous structure |
Price Behavior Around It | Price returns to the Order Block and activates remaining liquidity | Price revisits the Breaker Block zone again |
Relation to Liquidity | Acts as a liquidity accumulation area before the main move | Acts as a liquidity consumption area marking the start of a new trend phase |
Suitable Trade Type | Ideal for continuation trades | Ideal for trend reversal or structural pullback trades |
Entry Confirmation | Usually confirmed by a minor structure break or validation on a lower timeframe | Confirmed by breaking the previous Order Block and retesting the same zone |
Signal Strength | Stronger in established trends | More reliable in trend reversals and liquidity sweep zones |
Conclusion
The Breaker Block strategy focuses on identifying broken Order Blocks and capturing liquidity to pinpoint precise entry and exit points in the market.
This approach requires a thorough understanding of market structure, suitable timeframes, and confirmation signals. It is applicable across various markets and timeframes.
In fact, Breaker Blocks act as key zones for market reversals, and by combining them with concepts such as BOS and FVG, traders can identify entry points with greater precision and a higher probability of success.


