


Buy Side and Sell Side Liquidity are key concepts in the ICT trading strategy, playing a crucial role in identifying market structure and tracking smart money footprints.
Understanding this concept enables traders to recognize areas where pending orders and stop losses accumulate, allowing for a more precise assessment of market bias through liquidity sweep analysis.
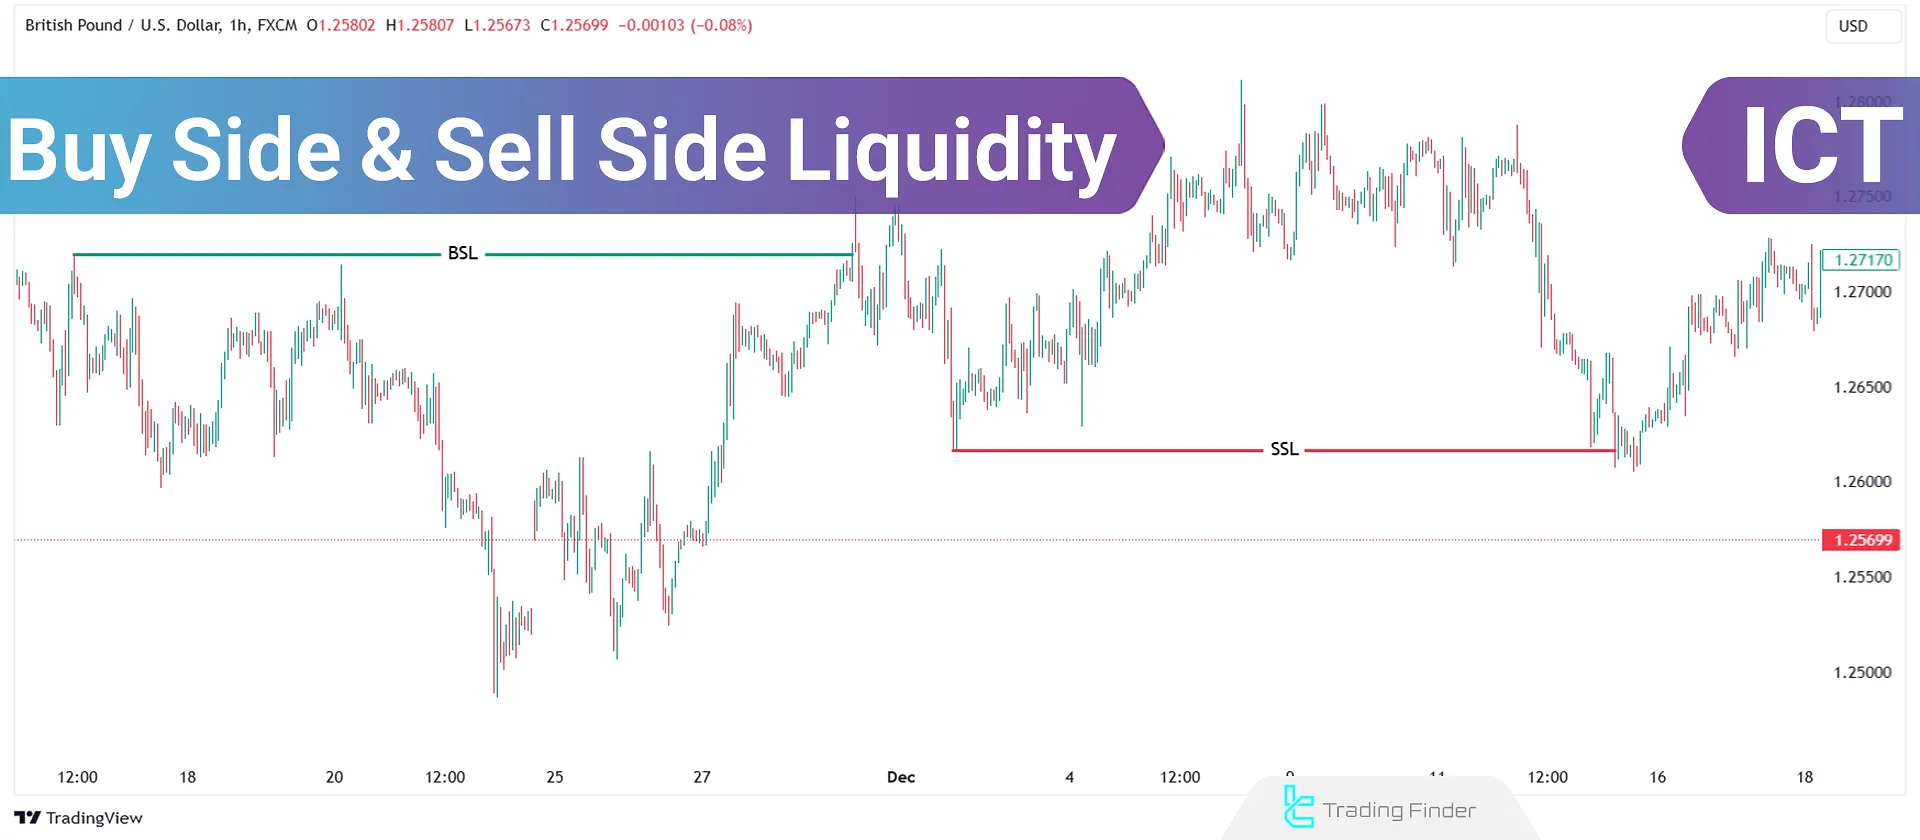
What are BSL and SSL?
There are two types of liquidity zones, and understanding them helps analyze future price trends. Large market participants, with the aim of executing their large-volume orders, drive price toward these areas in order to provide the required liquidity for effective entry or exit by triggering the stop-losses of retail traders.
Therefore, identifying these zones simplifies the understanding of smart money behavior and can be a signal of deceptive moves (Liquidity Grab) or a market phase shift.
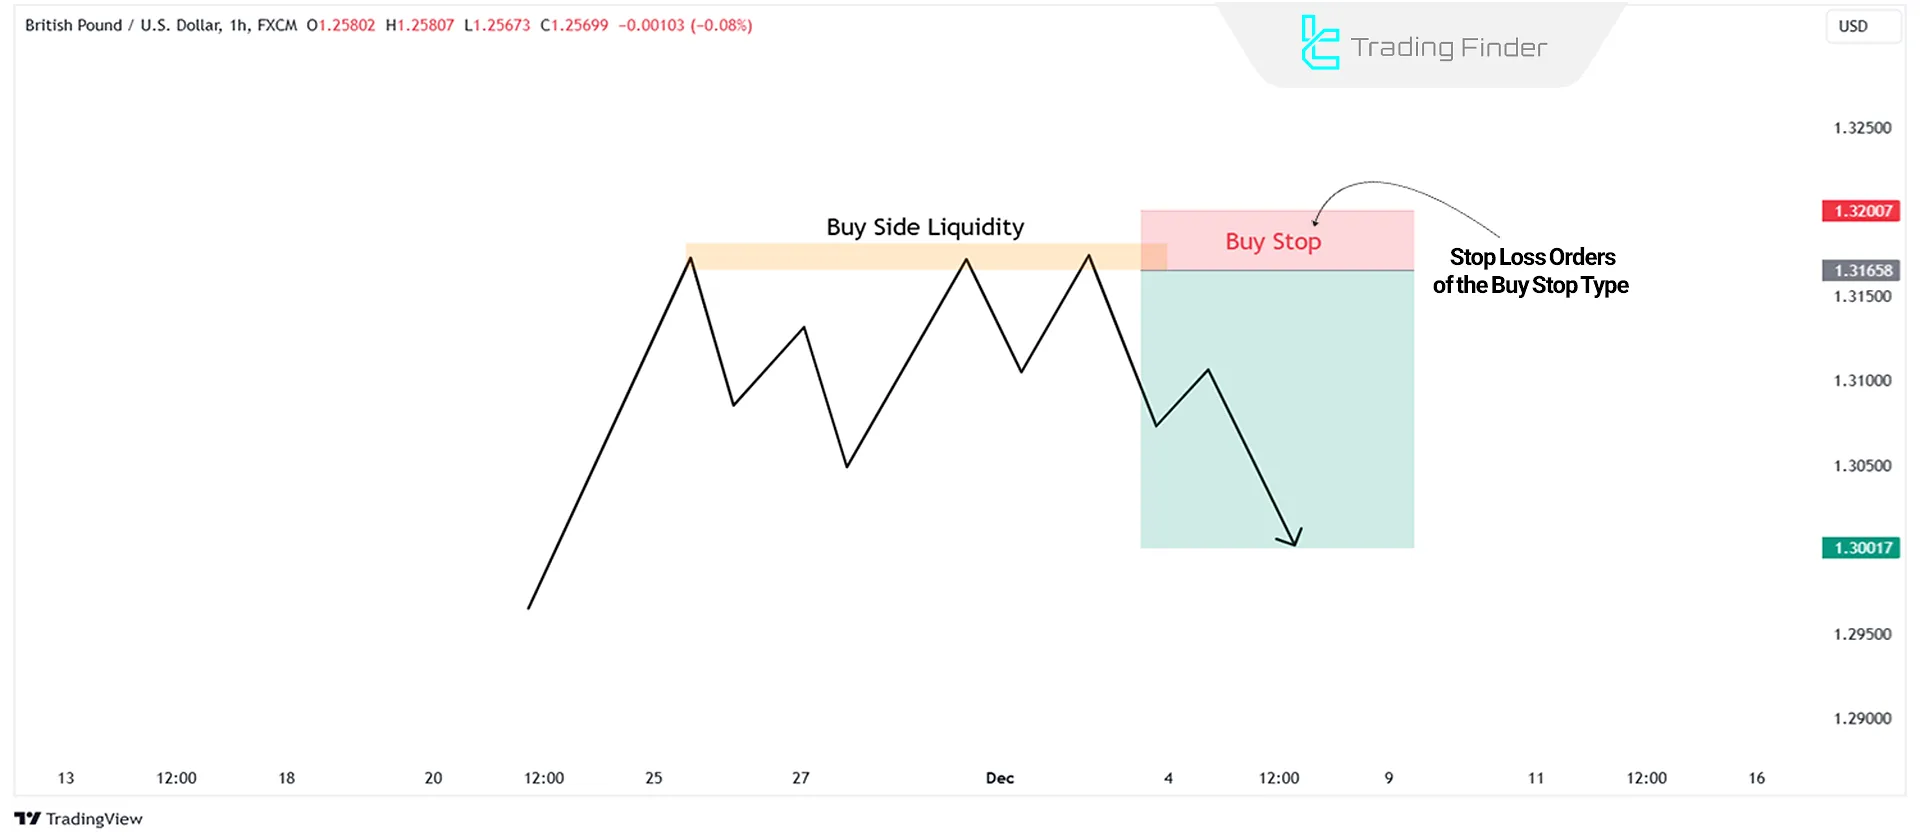
Important Note: A stop loss for a Buy position is a Sell order, and a stop loss for a Sell position is a Buy order.
Buy Side Liquidity
Refers to the volume of pending orders, primarily Buy Stops, placed by retail traders to protect their Sell positions.
These orders are usually located above key price levels, such as previous highs or equal highs (EQH).
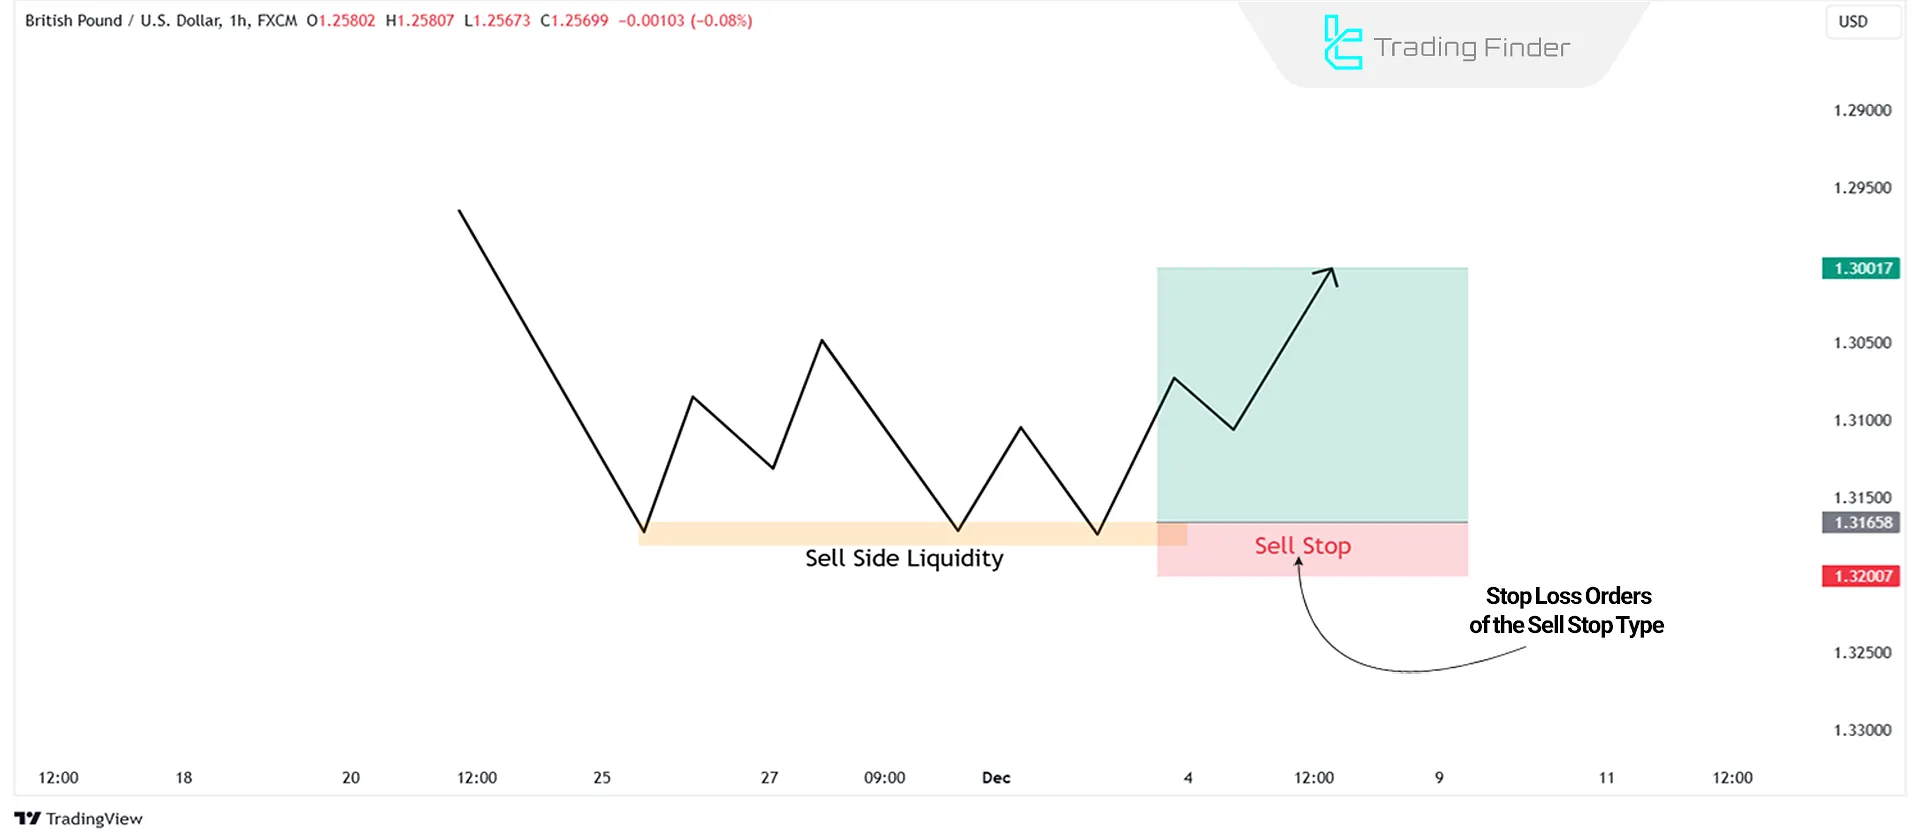
Sell Side Liquidity
Sell Side Liquidity (SSL) refers to accumulated Sell orders, typically placed as Sell Stops below key price levels. Retail traders set these orders below previous lows or equal lows (EQL) to protect their Buy positions.
Mechanism of Buy-Side Liquidity (BSL) and Sell-Side Liquidity (SSL) Formation in the Market
Buy-side and sell-side liquidity do not form randomly; rather, they are the result of the predictable behavior of retail traders. Their formation mechanism is as follows:
- Position opening by a retail trader: The retail trader enters a Buy or Sell position;
- Stop-loss placement at predictable levels: The stop-loss of a Sell position is usually placed above highs (BSL), and the stop-loss of a Buy position is usually placed below lows (SSL);
- Aggregation of stop-loss orders in a specific area: When multiple traders place their stop-losses at a common level, a liquidity pool (Liquidity Pool) is formed;
- Entry of financial institutions to extract liquidity: Large players drive price toward this area so that these orders are triggered and the required liquidity for entering their heavy positions is provided;
- Rapid price reversal after liquidity extraction: After the orders are triggered, price usually moves strongly in the opposite direction.
The educational video from the TTrades YouTube channel, by presenting examples of buy-side and sell-side liquidity on a real price chart, guides traders toward a deeper understanding of this concept.
Placement of Buy Side and Sell Side Liquidity
As mentioned before, traders place Buy Stop or Sell Stop orders in key, predictable areas to protect their positions. These areas include:
- Previous swing highs/lows: swing highs and swing lows points on the chart where the price has reversed in the past
- Daily or weekly highs/lows: These zones are significant because many traders use these timeframes to set their stop losses
- Equal highs or equal lows: When two or more highs or lows align at the same level, a cluster of stop losses forms
Difference Between Buy-Side and Sell-Side Liquidity (BSL & SSL)
The table below comparatively presents the key differences between buy-side liquidity (BSL) and sell-side liquidity (SSL) in terms of order concentration location, order type, trader behavior, and trading application.
Feature | Buy-side liquidity (BSL) | Sell-side liquidity (SSL) |
Order concentration location | Above highs | Below lows |
Order type | Buy Stop | Sell Stop |
Trader behavior | Sellers exiting positions | Buyers exiting positions |
Common price reaction | Bearish reversal | Bullish reversal |
Trading application | Suitable Sell zone | Suitable Buy zone |
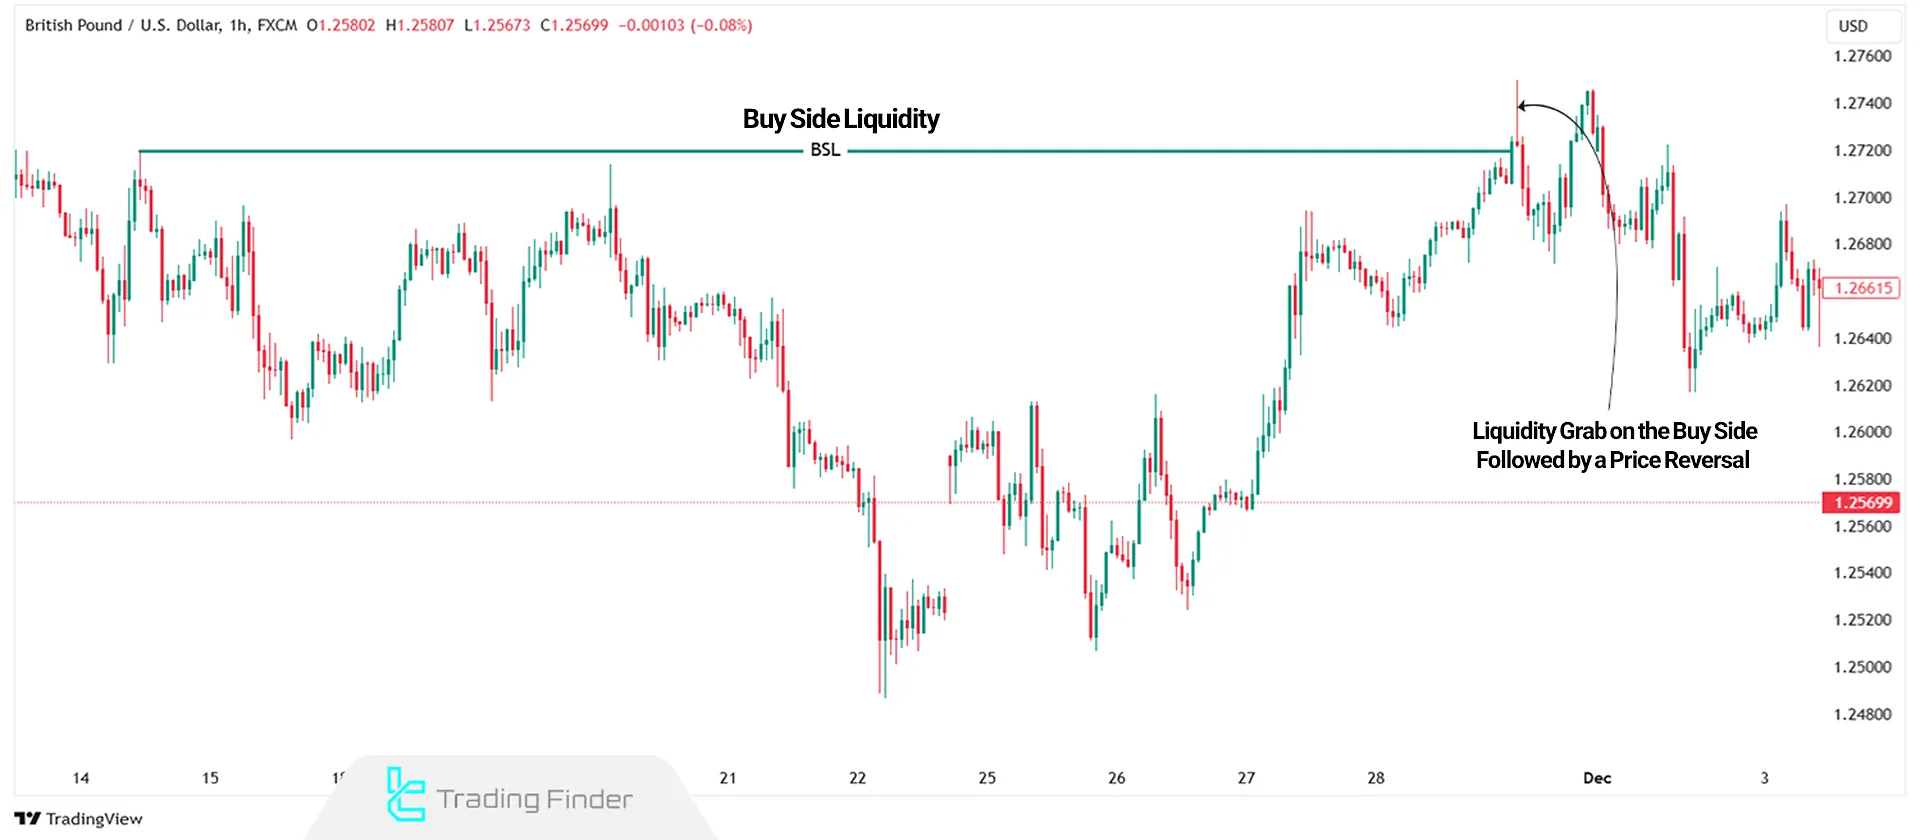
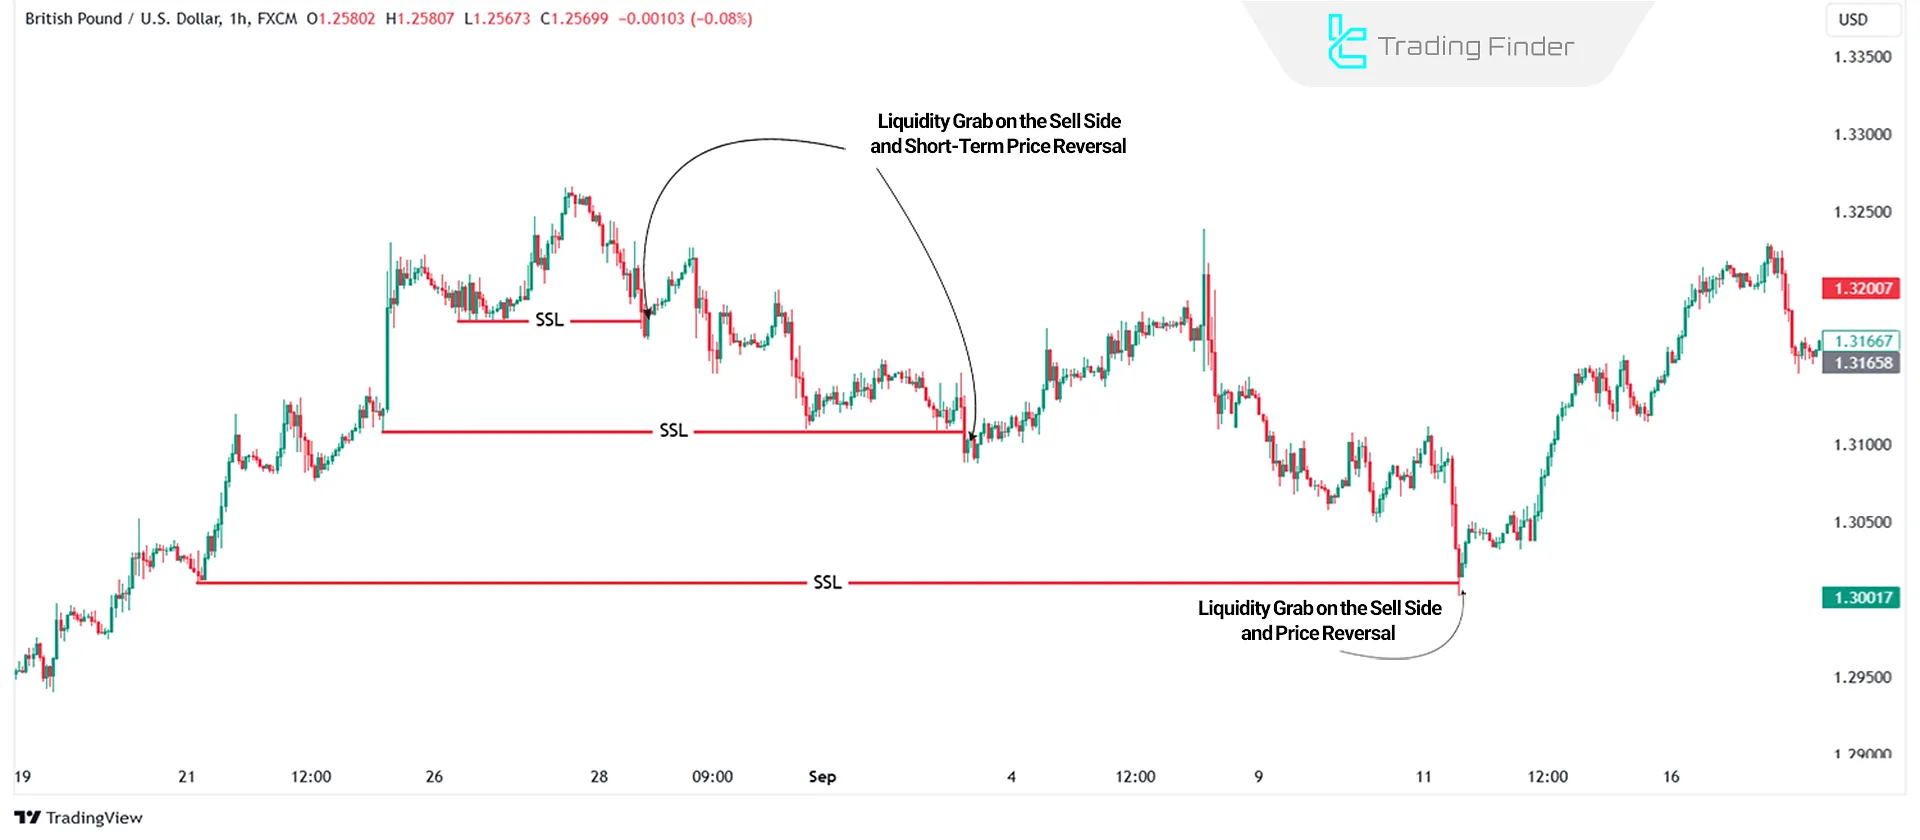
Buy Side and Sell Side Liquidity Grab
Liquidity sweep refers to a strategic move by institutional traders aimed at triggering pending orders and stop losses. When the market approaches BSL, financial institutions may push the price slightly above resistance levels.
This action triggers retail traders' stop losses, supplying liquidity to institutional orders. The result of this liquidity grab is often a rapid bearish reversal in the market.
In a downtrend, a similar event occurs when the price dips below a key support level (SSL), triggering retail traders' stop losses. This often results in a sharp, bullish reversal in the market.
How to Use BSL and SSL in Trading
Liquidity plays a crucial role in determining the price movement direction. Methods for utilizing Buy Side liquidity and Sell Side liquidity include:
- Price is always seeking balance or liquidity absorption
- Price movement between PD arrays is driven by this search, making it essential to mark these zones
- Identifying high-quality trade setups requires analyzing market structure alongside Order Blocks and premium/discount zones on higher timeframes
- Daily timeframe liquidity is often concentrated at the Previous Week’s High/Low (PWH/PWL), the Previous Day’s High and Low (PDH/PDL), or the Asian, London, and New York session highs/lows.
- Equal highs and equal lows serve as high-liquidity areas, often targeted by institutions to grab pending orders.
Trading strategy of BSL and SSL in the ICT Style
In this strategy, the main focus is on hunting smart liquidity and executing precise entries in the direction of the market’s primary move. The steps for implementing this strategy are as follows:
- Identifying liquidity on higher timeframes: In the first step, key market liquidity zones are identified on the H4 and Daily timeframes, with a focus on buy-side liquidity and sell-side liquidity;
- Waiting for liquidity extraction: After the zones are defined, the market must complete the liquidity sweep or liquidity collection process, which indicates the entry of large players;
- Entering only in the direction of the market reversal: After the sweep is executed, a trade is activated only when the market confirms a price reversal against the direction of the initial breakout with a valid structure;
- Setting the stop loss: The stop loss or loss cut is placed exactly behind the candle shadow that performed the liquidity grab, in order to control the risk of a fake-out;
- Setting the take profit: The take profit or profit-taking level is set on the opposite-side liquidity, and the trade target is defined based on the movement between SSL and BSL.
Traders who seek a better understanding of liquidity zones on the buyer and seller sides can also use the article buy side and sell side liquidity training on the writofinance.com website.
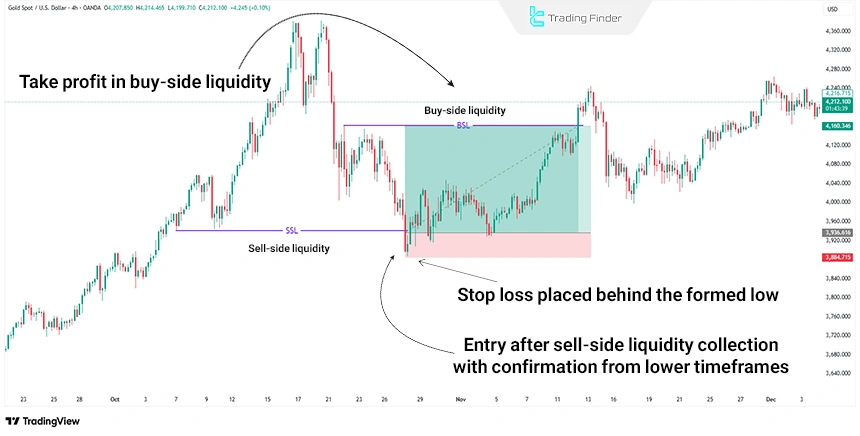
Real Trade Example Using the Buy-Side and Sell-Side Liquidity Strategy in ICT
On the gold (XAU/USD) chart, within a 4-hour bullish trend, price entered a corrective phase and the process of sell-side liquidity collection in the sell-side liquidity zone was completed.
Then, a strong price reversal accompanied by confirmation of a market structure shift on lower timeframes such as M15 activated the conditions for entering a buy trade.
The stop loss for this trading position was placed exactly behind the low formed during the sell-side liquidity collection phase, and the take profit was set on the buy-side liquidity zone.
Best Timeframe for Identifying Liquidity in Forex
In the table below, the role of each timeframe in the process of identifying liquidity in financial markets, analyzing price reactions, and determining precise trade entry points is presented.
Timeframe | Main application | Description |
Weekly | Identifying major market liquidity | Suitable for detecting institutional and long-term liquidity |
Daily | Identifying major market liquidity | Confirming and refining key liquidity zones from the smart money perspective |
H4 | Analyzing price reaction to liquidity | Assessing price behavior when reaching liquidity zones |
H1 | Analyzing price reaction to liquidity | Finding potential entry signals after the reaction |
M15 | Precise entry after liquidity sweep | Only after liquidity sweep + structure confirmation |
M5 | Very precise entry | Suitable for scalping after full scenario confirmation |
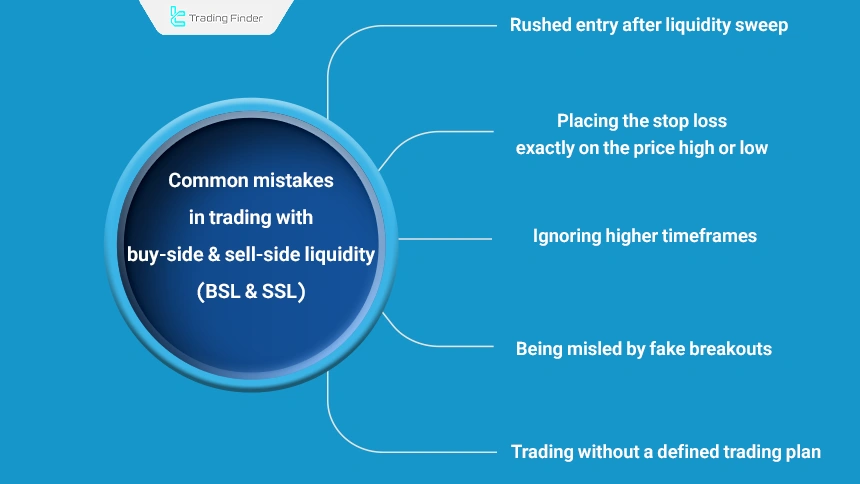
Common Mistakes in Trading Buy-Side and Sell-Side Liquidity (BSL & SSL)
Understanding common mistakes in liquidity-based trading plays a very important role in increasing decision-making accuracy and reducing unnecessary losses. The most important of these mistakes include:
- Rushing into trades after liquidity sweep: Many traders enter trades immediately after liquidity is swept, while without receiving confirmation of a market reversal, the probability of falling into price traps increases significantly;
- Placing the stop loss exactly on highs or lows: This causes traders to be easily taken out of the market by price shadows, while the main move has not yet started;
- Ignoring higher timeframes: Overlooking the overall market structure on higher timeframes leads to trades being executed against the direction of the main trend;
- Being misled by fake breakouts: Many liquidity sweeps are accompanied by fake breakouts, and emotional entries in these areas result in heavy losses;
- Trading without a defined trading plan: Entering the market without a strategy, stop loss, take profit, and defined risk management is one of the primary reasons for trader failure.
Buy-Side and Sell-Side Liquidity Indicator in MetaTrader
The buy-side and sell-side liquidity indicator in MetaTrader is designed as a specialized liquidity flow analysis tool for identifying Buyside and Sellside zones, providing traders with a more precise view of smart money behavior.
This indicator plays a key role particularly for traders who operate based on ICT and Smart Money concepts in detecting sensitive market points.
The core logic of this tool is based on tracking Buy Stop and Sell Stop orders; areas that are usually considered accumulation zones of liquidity by large market participants. When price touches these levels and a Liquidity Sweep occurs, the indicator evaluates price reversal conditions and, upon confirmation, issues a trade entry signal.
This process guides the trader to enter trades in alignment with the liquidity flow of financial institutions in the market.
In terms of application, this indicator can be used for Forex, Cryptocurrency, stocks, and indices, and it performs accurately across different timeframes. For example, on a 30-minute chart of a currency pair, after sell-side liquidity collection and a price return above the defined level, buy positions can be identified with higher accuracy.
Conversely, on another currency pair, after hunting buyer liquidity and a downward break of the level, conditions for entering sell trades are provided.
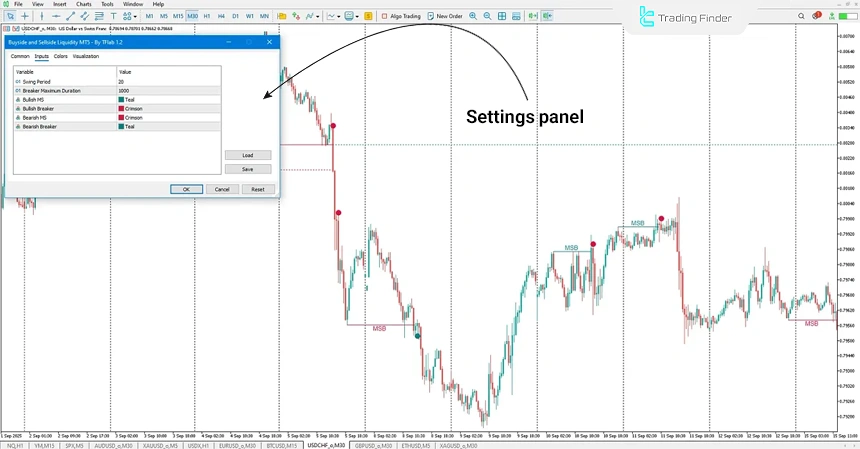
In terms of settings, parameters such as Swing Period for fluctuation timing, Breaker Maximum Duration for how long levels remain visible after a break, and color settings to differentiate bullish and bearish structures are available to the user. These features allow the indicator to be fully customized according to each trader’s strategy.
Overall, the buy-side and sell-side liquidity indicator is an advanced analytical tool for professional traders who seek a deeper understanding of price behavior, liquidity flow, and precise entry and exit points based on ICT and smart money concepts.
This indicator can transform a trader’s decision-making process from a speculative approach into a systematic process based on liquidity logic.
Conclusion
Buy Side and Sell Side Liquidity refer to clusters of stop losses placed above highs or below lows. Retail traders are particularly vulnerable to these traps, especially when setting stop losses at predictable levels such as previous highs/lows, equal highs/lows (EQH/EQL), session highs/lows, and daily/weekly highs/lows.
Trading during liquidity sweep comes with risks such as market manipulation, false breakouts, and unexpected volatility. To mitigate these risks, traders should avoid placing stop losses at predictable levels and apply proper risk management strategies.


