


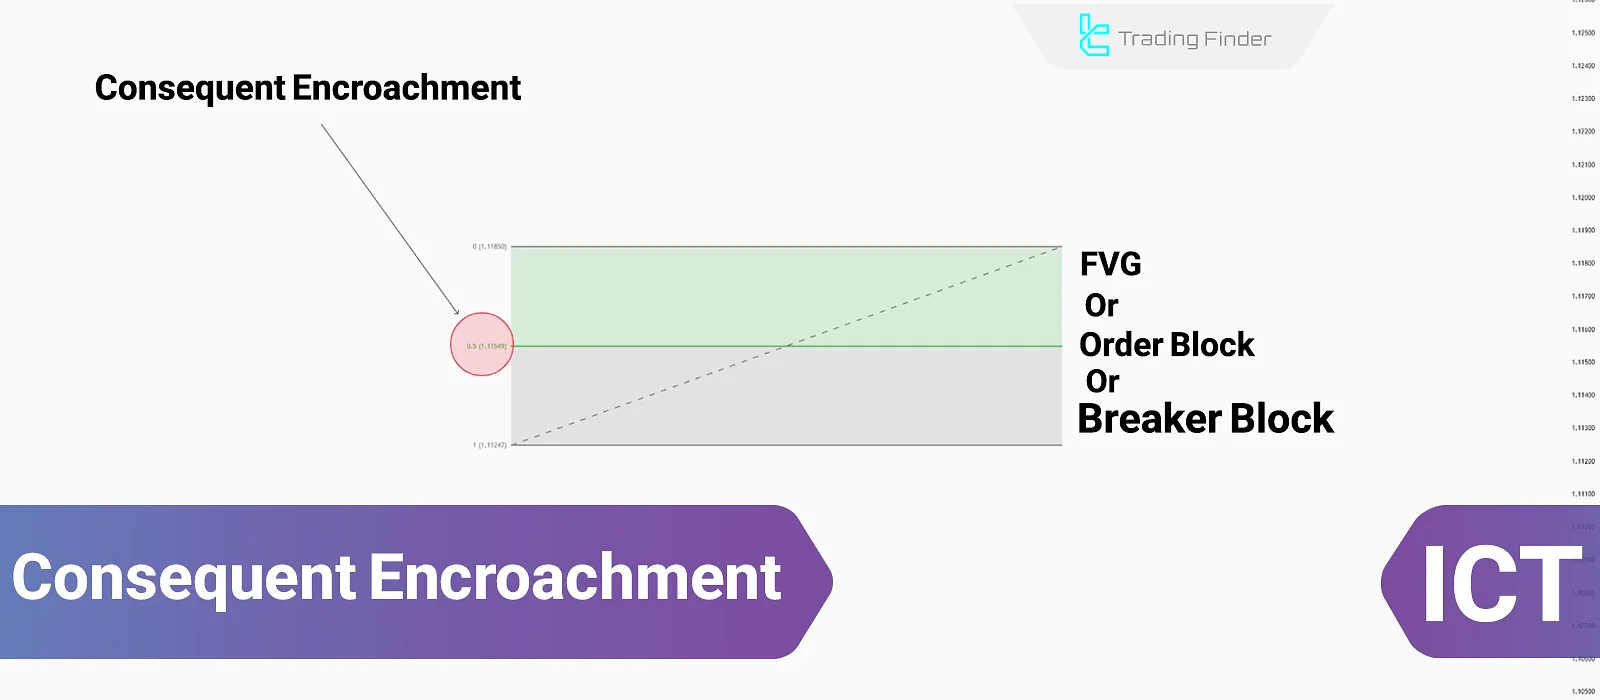
Consequent Encroachment (CE) focuses on a level where the price is highly likely to react. This concept is crucial, especially in analyzing Fair Value Gaps (FVGs) and other trading structures. Traders can use this approach to identify optimal entry and exit points in the market.
Penetration into the mid threshold, known as ict ce or consequentencroachment forex, is effectively a boundary that lies between the inefficiency zone and the price equilibrium point. For this reason, market reactions at this level exhibit a more structured order compared to other parts of the market structure.
This level, referred to as consequent encroachment in trading, increases the probability of a short-term reversal or the initiation of trend continuation and is therefore regarded as a precise decision-making point. Additionally, the use of ict ce allows the trader to assess future price behavior with greater accuracy without requiring the complete filling of the zone.
What is ICT Consequent Encroachment (CE)?
CE refers to the 50% level of a trading structure, such as the midpoint of a Fair Value Gap (FVG) or other ICT PD Arrays. This level is considered the “midpoint” of a gap or a balanced price zone where the price is most likely to react.
Unlike full gap fills, CE allows traders in the forex market to take action before an FVG or Order Block is filled, offering an approach for anticipating price reversals or trend continuation.
This concept is explained in the educational article on Consequent Encroachment on the Writo-Finance website:
Why is the CE Level Important in The ICT Style?
In the ICT style, the CE level is not merely a simple mathematical midpoint; rather, it represents an area where the market reaches a temporary balance between buyers and sellers. When an FVG or any other PD Array is formed, certain parts of the market have moved in an inefficient manner.
Under these conditions, large institutions often return to the midpoint of this imbalance to complete their orders. For this reason, the CE level is commonly recognized as a point where price has a higher probability of reaction and can act as the starting point for short-term reversals or the continuation of the main move.
This explanation clarifies why ICT traders often do not wait for a zone to be fully filled and instead consider the CE level as a key decision-making criterion.
This concept is also explained in video form on the DodgysDD YouTube channel:
Advantages and Disadvantages of CE
Like other concepts in ICT style, Consequent Encroachment has its own strengths and limitations:
Disadvantages | Advantages |
Potential for false signals in lower timeframes | Identifies key market levels |
Requires advanced experience for accurate usage | Improves risk management and capital efficiency |
Price may ignore CE levels at times | Applicable across all markets and timeframes |
Complex for beginner traders | Enhances trading precision |
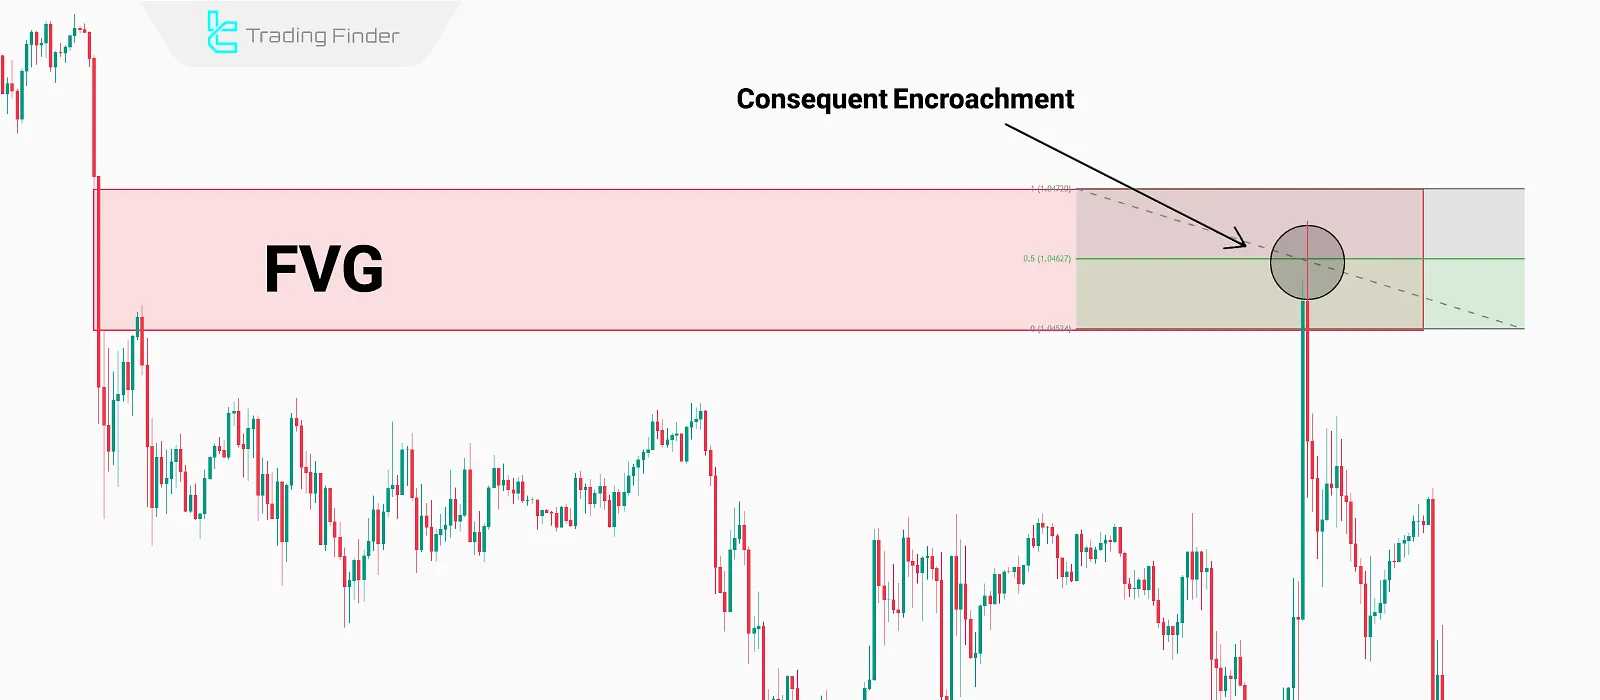
How to Identify Consequent Encroachment (CE)?
To identify CE in an FVG structure, follow these steps:
- Locate the Fair Value Gap (FVG): Identify a bullish or bearish FVG on the chart;
- Use the Fibonacci Tool: Apply Fibonacci from the highest point to the lowest point of the FVG;
- Mark the 50% Level: The 50% Fibonacci level represents the Consequent Encroachment, which is an entry or exit point.
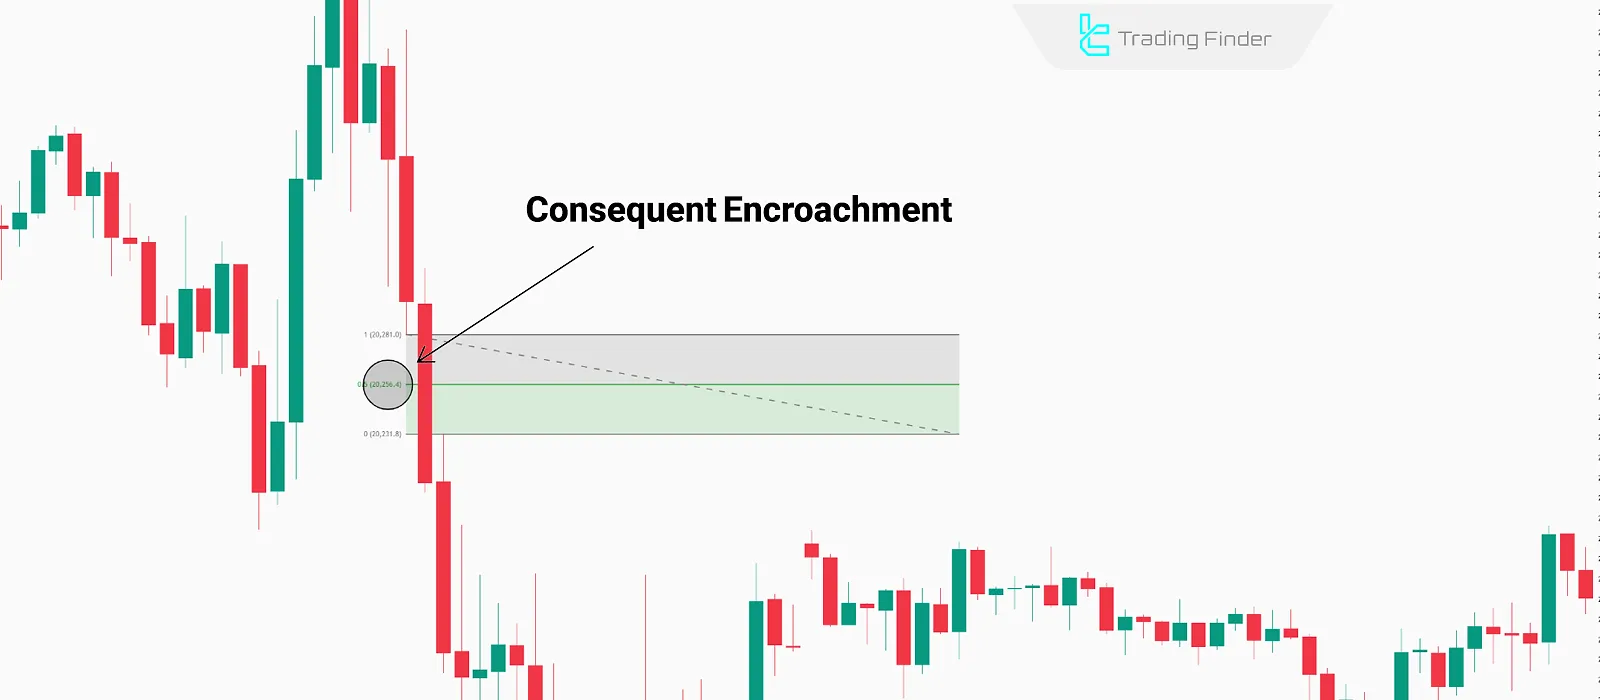
An example of a bearish Consequent Encroachment in a Fair Value Gap, identified with the Fibonacci tool
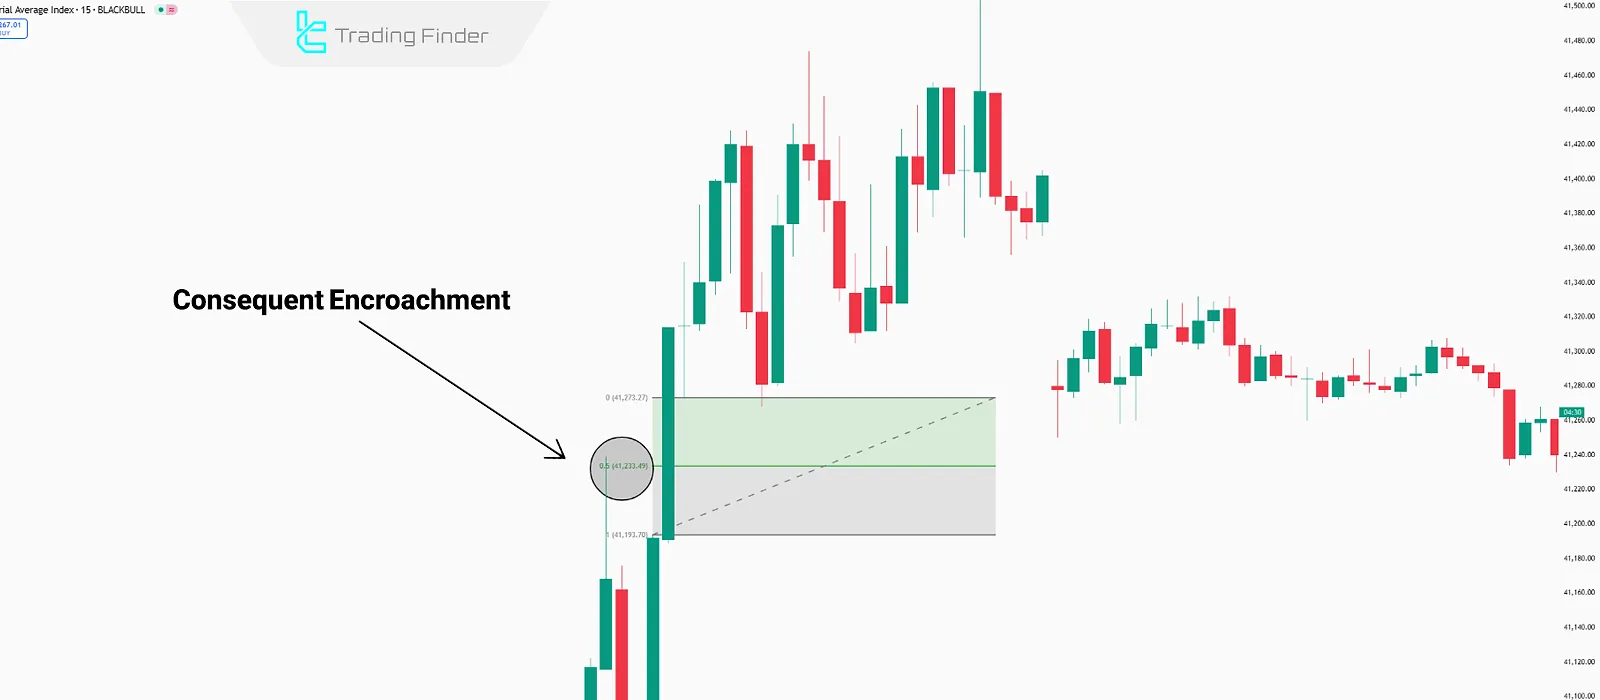
Below is an example of a bullish CE:
How Does CE Apply to Other ICT Concepts?
Apart from Fair Value Gaps (FVGs), Consequent Encroachment is also applicable in the following ICT structures:
- Order Blocks (OBs): CE within an Order Block acts as a price equilibrium point;
- Breaker Blocks (BBs): CE helps identify critical levels in Breaker Blocks;
- New Week Opening Gaps (NWOGs): Weekly opening gaps contain a CE level that acts as a liquidity magnet.
The Difference Between CE and Mean Threshold in the ICT Style
At first glance, both CE and Mean Threshold refer to the 50 percent level of a zone; however, their applications are different.
The CE level, known in consequent encroachment trading and ce trading, is used in structures such as FVG or IFVG, meaning areas where the market has experienced price inefficiency.
a concept often described as fvg consequent encroachment and central to understanding the consequent encroachment meaning. In contrast, the Mean Threshold is applied to order based structures such as Order Block or Breaker Block.
In these zones, the mean level represents the midpoint of institutional order volume, and price behavior when interacting with it may differ from ce trading and classic consequent encroachment trading behavior.
By understanding the difference between these two concepts and the precise consequent encroachment meaning, a trader can apply the appropriate level within each structure and achieve a more accurate analysis of price reversals or trend continuation.
Key Points for Identifying and Trading with CE or mid-Threshold Penetration
he CE concept, widely used in consequent encroachment trading, delivers its highest effectiveness when analyzed within the context of market structure and alongside other analytical filters.
Using this zone in isolation, without considering the timeframe and overall market conditions, can lead to misinterpretations in ce trading decision-making.
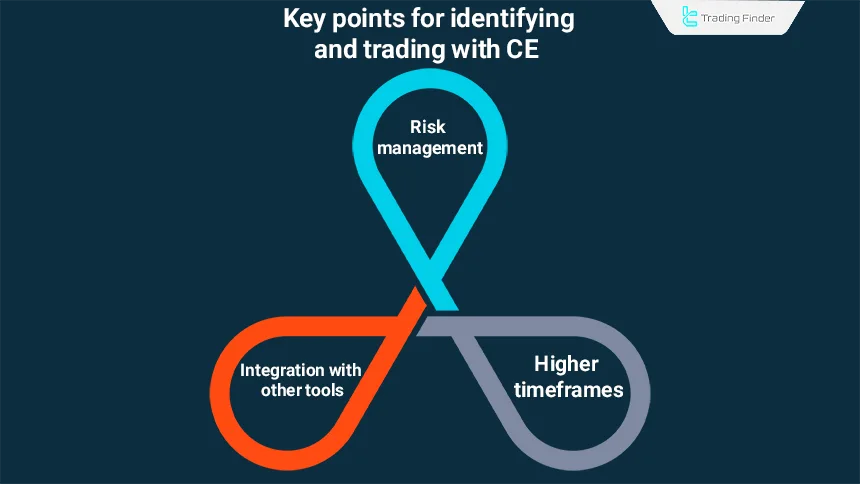
Key Points for Identifying and Trading with CE
To trade using Conceptual Equilibrium (CE), combine it with liquidity shifts and structural changes and focus on higher timeframes for greater reliability
- Combining with Other Tools: CE works best when integrated with other trading concepts;
- Higher Timeframes: CE levels are more reliable in higher timeframes as they filter out the noise;
- Risk Management: CEalone is insufficient for trade execution; combining it with other ICT elements is essential to avoid losses.
Three Essential Conditions Before Using CE for Trading
For CE to become a valid trading level, as defined in the ict consequent encroachment definition, three important factors must be evaluated alongside it within professional encroachment trading frameworks.
- Daily Bias: Identifying the daily direction (Daily Bias) is highly important. When price reacts to CE against the primary market direction, the probability of success is lower, a consideration every ce trader must account for;
- Premium and Discount Zones (PD Array): Second, it must be clear which PD Array the price is currently testing, because the behavior of an FVG is completely different from an Order Block or a Breaker, and each has its own specific conditions within encroachment trading;
- Liquidity Sweep (Next Draw on Liquidity): Analyzing the Next Draw on Liquidity helps determine the probable path of price movement after reacting to CE, aligning with the practical application of the ict consequent encroachment definition. If the liquidity target is not clear, precise trading decision-making will not be possible for a disciplined ce trader.
Practical Example of Trading with Consequent Encroachment
Below is a real-world example demonstrating how price reacts to CE in an uptrend on USD/JPY chart, where price reaches Consequent Encroachment and reverses downward.
In this example, after an upward move, price enters the FVG zone and reacts upon penetrating its mid threshold, known as Consequent Encroachment.
This reaction indicates that the reduction in buying momentum at this level has created the conditions for a short-term directional shift and the beginning of a price correction.
Entry Strategy with CE on Lower Timeframes and Confirmation Using MSS
After price reaches the CE level on higher timeframes, known as ce in ict, the most effective entry approach is to shift to lower timeframes and wait for a Market Structure Shift (MSS).
At this stage, the trader should observe whether price, after reacting to CE, creates a structural break, forms a new FVG, or breaks an internal high or low. These behaviors indicate that the market is prepared to react to CE within the logic of ce in trading.
Once MSS is formed, entering on a retest of a lower timeframe FVG or OB can provide a more precise trade entry. This method reduces error and improves entry quality.
Breaker Market Structure Indicator; Precise Identification of Market Structure Breaks
The Breaker Market Structure indicator is a specialized tool for analyzing price behavior, designed with a focus on smart money patterns, price action principles, and structures taught within the ICT style, where ce in ict is frequently applied.
The primary objective of this tool is to identify the exact moment when the market exits its current structural framework and enters a new phase of movement.
The indicator’s operating mechanism is based on identifying structural highs and lows. Whenever one of these points is broken, the indicator records the break as MSB and extends that same level as a dashed line on the chart so that subsequent price reactions to this level can be observed in the context of ce in trading.
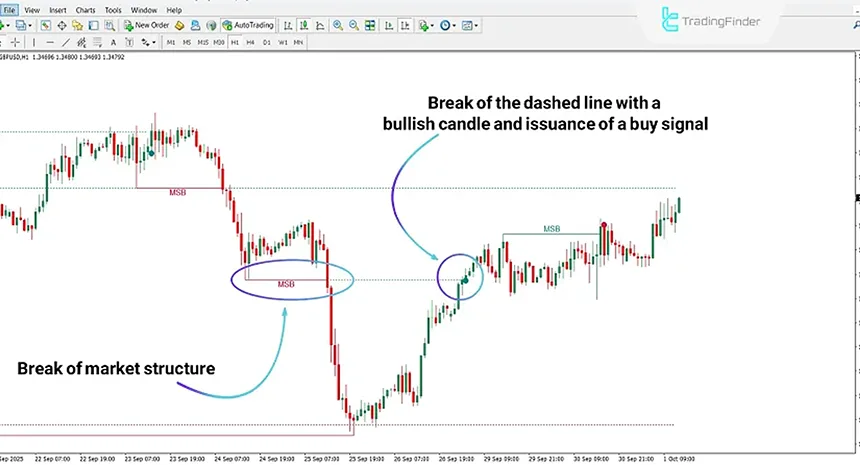
If, after the break, the body of a bullish candle crosses the dashed line again, a condition forms that can signal buyer participation and the beginning of an upward move.
In the opposite scenario, the passage of a bearish candle through the same dashed line indicates the potential activation of selling pressure and the start of a downward move.
In this way, the trader can identify moments of price flow change with greater clarity. This feature makes the indicator a suitable option for analyzing structure breaks, examining emerging trends, and evaluating potential reversal points alongside ce in ict concepts.
Customization of settings is another important aspect of this tool. Parameters such as Swing Period are used to define the number of reference candles in identifying highs and lows, while Breaker Maximum Duration determines the strength and length of the continued display of the break level.
The ability to set colors for bullish and bearish levels also enhances chart readability under different conditions. By presenting structure breaks in a simple yet purposeful manner, the Breaker Market Structure indicator makes the analytical path clearer for the trader.
Accurate identification of the MSB moment, extension of the break level, and evaluation of candle behavior relative to it help key decision points become more visible.
With its focus on price flow logic, this tool provides a structured and reliable approach to identifying significant changes in market trends when applying ce in trading.
Application of CE in Different ICT Structures
Within various ICT structures, the CE level plays different roles, particularly in ce in ict methodologies. The table below shows how this concept is applied in each structure:
Structure | Zone Type | Method of determining CE | Application |
Fair Value Gap (FVG) | Price inefficiency | Midpoint of the gap | Lower risk entry point |
Internal Fair Value Gap (IFVG) | Internal gap | Half the distance between candles | Confirmation of trend continuation or reversal |
Order Block | Order placement zone | Mean Threshold | Alternative entry in deep OBs |
Breaker Block | Structure break | 50 percent level of the block | Identification of rapid reversal zones |
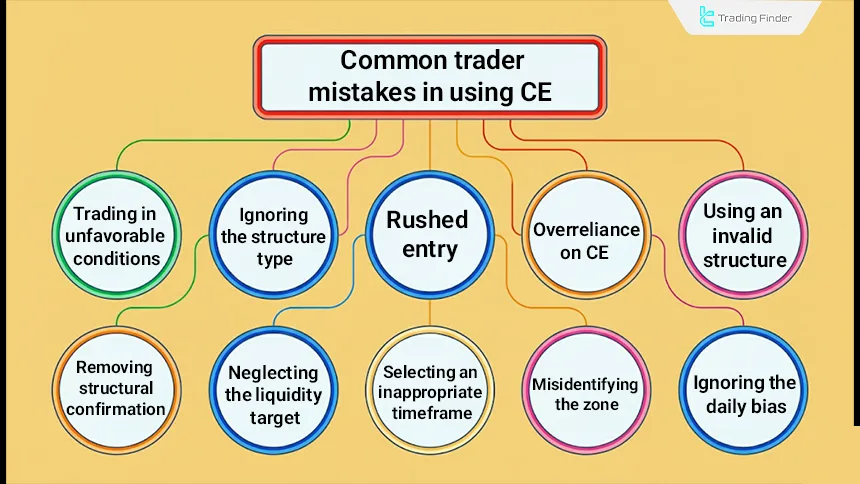
Common Trader Mistakes When Using CE
A significant portion of trading errors is related to misinterpretation of CE, especially when ce in ict is applied without context. The most common mistake occurs when a trader reacts solely to price touching CE without considering overall market direction.
Types of common mistakes in trading with CE:
- Ignoring daily bias: entering trades solely based on price interaction with CE without alignment with the daily bias in ce in trading;
- Misidentifying the zone: treating CE and Mean Threshold as identical and misanalyzing the reactive zone;
- Selecting inappropriate timeframes: trading CE on very small timeframes and increasing the likelihood of false signals;
- Neglecting the liquidity target: entering without analyzing the Next Draw On Liquidity and the projected price path;
- Removing structural confirmation: entering without observing MSS on lower timeframes after price reacts to CE;
- Using invalid structures: applying CE to zones that lack a valid position within the PD Array;
- Excessive reliance on CE: using CE without considering higher timeframes or overall market context in ce in ict;
- Rushed entries: entering on the first touch of CE without evaluating candle behavior or structure change;
- Ignoring structure type: failing to differentiate price reactions across different FVGs and OBs;
- Trading in unfavorable conditions: using CE in markets with extreme volatility or abnormal volume.
Conclusion
The ICT Consequent Encroachment (CE) is a refined tool for optimizing price zones in ICT structures such as FVGs and Order Blocks. By dividing key market areas into precise sections, CE enhances entry accuracy and trade execution.
In practice, the effectiveness of CE becomes evident when the trader, instead of reacting solely to a level touch, evaluates price behavior through its interaction with the structure of that specific zone.
The market’s reaction to CE may indicate the completion of institutional orders or a temporary reduction in price imbalance, a condition that gains meaning only when aligned with the daily bias, the liquidity target, and the type of PD Array.
For this reason, CE is regarded less as a fixed entry level and more as a criterion for assessing zone quality and measuring the market’s readiness for a reversal or continuation move.


