


Fibonacci levels in ICT Strategy technical analysis are used to identify potential support and resistance levels.
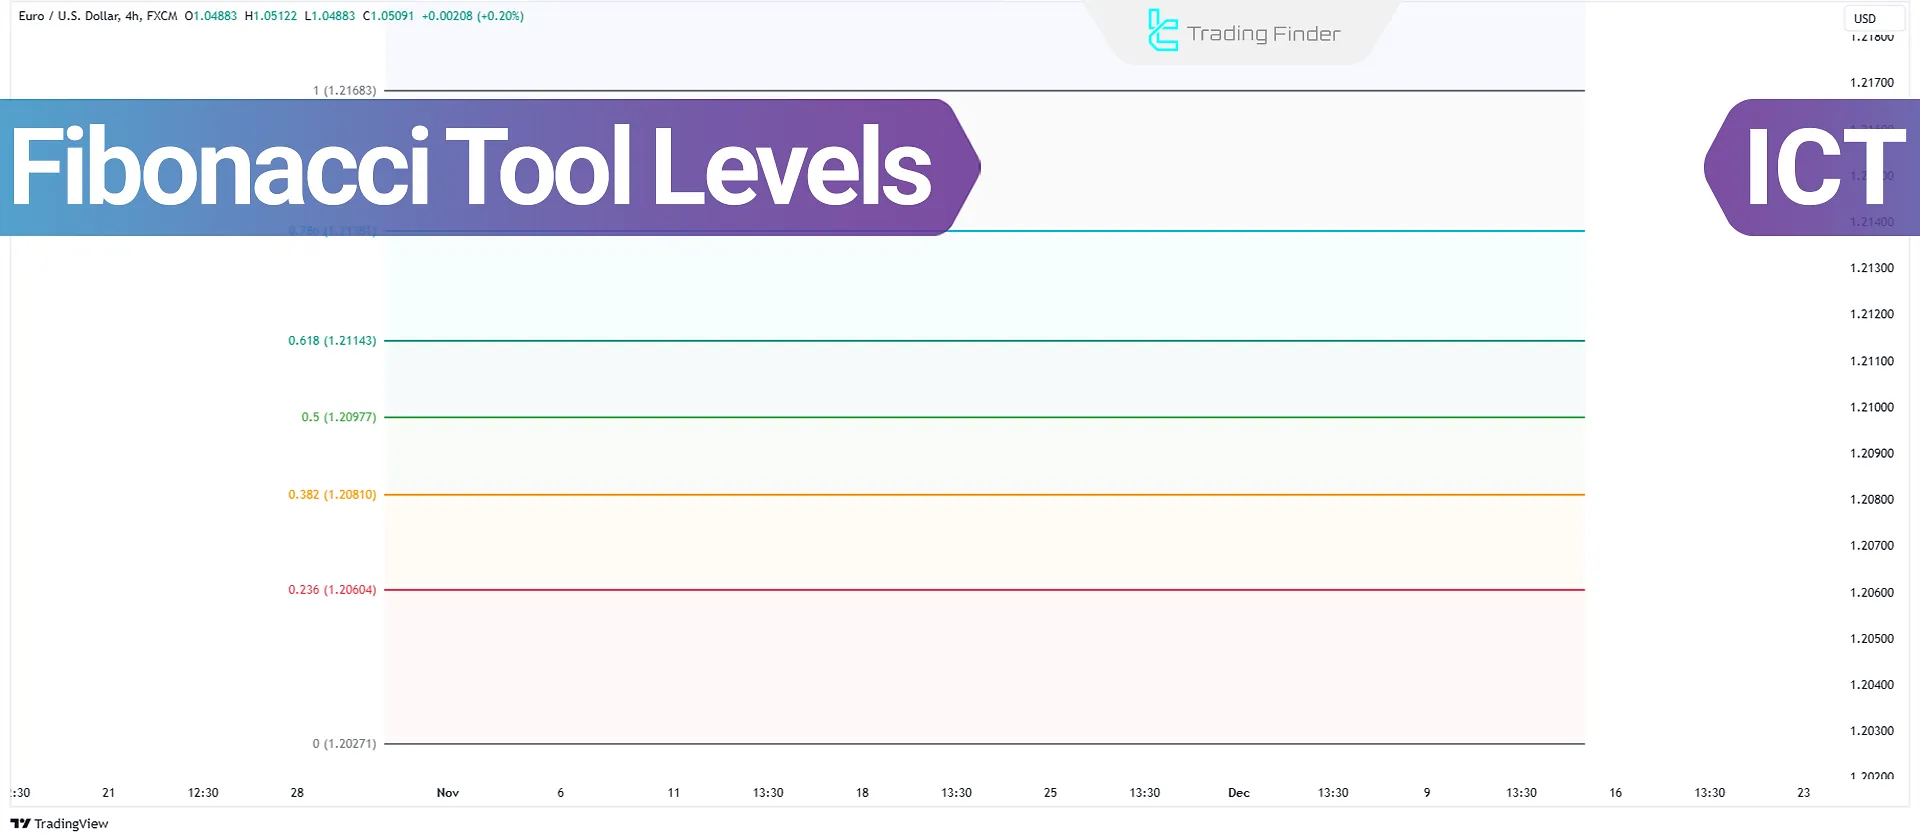
Traders can use key Fibonacci ratios such as 23.6%, 38.2%, 61.8%, and others to determine entry points, exit points, and trend reversals.
What Are ICT Fibonacci Levels?
ICT Fibonacci levels are used to identify price reversal points and define trading strategies.
These levels are designed based on ICT-style Fibonacci retracement zones and play a crucial role in ICT for precise entry and exit points, particularly in the OTE levels (Optimal Trade Entry) strategy and defining Premium and Discount zones.
Unlike traditional Fibonacci analysis, ICT Fibonacci levels not only help identify support and resistance zones but also assist in predicting retracement movements and potential price surges. By configuring Fibonacci levels in ICT, traders can enhance their market trend analysis.
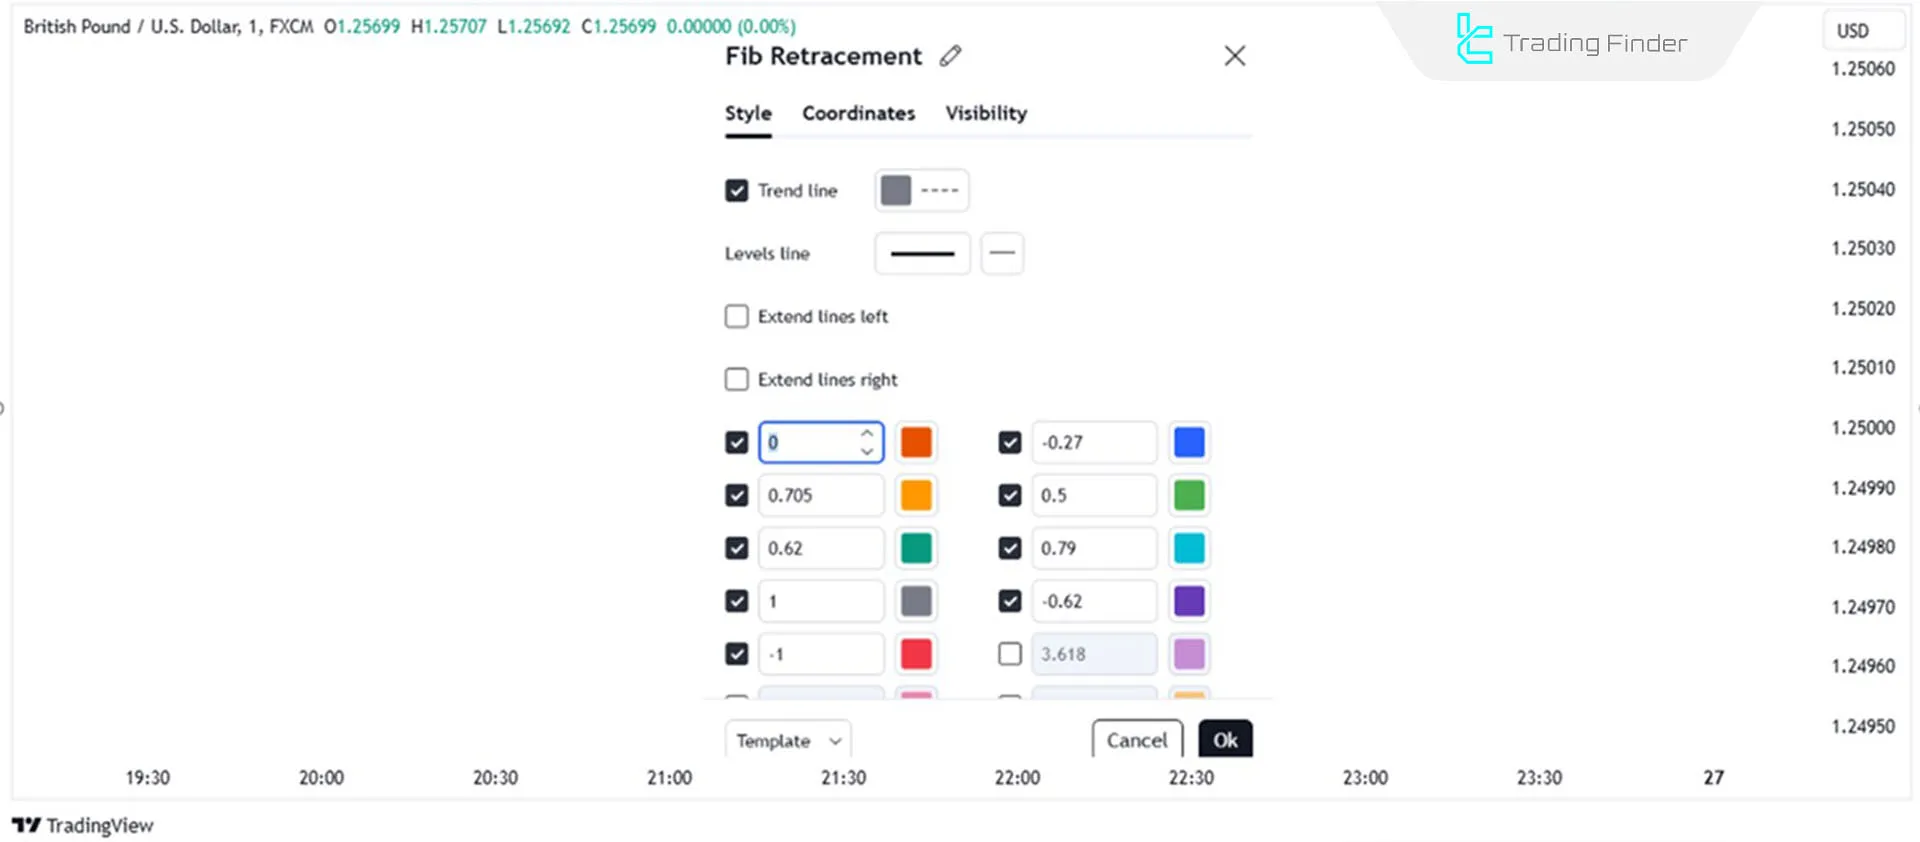
ICT Fibonacci Level Settings
The table below outlines all the Fibonacci levels in ICT along with their applications:
Fibonacci Level | Application |
1 | Starting point for drawing Fibonacci |
0.5 | Mid-level or equilibrium level |
0.62 | 62% retracement level |
0.705 | Optimal trade entry (OTE) level 70.5% |
0.79 | 79% retracement level |
0 | First take-profit and endpoint for Fibonacci |
-0.27 | Target 1 |
-0.62 | Target 2 |
-1 | Symmetric level (equal to the distance of start and end in the opposite direction) |
How to Draw Fibonacci Levels in ICT?
Each ICT trading setup requires aspecific Fibonacci drawing method. Below, we explain the two main ways to use Fibonacci in ICT strategies:
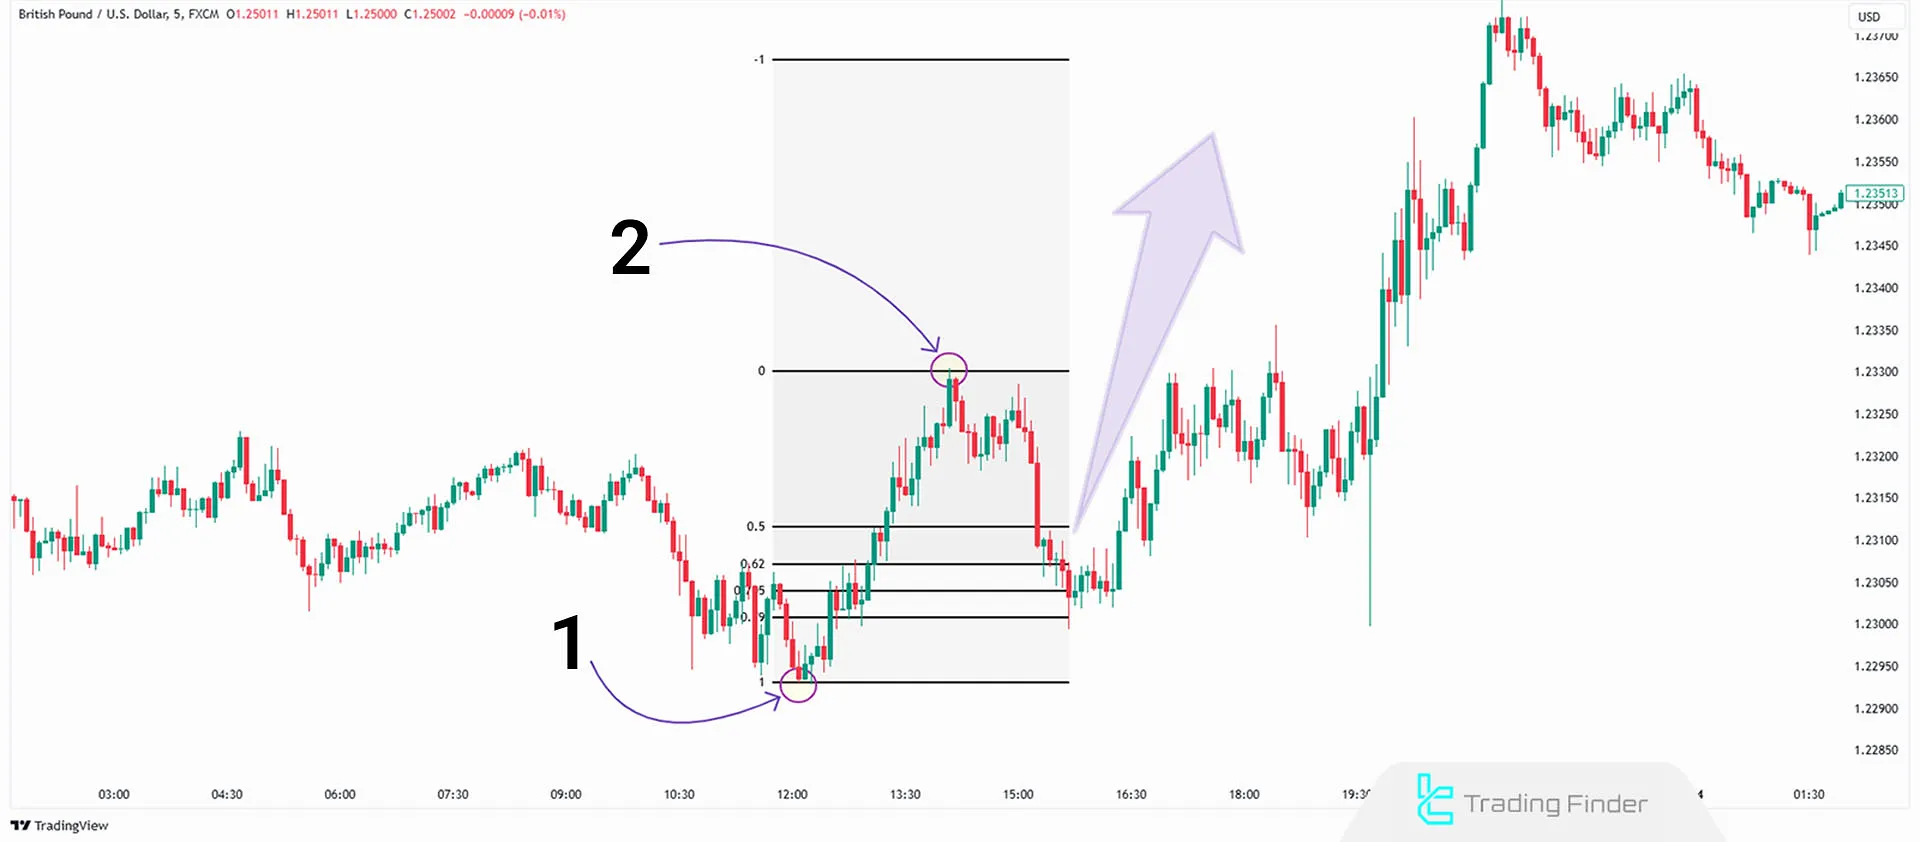
Using Fibonacci in the OTE Strategy (Optimal Trade Entry)
To apply Fibonacci levels in the OTE levelstrategy within ICT, traders must use specific levels as shown in the diagram:
Bullish Setup
In a bullish setup, Fibonacci levels should be drawn fromthe lowest point (1 in the diagram) to the highest peak (2).
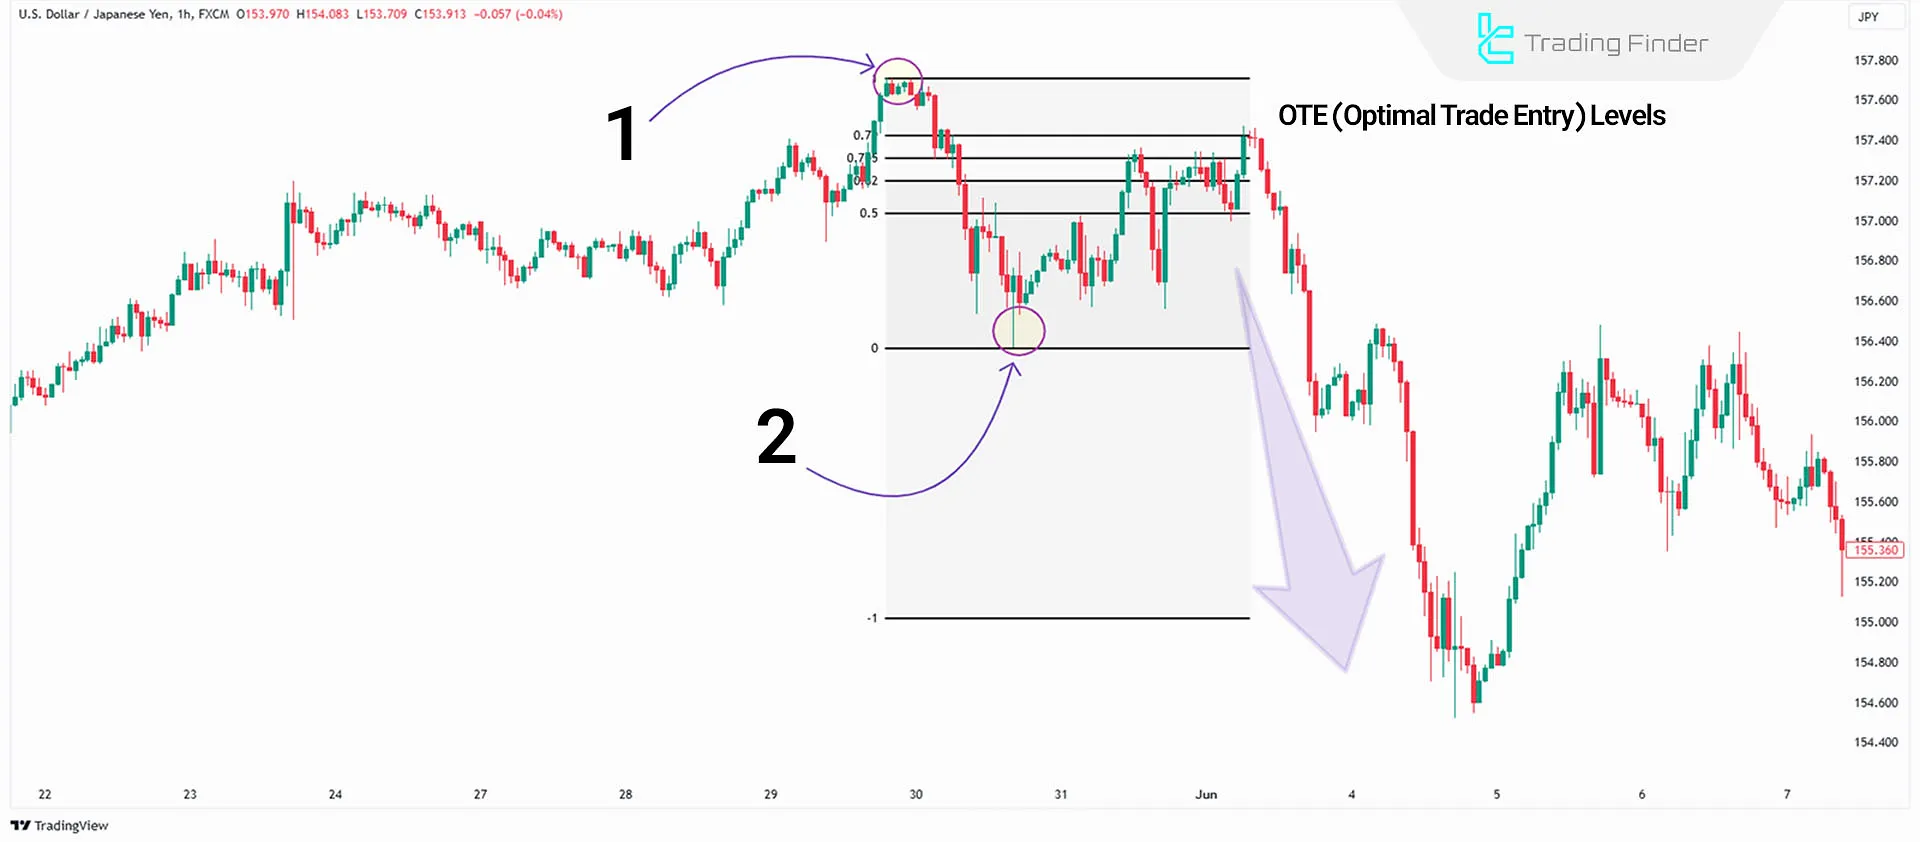
Bearish Setup
In a bearish setup, Fibonacci levels should be drawn from the highest point (marked as 1) to the lowest trough (marked as 2).
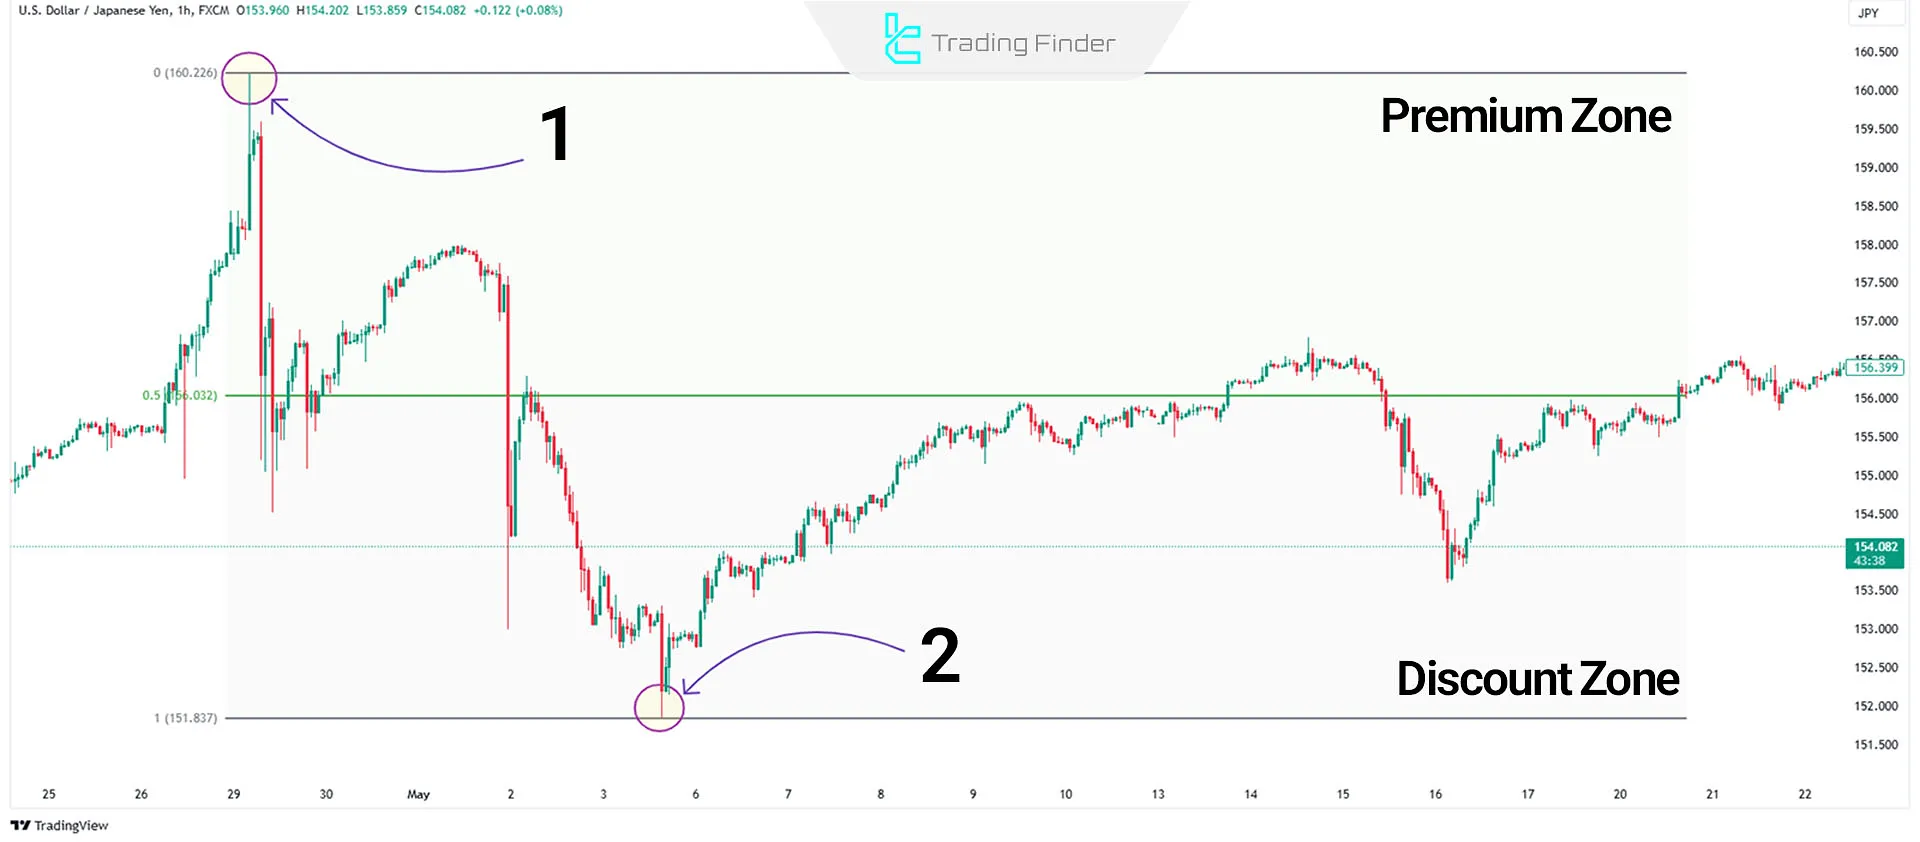
Using Fibonacci in PD Array Zone (Premium & Discount Zone)
For definingPremium (Overpriced) and Discount (Underpriced) zones, the starting and ending points of Fibonacci placement do not matter. Instead, Fibonacci serves only to divide a price range into two parts:
- Above the 0.5 level: Premium Zone (Overpriced Area)
- Below the 0.5 level: Discount Zone (Underpriced Area)
Conclusion
By properly configuring ICT Fibonacci levels, traders can identify potential support and resistance zones and use them to define precise entry and exit points.
Traders can enhance their profitability through custom Fibonacci settings in different ICT strategies—such as OTE (Optimal Trade Entry) and PD Array Zones (Premium & Discount Analysis).
These Fibonacci levels not only help understand retracement movements and price surges, but they also play a significant role in risk management and overall market direction analysis.


