


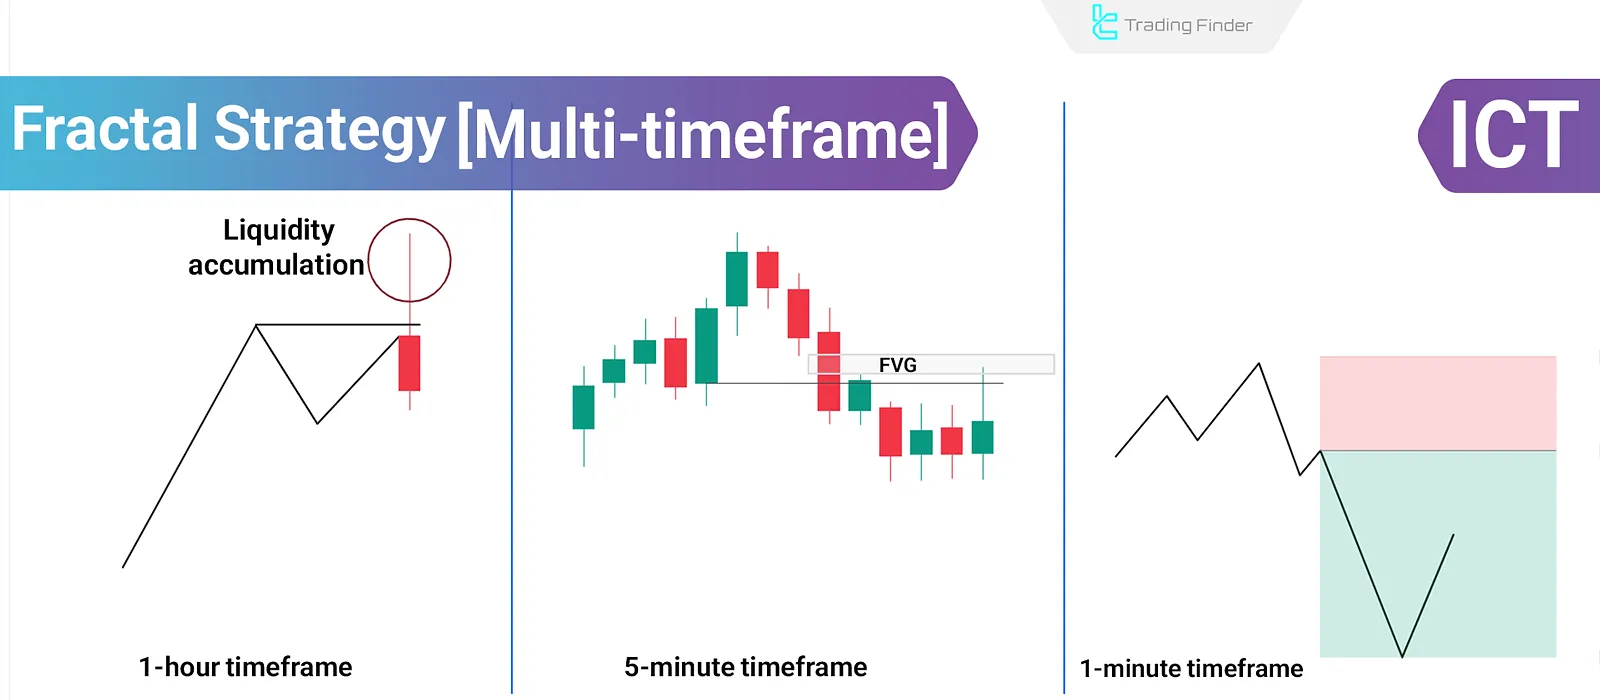
The Fractal model in ICT style is a method for aligning price structure across timeframes and entering reactive market zones.
This model identifies a price structure Inversion by analyzing higher timeframe candles for directional bias, confirming structure on the mid timeframe, and entering on the lower timeframe.
The T-Spot, or entry zone, is where the wick of the higher timeframe candle is expected to form.
What Is the Fractal and Inversion Strategy in ICT Style?
The Fractal and Inversion Strategy in ICT style is a multi-timeframe approach for analysis, confirmation, and market entry.
In this model, the price movement structure is repeated across timeframes, and by aligning their direction, traders can find high-probability, low-risk entries.
Process of Applying the Fractal Strategy:
- Identifying Reversal Zone on Higher Timeframe: Begin with a higher timeframe like 1H or Daily to find potential price reversal zones. These areas are typically identified after liquidity is collected and candlestick rejections are observed;
- Receiving Structural Confirmation on Mid Timeframe: Next, confirm the price structure on a mid-timeframe (like 5M) to validate potential entry;
- Entry on Lower Timeframe: Finally, enter the trade on a lower timeframe such as 1M once price exhibits a valid structural Inversion or confirmed reversal in the predefined zone.
High Timeframe Analysis in Fractal and Inversion
In the Fractal model, the initial market bias is determined from higher timeframes such as 1H.
This step forms the foundation for lower timeframe decisions, as entries without a confirmed higher timeframe direction are baseless. Three Primary Methods for Identifying Bias:
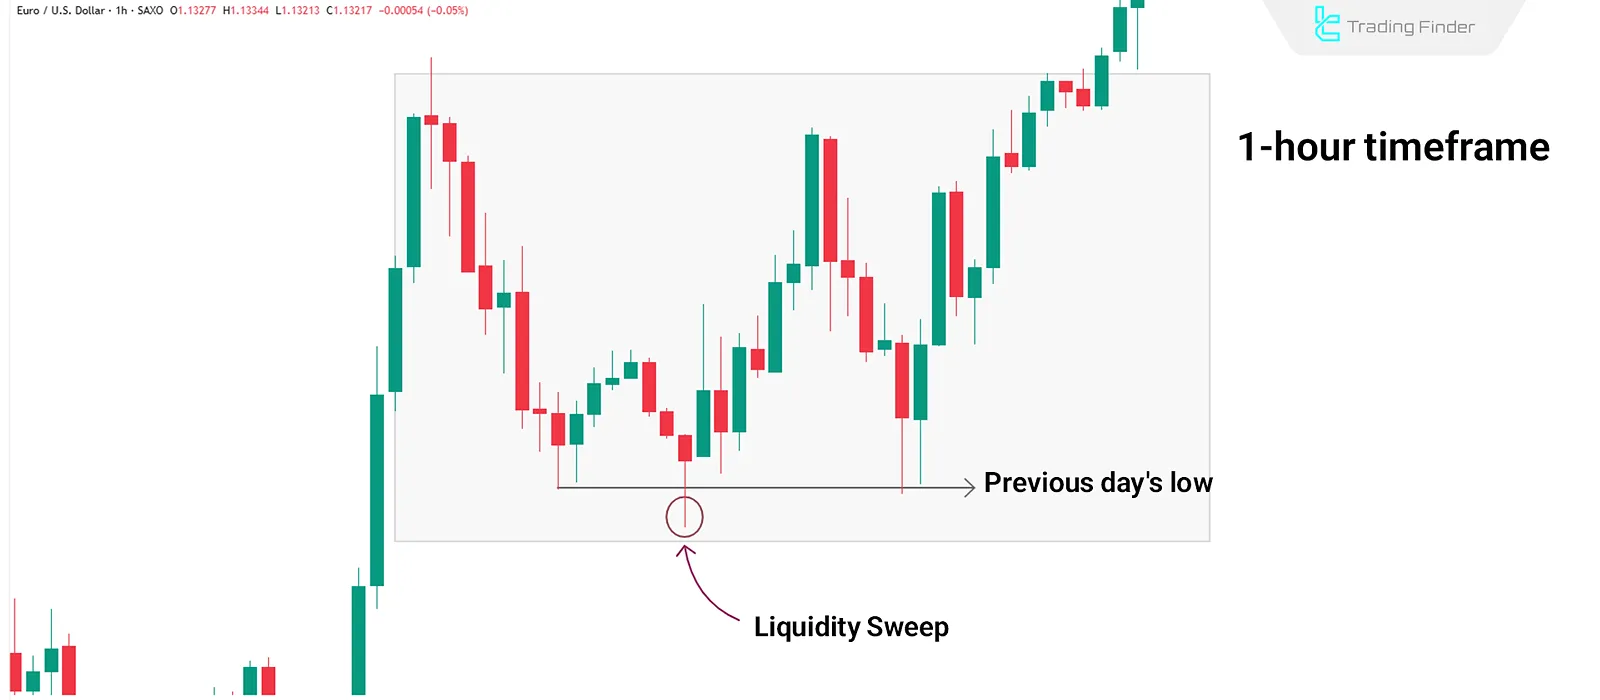
Liquidity Sweep
A quick break and rejection of a major high or low in the higher timeframe suggests smart money activity.
For example, if the candle breaks the previous day's high but fails to hold and closesbelow it, this may signal the end of the bullish move.
Rejection
After sweeping liquidity, a confirmedpricerejection from the liquidity zone is needed, usually shown by a close in the opposite direction (e.g., a bearish close after a high sweep).
Change in State of Delivery
Look for a behavior shift, often identified by a strong close that surpasses previous candles (e.g., a strong bearish candle breaking past prior bullish candles).
Confirming Structure in Mid Timeframe (e.g., 5-Minute)
After determining the higher timeframe bias, it's critical to get a structural confirmation in the mid-frame (e.g., 5M). Without a reversal structure here, the entry on lower timeframes lacks validity.
What Does Breaking Up Close or Down Close Candles Mean?
In ICT's Fractal model, structural change confirmation often requires breaking through a set of defined candles that reflect the previous trend:
- Up Close Candles: Bullish candles closing above the open price;
- Down Close Candles: Bearish candles closing below the open price.
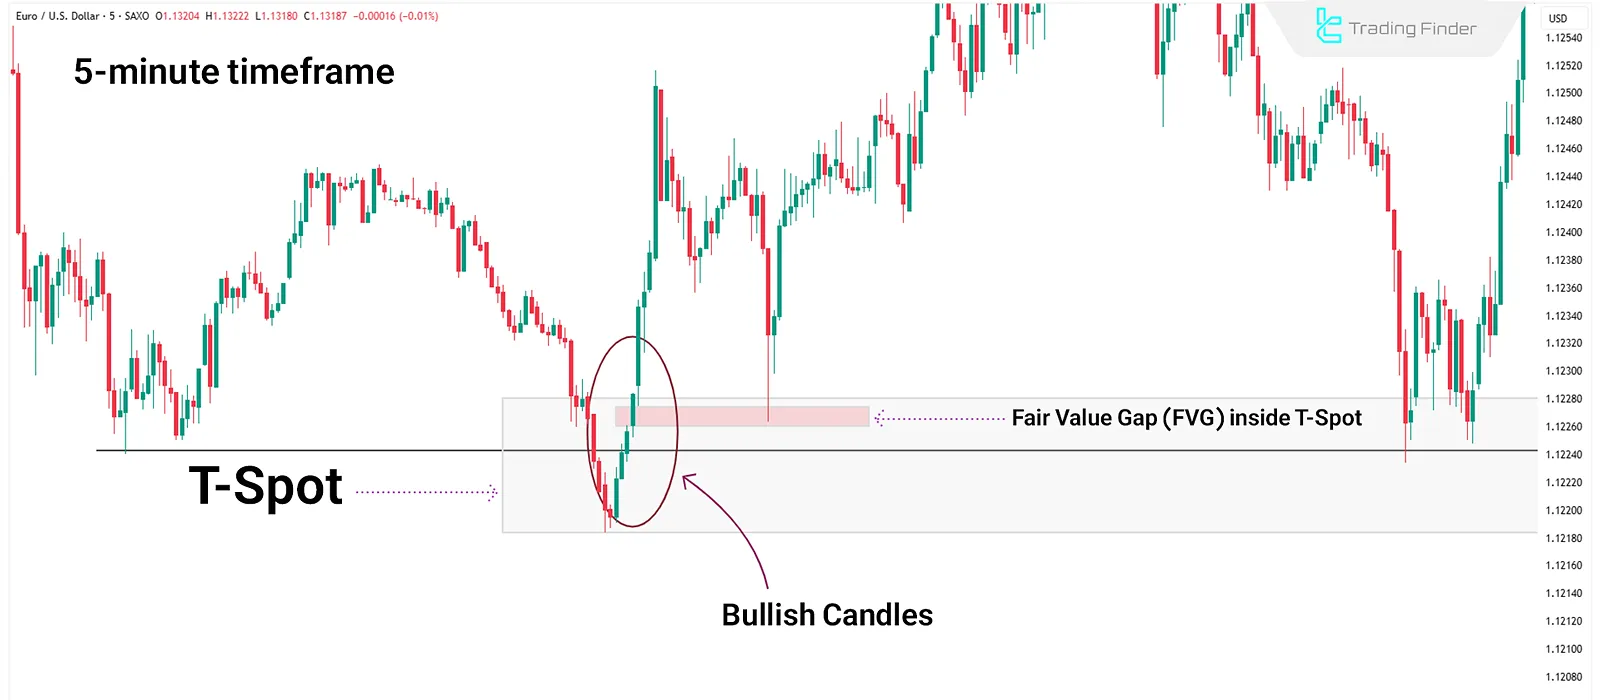
Defining the T-Spot Zone
The T-Spot is the expected wick formation area of the higher timeframe candle. It is the only valid entry zone, determined after establishing bias and structural confirmation on the mid-time frame (e.g., 5M).
T-Spot becomes valid when the price breaks through several bullish or bearish candles and forms areas like Fair Value Gap (FVG) or Order Block (OB) in the middle of that break.
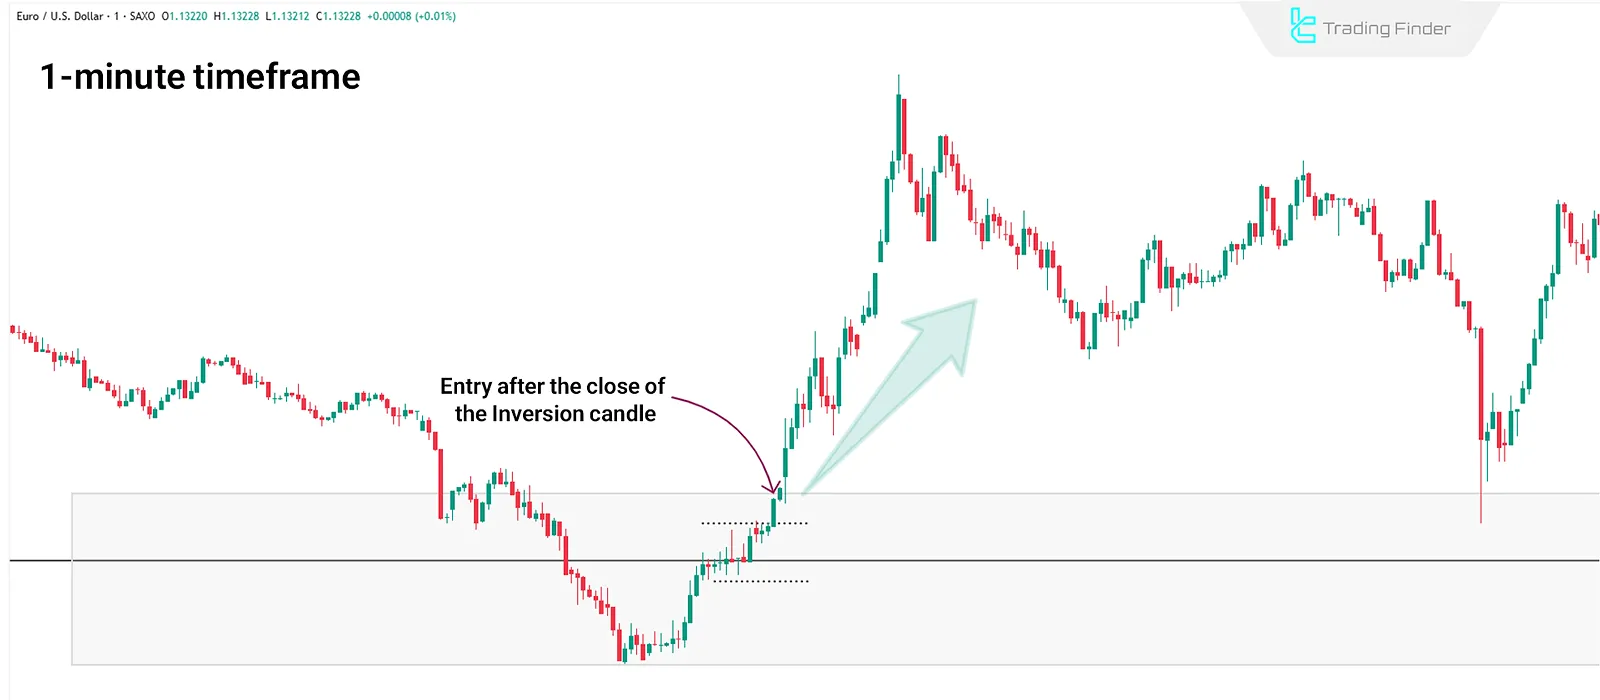
Entry Using Fractal and Inversion on Lower Timeframe (1-Minute)
After identifying bias on the high timeframe and confirming structure on the mid timeframe, entry is valid only if a confirmed Inversion appears in the T-Spot on the 1-minute chart.
This is the ideal point for entry with tightstop-loss and highR:R.
Entry Types in Fractal Strategy
After the appearance of the "Inversion," two types of entries are possible in the Fractal Strategy:
- Close Entry: After the Inversion candle closes and confirms the signal;
- Retest Entry: Upon price retesting the broken level, allowing for tighter SL and better R:R.
The choice depends on price behavior, T-Spot positioning, and distance to the target.
Stop Placement in Fractal Strategy
Stops must always be set beyond the Inversion level:
- Longs: Below the last wick low
- Shorts: Above the last wick high
What's the Difference Between Inversion and Breakout?
Inversion means a confirmed price reversal from a specific zone, where the price first breaks a level (like a short-term high/low) and then immediately returns and closes in the opposite direction.
Unlike a breakout, which is merely a level break, Inversion includes breach, return, and close in the opposite direction—indicating a real market reversal and not just a liquidity sweep.
Conclusion
The Fractal model in ICT style aligns timeframes for reactive entries. First, identify directional bias in the higher timeframe through liquidity collection and rejection. Then, confirm a structural shift in the mid-time frame by breaking prior candles.
Entry is only valid when the price shows a confirmed Inversion within T-Spot on the 1-minute chart. This strategy allows for precision entries, tight stops, and better risk control.


