


The Interbank Price Delivery Algorithm or IPDA is one of the liquidity concepts in the ICT style. This concept refers to the rules that determine the price in the market.
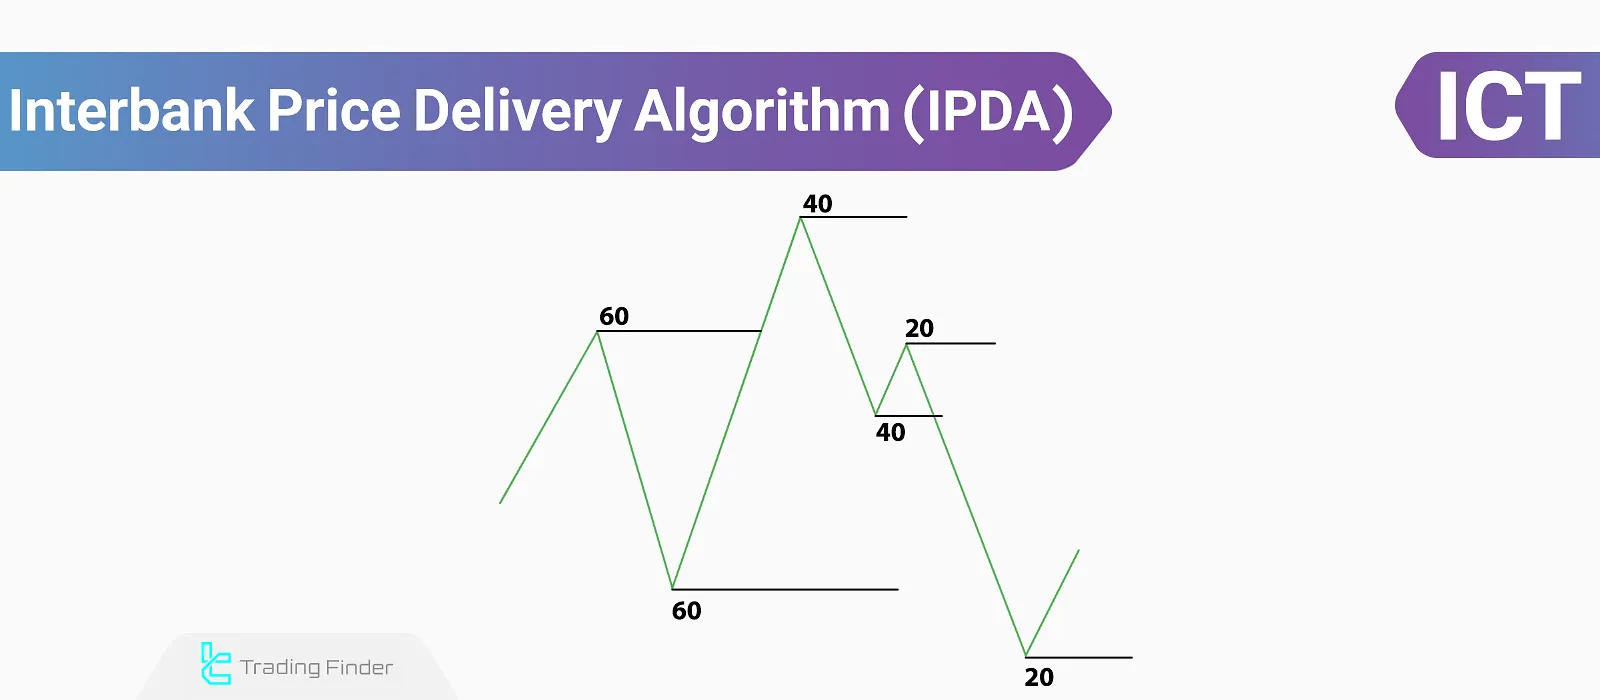
The Interbank Price Delivery Algorithm (IPDA) is presented over three time periods [20-day, 40-day, and 60-day] with 20-day intervals. The highs and lows formed in these periods represent liquidity accumulation zones, where Smart money alters the market to reach them.
What is the Interbank Price Delivery Algorithm (ICT IPDA)?
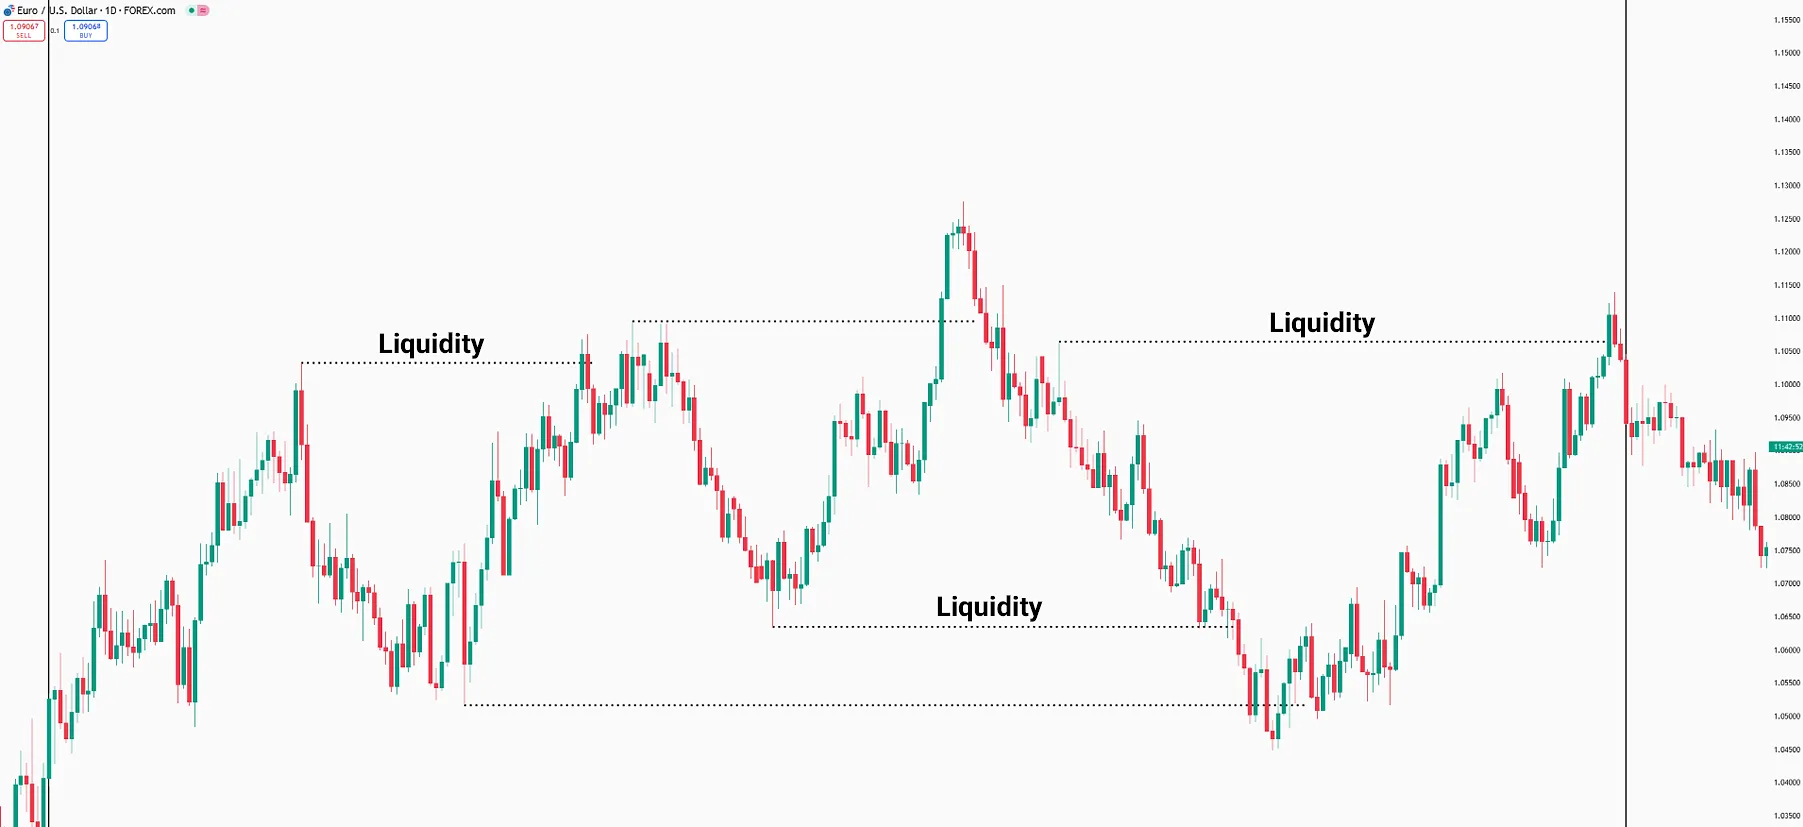
According to the ICT style, price movement in the instrumets like Forex market occurs due to the presence of liquidity or imbalance zones.
In this context, The price moves towards liquidity, and once gathered, it proceeds to balance the imbalance.
Market movement begins toward a liquidity zone once the imbalance is balanced by price. This cycle continuously and consistently occurs in financial markets.
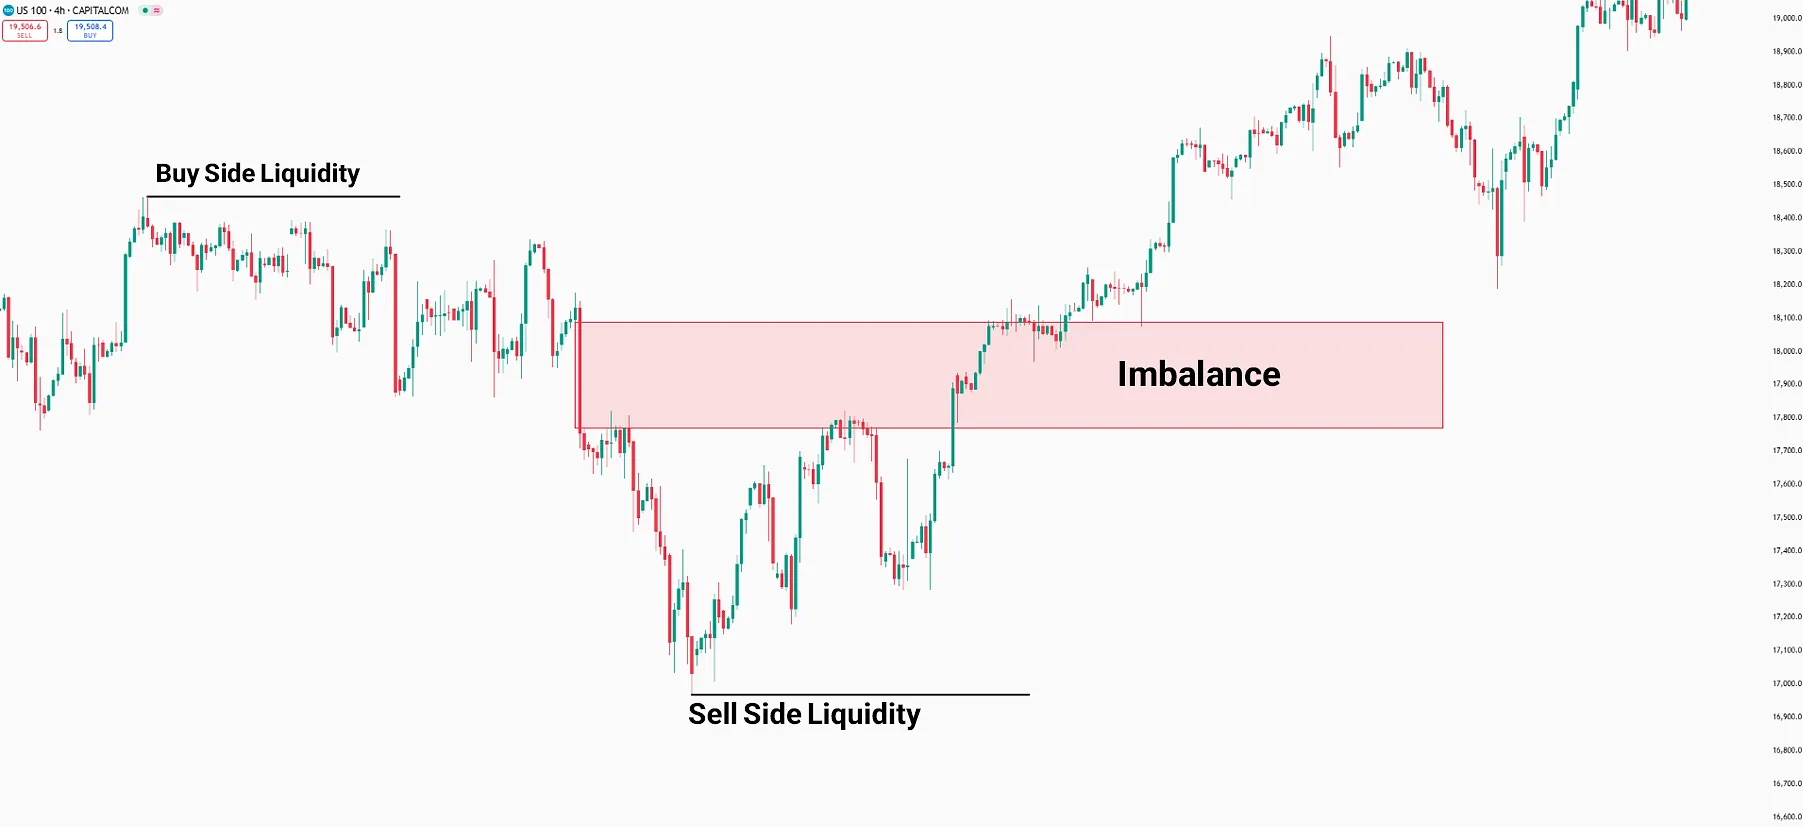
In the diagram below, the price first gathers Buy Side Liquidity, then balances the imbalance and proceeds towards the Sell Side Liquidity.
The IPDA concept discusses how price is determined by Smart money. Therefore, price is not chosen randomly but is governed by the rules of Market Makers
These rules generally refer to liquidity accumulation and imbalance adjustment. At specific time intervals, key points on higher timeframes are used by smart money to determine and adjust prices.
This concept is fully explained in the article IPDA ICT training on the Writo Finance website, where the details of how the interbank price delivery algorithm works are also covered.
This algorithm, known in the ict ipda style, is one of the main foundations for understanding price movement within the interbank market framework. Traders use it to analyze price behavior precisely over specific time periods.
In this image, a part of the logic behind the price delivery algorithm is illustrated through visual training.
Definition and Application of SIBI and BISI Zones
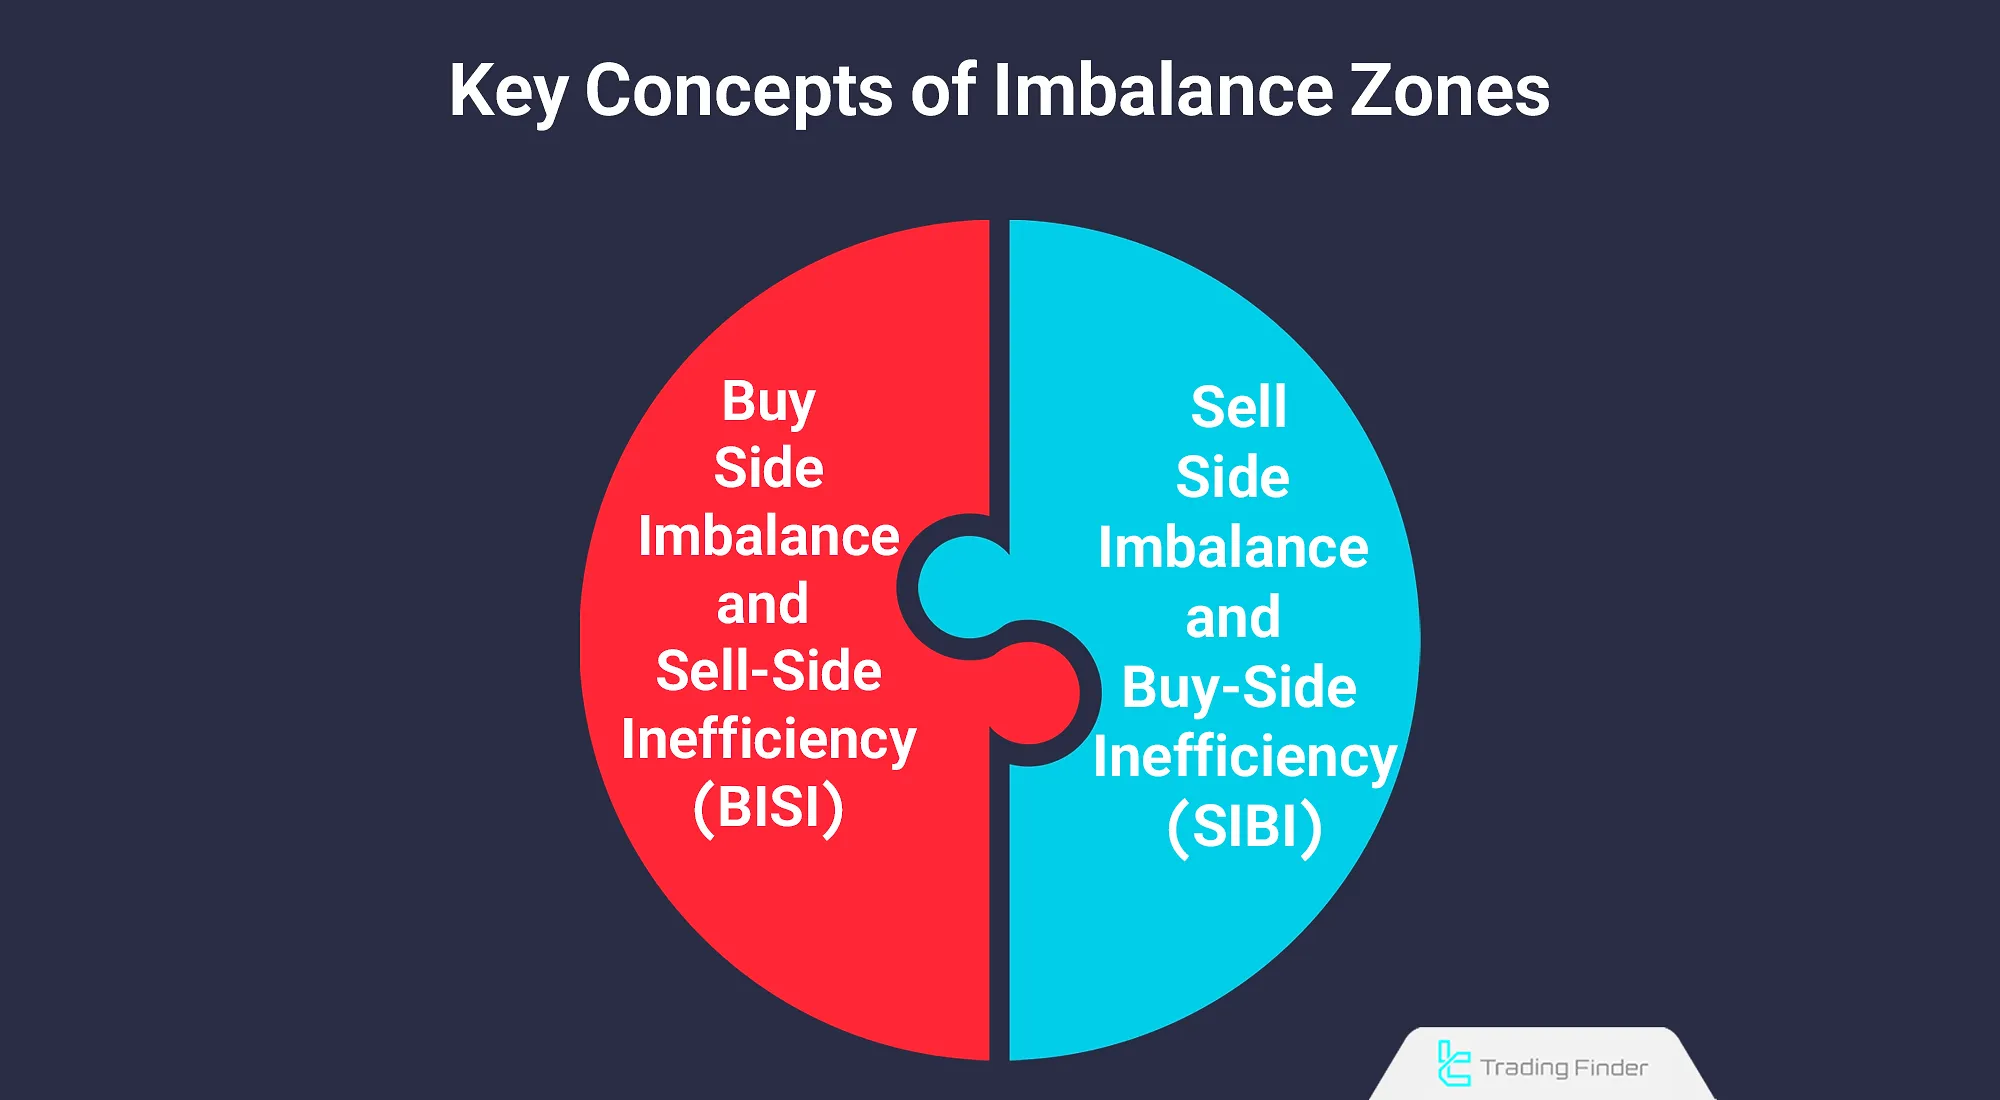
In the structure of ipda in trading, imbalance zones are defined by two key concepts:
- Sell-side Imbalance and Buy-side Inefficiency (SIBI): A zone where selling pressure dominates buying activity, creating gaps between candles;
- Buy-side Imbalance and Sell-side Inefficiency (BISI): An area where demand has increased, and the market may return to it to restore balance. Correct identification of these zones allows for a more precise understanding of price behavior between liquidity and imbalance.
How does the Interbank Price Delivery Algorithm (IPDA) work?
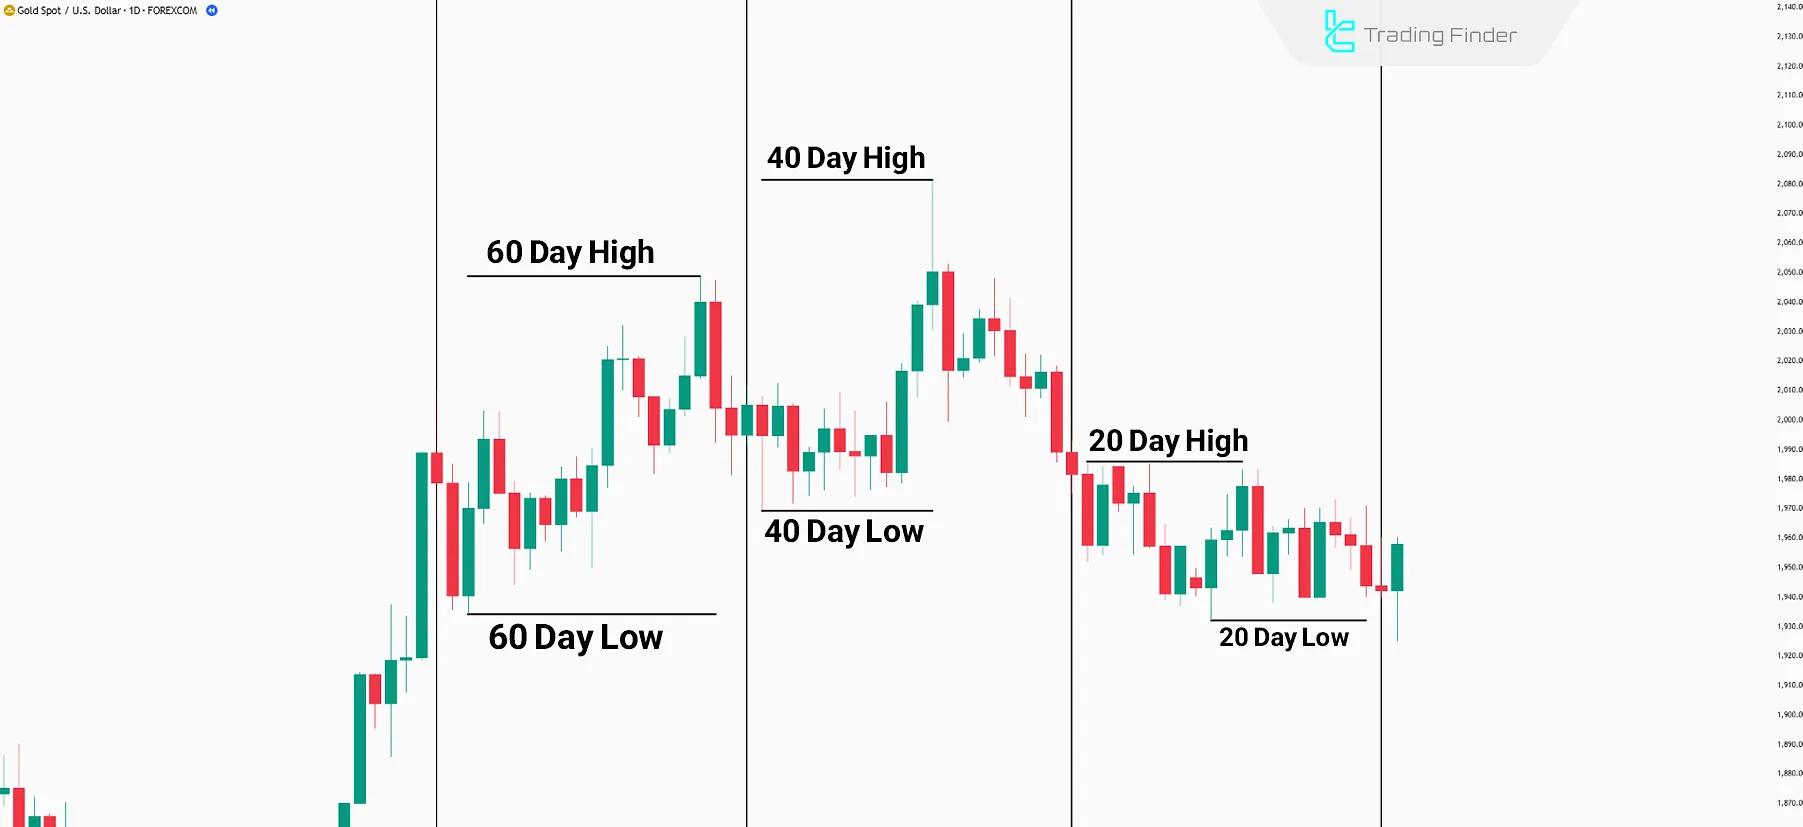
Smart money uses specific key levels to collect the necessary liquidity for price determination. In the IPDA approach, starting from the beginning of the month, it look back three times at 20-day intervals.
Identifying Key Levels for Liquidity Collection
the most recent 20 days, then the 40-day interval, and finally, the 60-day interval. Thus, three 20-day ranges are defined, where the highs and lows of each range represent critical liquidity accumulation areas.
Analytical Example of the Interbank Price Delivery Algorithm
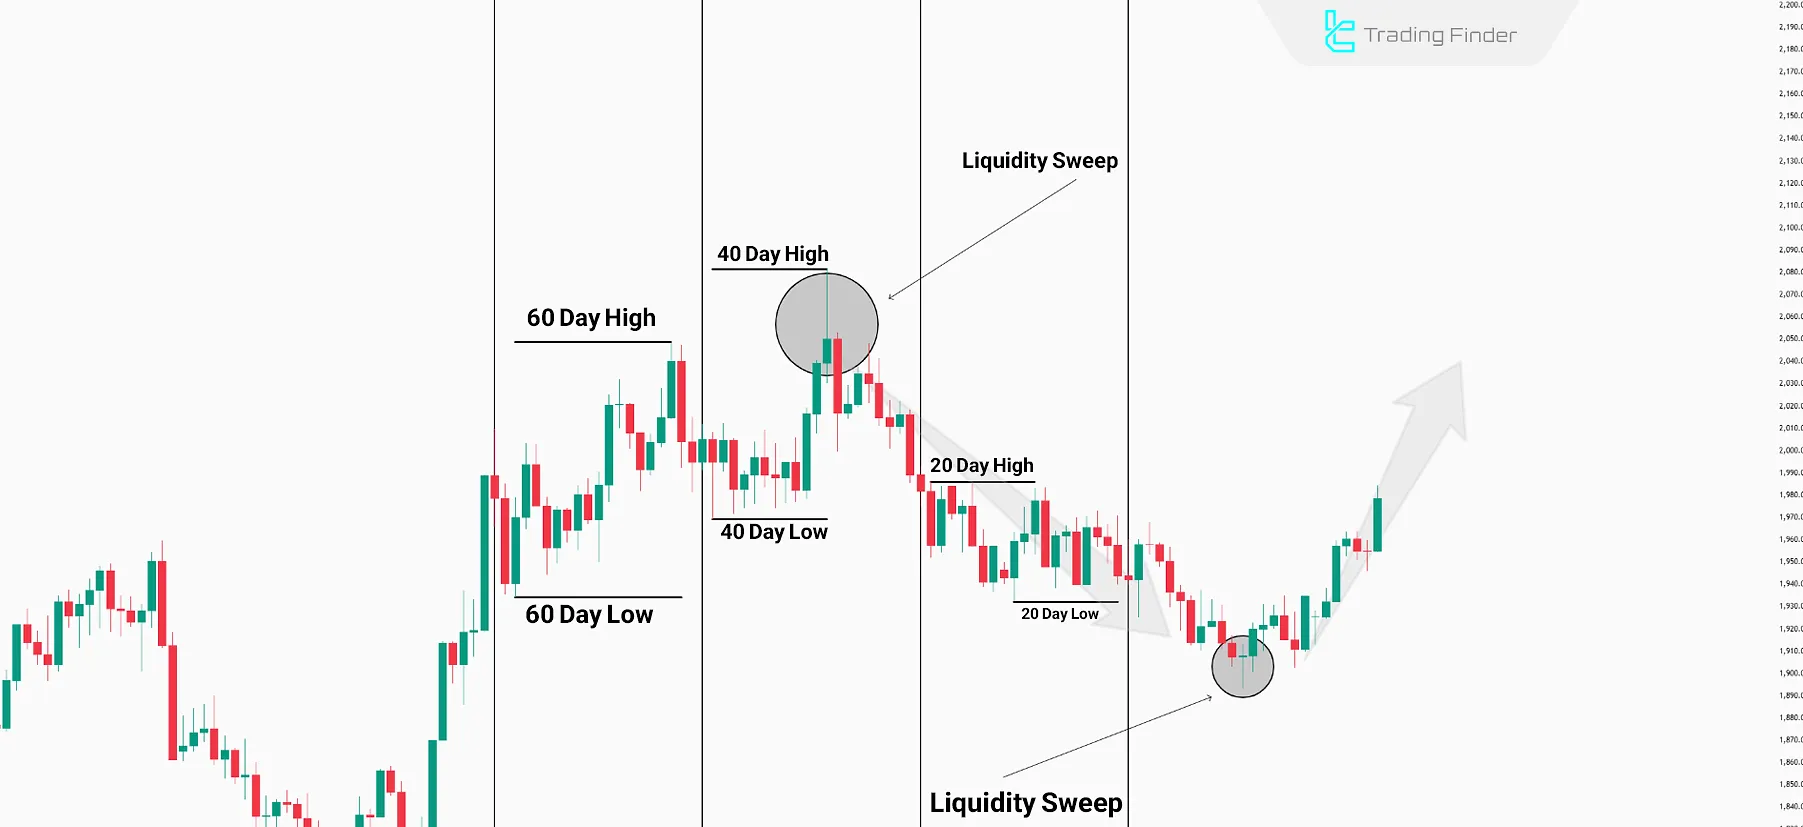
In the EURUSD chart, the sequence of price movements clearly illustrates the logic of the Interbank Price Delivery Algorithm (IPDA).
In the EURUSD chart, the sequence of movements effectively demonstrates the logic of the interbank algorithm and the behavior of the interbank price delivery algorithm (ipda forex).
Initially, the market completes its bullish phase by collecting liquidity above the 40-day high. After this Liquidity Sweep, the direction shifts toward lower lows. During the bearish leg, the price absorbs the liquidity at the 60-day low, triggering a notable bullish reaction from that area.
The marked movements in the image indicate that the market constantly oscillates between two primary poles: Liquidity and Imbalance.
Each time liquidity on one side is consumed, the market’s next target is often located on the opposite side. This logic, within the ipda trading strategy, forms the foundation of analyzing the relationship between liquidity and market balance.
Trading Strategy with 20, 40, and 60-Day Cycles
The 20-, 40-, and 60-day cycles form the core of ipda forex ict analysis:
- When the 20-day high or low is broken, the probability of a price reversal from that range increases;
- In the 40-day cycle, the market typically seeks to rebalance between consumed liquidity zones;
- And the 60-day cycle usually indicates a medium-term market reversal, known as ipda market cycles.
Understanding the connection between these cycles clarifies the pathway between liquidity and imbalance and helps traders experience the concept of ipda meaning in trading in practice.
What Is the Reference for IPDA Cycles?
Before exploring the algorithm’s details, understanding the differences between the 20-, 40-, and 60-day cycles is crucial. Each of these cycles represents a specific type of liquidity and reacts differently to market imbalance.
The table below summarizes the time structure of price delivery ict and the dominant liquidity type in each period, helping traders assess the probable direction of price movement with greater precision.
Time Cycle | Dominant Liquidity Type | Probable Market Behavior |
20-day | Internal retail liquidity | Quick and corrective reaction |
40-day | Intermediate liquidity | Pullback or short-term bias shift |
60-day | Structural liquidity | Start or end of a major price movement phase |
The time structure table of IPDA cycles reflects the nature of ipda cycle ict, which is widely used in ict pda analysis.
Kill Zones and Optimal Trade Entry (OTE)
In ipda trading analysis, Kill Zones are specific time windows where traders expect price reactions or reversals to occur. Periods such as London Open, New York Open, and New York Close contain the highest liquidity overlap.
Combining these zones with the OTE (Optimal Trade Entry) pattern helps traders select entries with minimal risk and the best reward-to-risk ratio. This concept is among the most important applications of ict price delivery in the market and, together with ipda in trading, helps optimize trade entries.
In charts based on the interbank price delivery algorithm, time windows such as London Open and New York Close show the highest liquidity concentration; combining them with OTE forms the foundation of ipda forex ict strategies.
Daily and Weekly Bias in the IPDA Structure
Daily and weekly bias within the ipda algorithm determine the primary direction of price movement.
When the bias is bullish, focusing on liquidity above previous highs is more logical, while in a bearish bias, previous lows become more important.
The concept of daily bias is explained in a video on the TTrades YouTube channel:
In daily analysis, the price position relative to the 20-, 40-, and 60-day ranges serves as the criterion for identifying bias.
Bias not only shows the general direction of the market but also reveals potential reaction zones. For this reason, the concept holds particular significance in ipda smc and the Smart Money Concepts framework.
Within the framework of the interbank price delivery algorithm, the price position relative to time cycles determines the daily bias path and plays a key role in ipda trading strategy analysis.
What are IPDA Seasonal Shifts?
Another important concept for understanding the Interbank Price Delivery Algorithm (IPDA) is recognizing the seasonal shifts in higher timeframes.
These shifts occur every 3 to 4 months; hence, they are referred to as seasonal or quarterly shifts.
This approach relates to the changes made by smart money or market makers. In other words, price movement is not random and constantly rotates between Internal Liquidity Range (IRL) and External Liquidity Range (ERL).
Using Futures Market Data in IPDA Analysis
Futures market data, especially trading volume and open interest, can confirm phase shifts in ipda forex. A sharp rise in open interest near key liquidity zones strengthens the likelihood of a trend reversal. When combined with the medium-term bias and the 40- and 60-day cycles, these data points provide a more precise picture of liquidity behavior.
In ipda market cycles analysis, using futures trading volume and open interest data enhances the understanding of ict ipda phases.
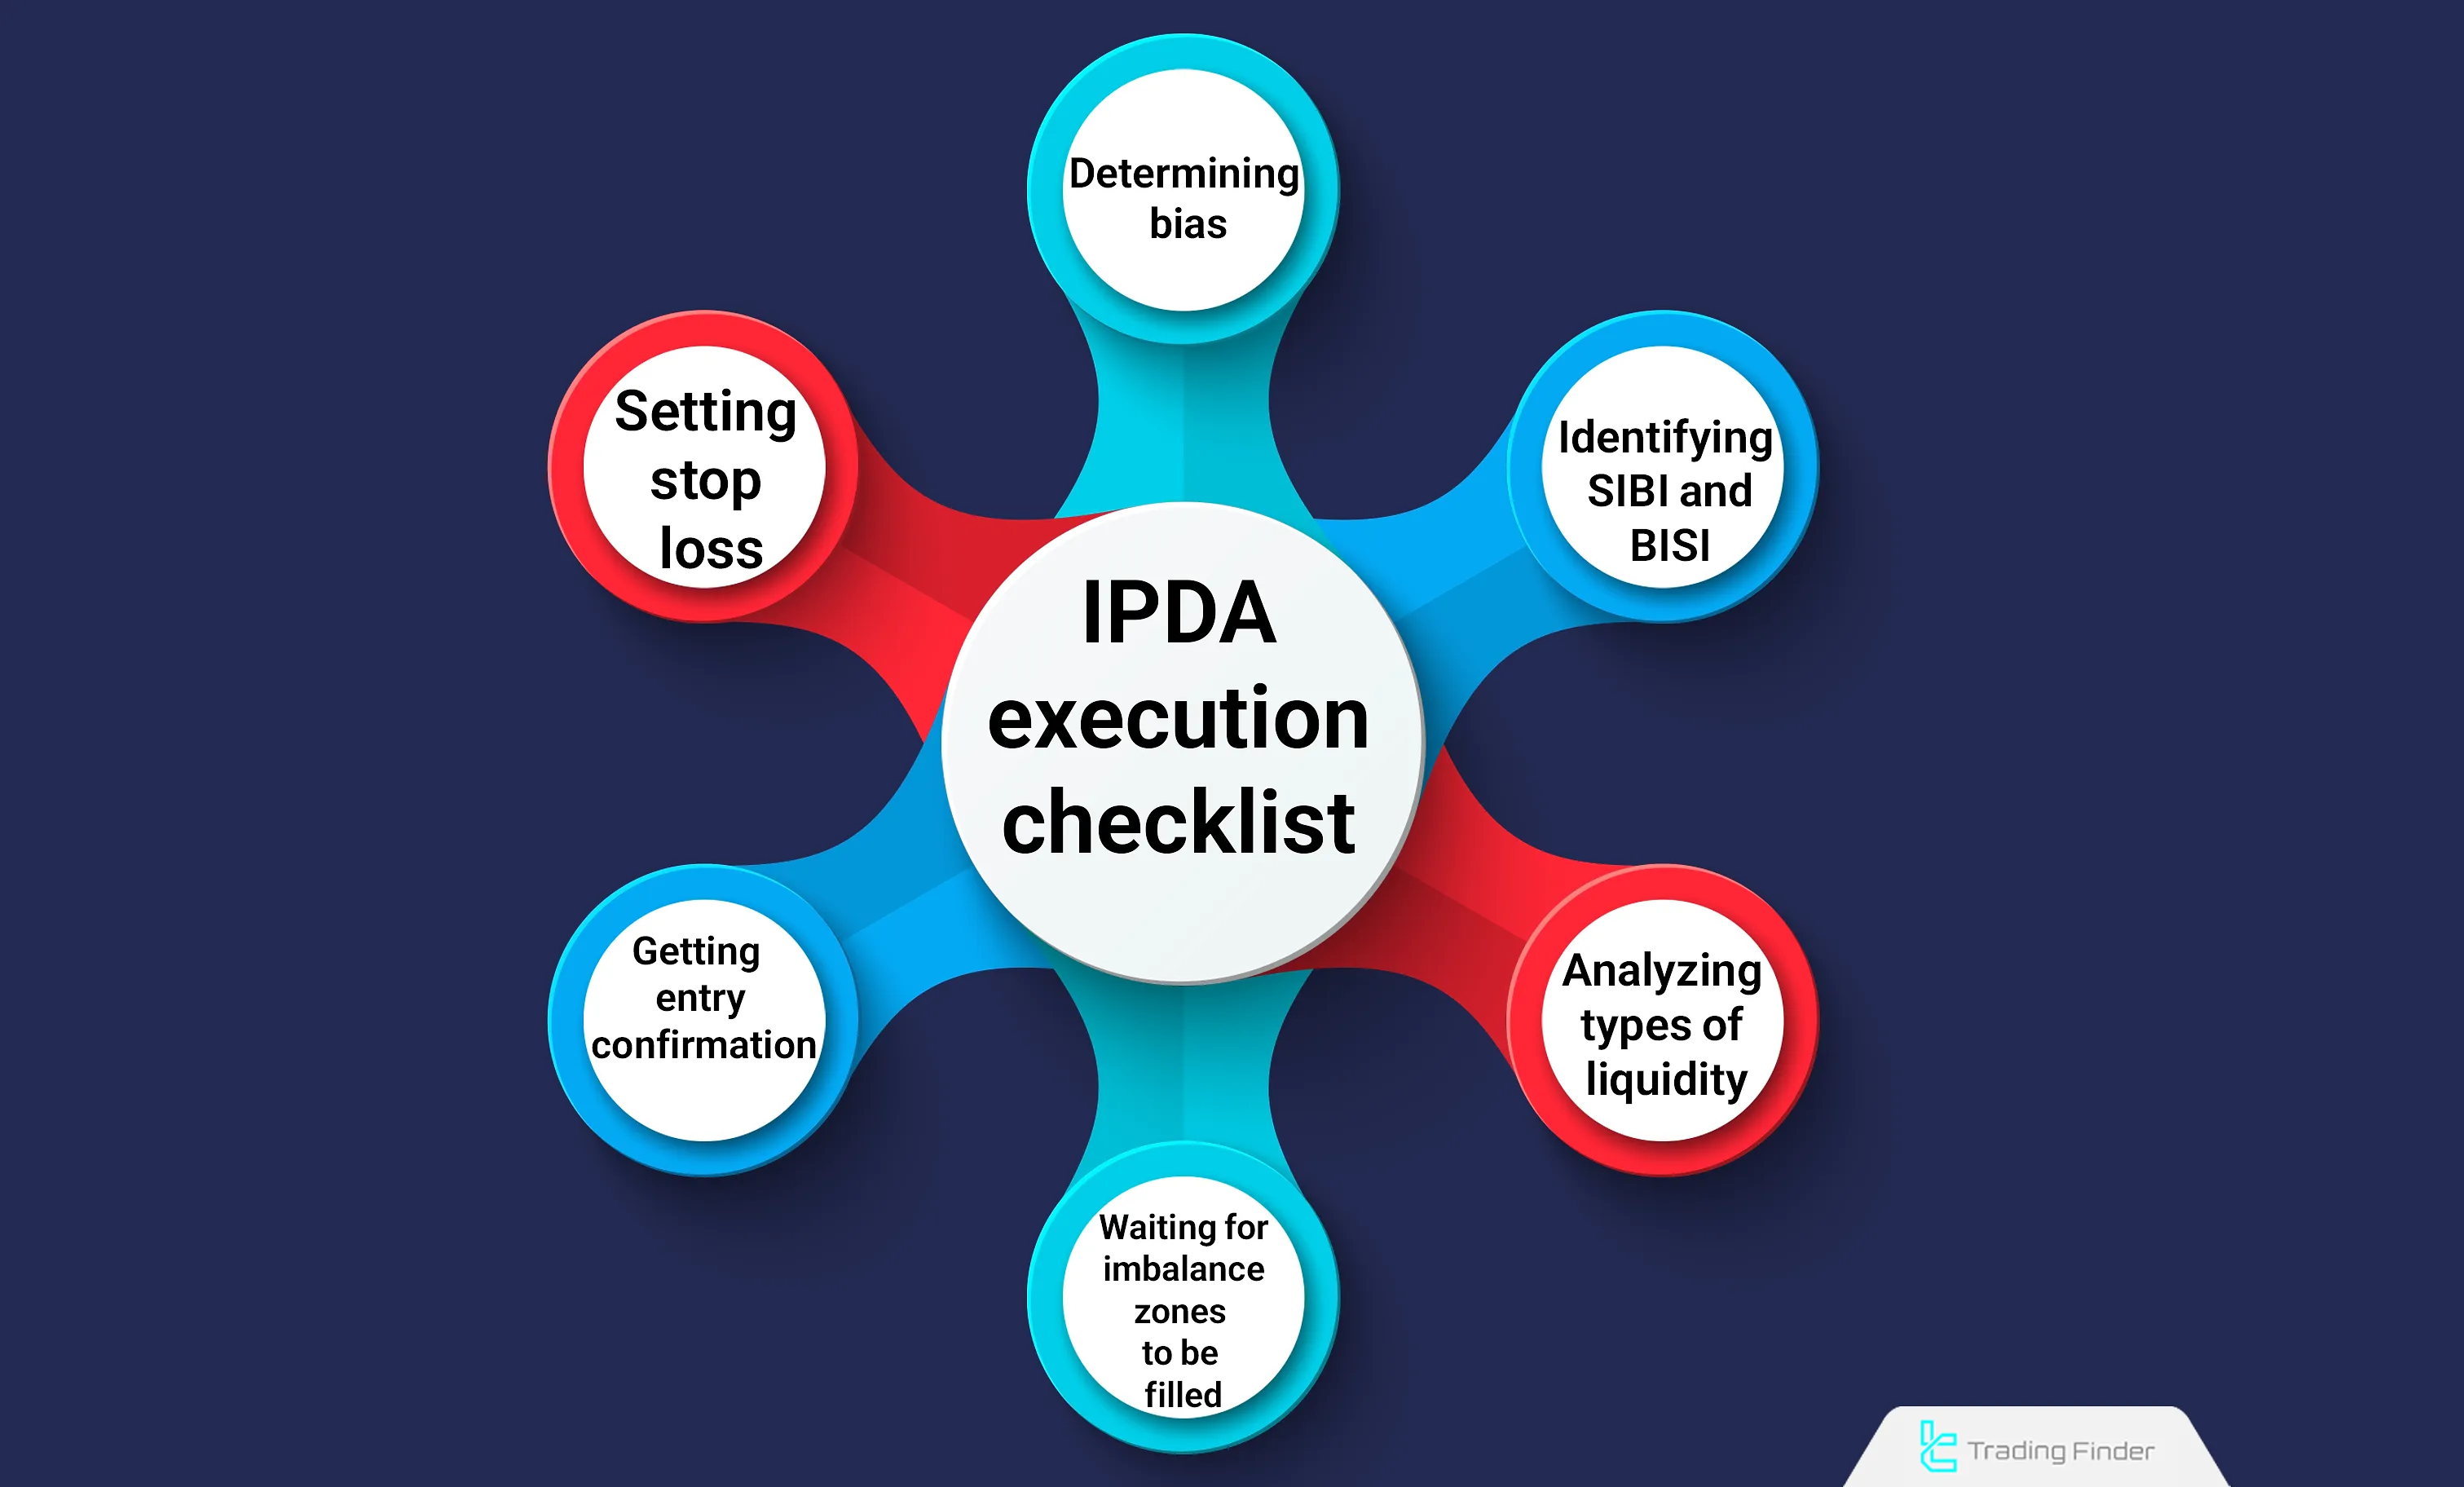
IPDA Algorithm Execution Checklist
This checklist enables traders to practically apply the interbank price delivery algorithm in real market conditions, helping them accurately identify key ipda forex ict structures on the chart.
- Determine daily and weekly bias based on the price position within 20, 40, and 60-day ranges;
- Identify active SIBI and BISI zones;
- Examine internal and external liquidity;
- Wait for liquidity consumption or imbalance fill;
- Confirm entry within Kill Zones upon signs of market structure shift;
- Place the stop loss behind unconsumed liquidity areas.
Practical Notes and Warnings
The IPDA algorithm serves as a framework for understanding price destinations, not a tool for guaranteed prediction. While combining it with risk management principles and precise bias can enhance trading performance, no model is infallible.
Discipline, emotional control, and adherence to the trading checklist are integral to the proper execution of the ipda trading strategy.
Liquidity Finder Indicator
The Liquidity Finder (LF) indicator is a specialized tool for traders of ICT and Smart Money Concepts (SMC) styles, designed based on price delivery ict logic. Through its analytical algorithms, it automatically detects liquidity levels.
This indicator plots Dynamic Liquidity Lines and Static Liquidity Lines to highlight order clusters and liquidity absorption points. In default settings, blue lines represent high liquidity and red lines indicate low liquidity.
In the 4-hour gold (XAUUSD) chart, the LF indicator identified the high liquidity zone at 2306.93. After collecting liquidity from the lows, the market completed its corrective move and entered a new bullish phase at 2335.69. In the 1-hour USD/CHF chart, the indicator accurately pinpointed liquidity cluster points near structural lows and signaled the probable market direction before the Break of Structure.
The LF indicator is designed according to the ipda algorithm principles and, using the interbank price delivery algorithm logic, tracks liquidity flow across timeframes from M1 to H4.
Users can adjust line sensitivity in Static and Dynamic modes and modify how upper and lower liquidity lines are displayed according to their strategy. Parameters such as Liquidity Line Sensitivity, Period Pivot, line colors, and graphical style are among the key customizable settings.
This flexibility makes the LF indicator highly effective for ipda smc analysis and for understanding liquidity flow across various markets.
Overall, Liquidity Finder is a powerful analytical tool for understanding liquidity behavior, identifying hidden market orders, and analyzing liquidity pools with precision. Traders can use it to optimize their trading decisions based on ipda in trading logic and liquidity flow within the ict price delivery framework.
- Download link for TradingFinder Liquidity Finder Indicator for MetaTrader 4
- Download link for TradingFinder Liquidity Finder Indicator for MetaTrader 5
Conclusion
The Interbank Price Delivery Algorithm (IPDA) is a key concept in the ICT style that explains price movements based on liquidity and market rules.
This algorithm analyzes specific periods (20, 40, and 60 days) and identifies highs and lows to determine liquidity accumulation points.
In this model, price movements are not random but are controlled by smart money to collect liquidity and adjust imbalance zones.


