


ICT intraday profiles represent a comprehensiveday trading methodology grounded in the ICT Central Bank Dealers Range (CBDR) andICT Asian range liquidity sweep during the London session.
Understanding these profiles enables traders to identify potential scenarios and improve their trading precision. These profiles include insights intomarket movements at different times and under various conditions.
ICT intraday profiles are considered powerful tools for analyzing the daily market structure and forecasting price behavior across different sessions, especially the London session.
Mastery of these profiles enables the identification of recurring patterns, liquidity zones, and probable price movement scenarios, which in turn improves the accuracy of intraday trade entries and exits.
This analytical approach operates with a focus on timing, volatility, and the manner in which price interacts with key levels, thereby providing a foundation for strategic decision-making for traders.
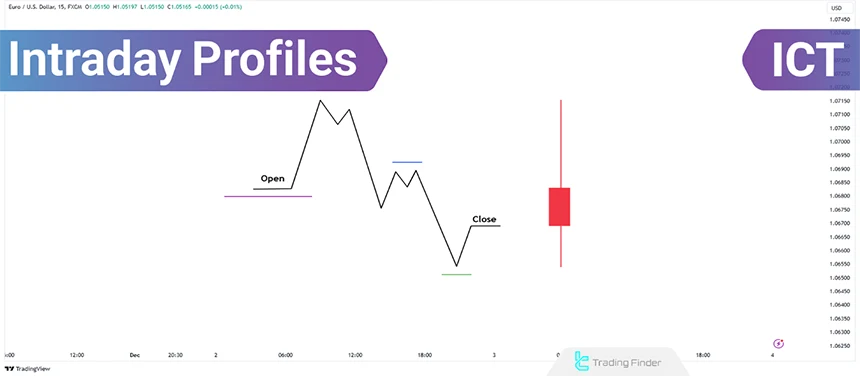
What Are ICT Intraday Profiles?
ICT Intraday Market Profiles focus on analyzing and examining market behavior throughout the day [especially the London session]. These profiles assist traders in identifying recurring patterns and key market levels to make informed decisions.
By using ICT daily profiles, traders can identify optimal entry and exit points and manage their trading risk. These tools are particularly suitable for day traders and for exploiting short-term price fluctuations.
In the educational video on the TTrades channel, more detailed explanations are provided about the ICT London session profile, which interested traders can learn from and apply within their ICT intraday strategy.
Sell Profiles During the London Session
The bearish version of this pattern typically begins like a classic buy or sell setup with a price increase above the opening price, followed by a decline.
As the price rises, a selling entry point is formed, and the price reaches a target in a higher timeframe, such as a bearish order block or an unfilled Fair Value Gap (FVG). It signifies a classic reversal if this occurs during the New York session.
This pattern aims to reach a bullish order block in higher timeframe for a Turtle Soup attack or a closing range.
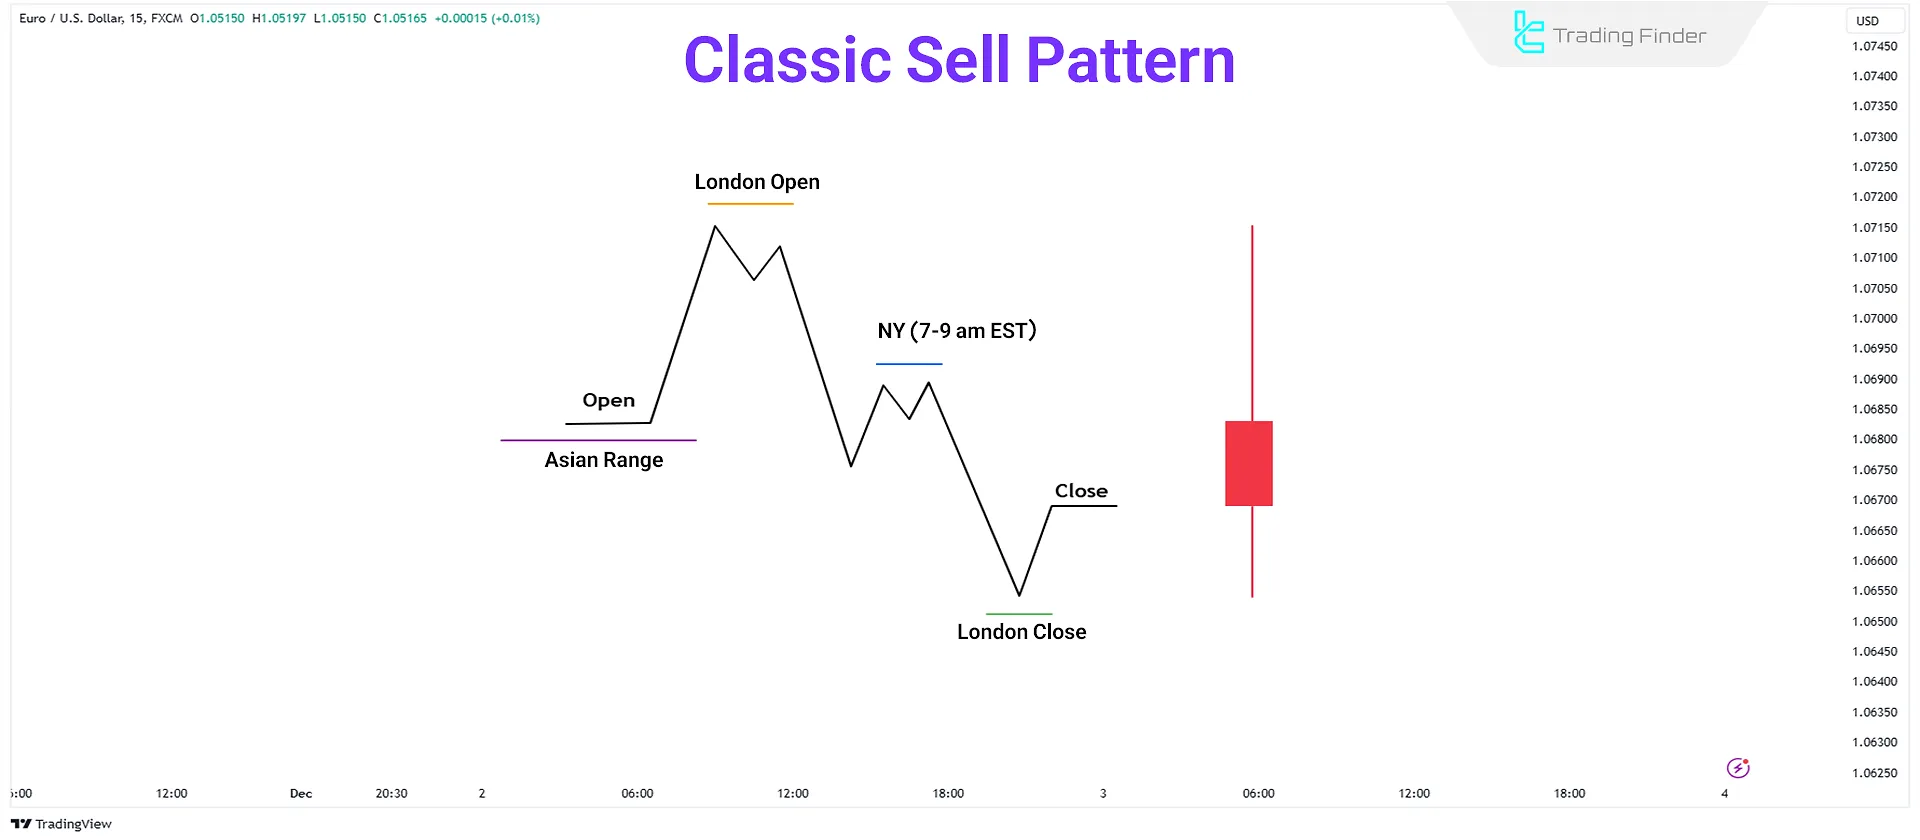
On abearish day, an initial high is formed during the London session, followed by a price decline. It’ll lead to the day’s lowest price during the New York session [around the London close].
Subsequently, the price rises again and retraces the initial high created during the London session. Ideally, this pattern should occur after a market range and align with the prevailing trend on a higher time frame.
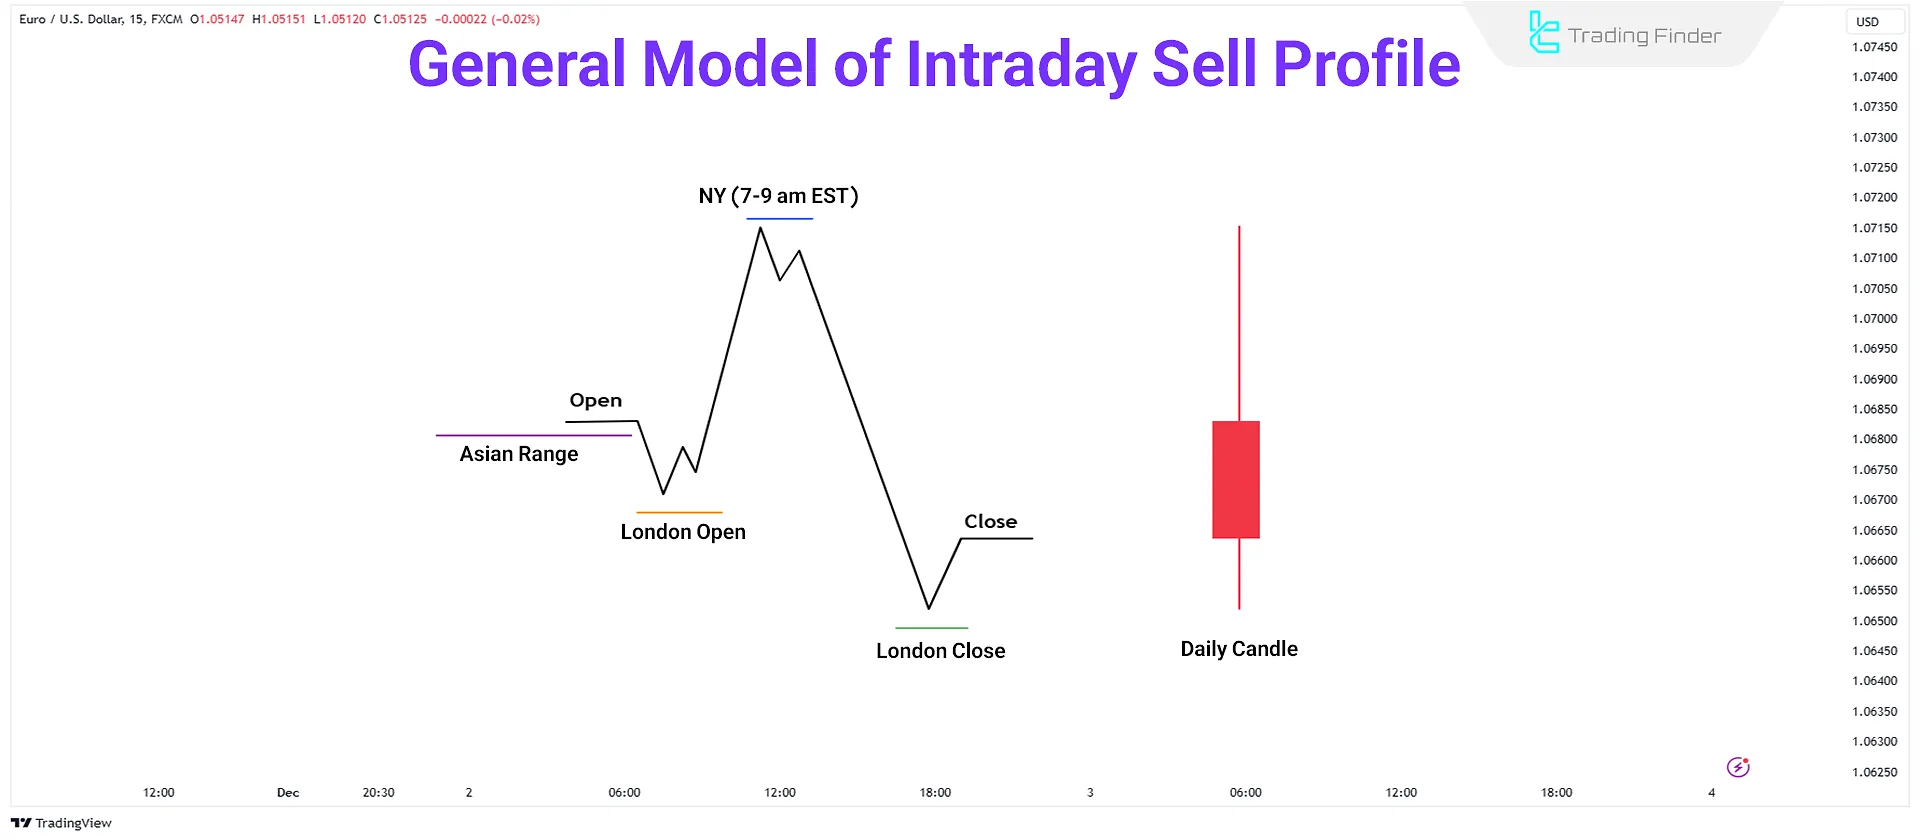
When discussing sell profiles during the London session, there are two main types:
- Normal Sell Profile
- Delayed Sell Profile
Both profiles require a bearish market view but differ in timing and setup criteria.
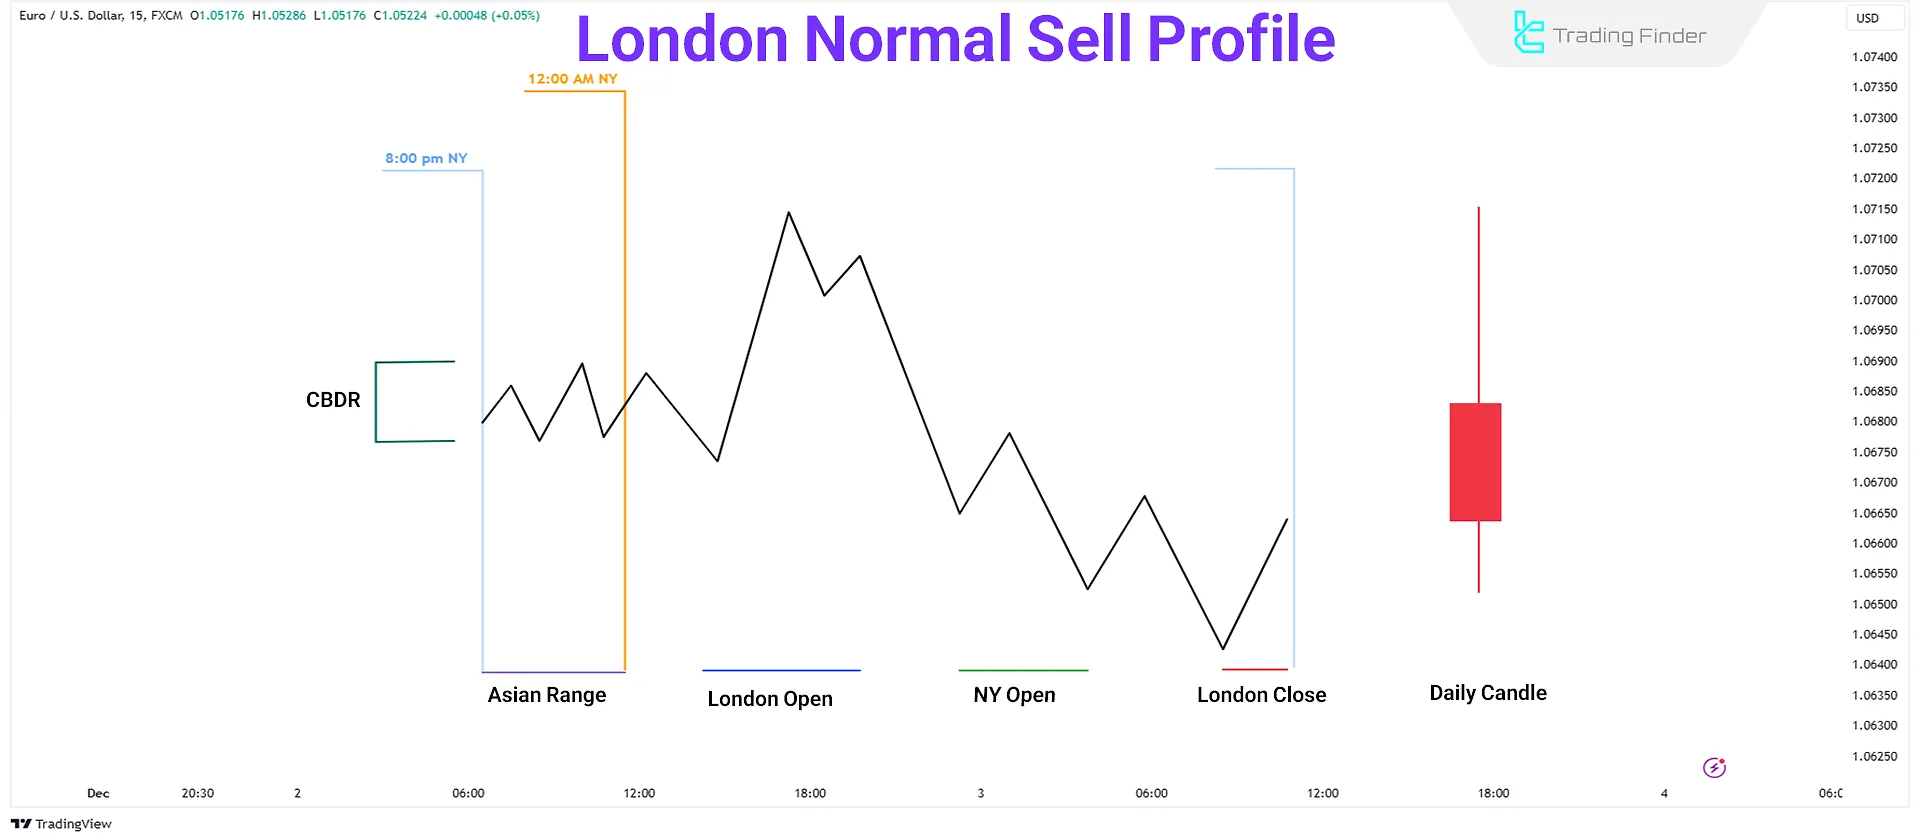
London Normal Protraction Sell Profile
This profile is considered a high-probability sell setup. The criteria for a normal sell in the London session are as follows:
- Central Bank Dealers Range (CBDR): When theCBDR is less than 40 pips, it sets the stage for a classic sell day;
- Asian Session Range: TheAsian session should also maintain a range of 20 to 30 pips to provide suitable conditions for this sell setup;
- Intraday Market Movement: Themarket should rally after midnight New York time and continue until approximately 2 AM;
- Protraction Phase (Judas Swing): The price movement should equal one or two standard deviations of the CBDR range. This deceptive movement, or Judas Swing, involves an initial rally to attract and trap buyers before the market reverses.
Example of a Normal Sell Profile in the London Session
Market consolidates during the Asian session and immediately starts to rally after midnight. It reaches its peak by 2 AM and then begins to decline, providing an ideal setup for sell positions.
Steps for Trading with the London Normal Sell Profile:
- Bearish Bias: Make sure the market trend is bearish today;
- Check All Key Criteria: Verify all the key metrics mentioned above;
- Entry: Look for a price rally immediately after12:00 AM (New York time). A slight downward movement before the rally is acceptable. Entry may occur as early as 1:00 AM or after 2:00 AM;
- Market Structure Shift (MSS): After the price movement in the London session above the CBDR, wait for a Market Structure Shift (MSS) on a lower timeframe (e.g., 5 minutes or less);
- Execution: Place asell trade in the premium zone with a stop loss above the highest point of the London session;
- Take Profit: Target higher timeframe liquidity pools or discount PD Arrays.
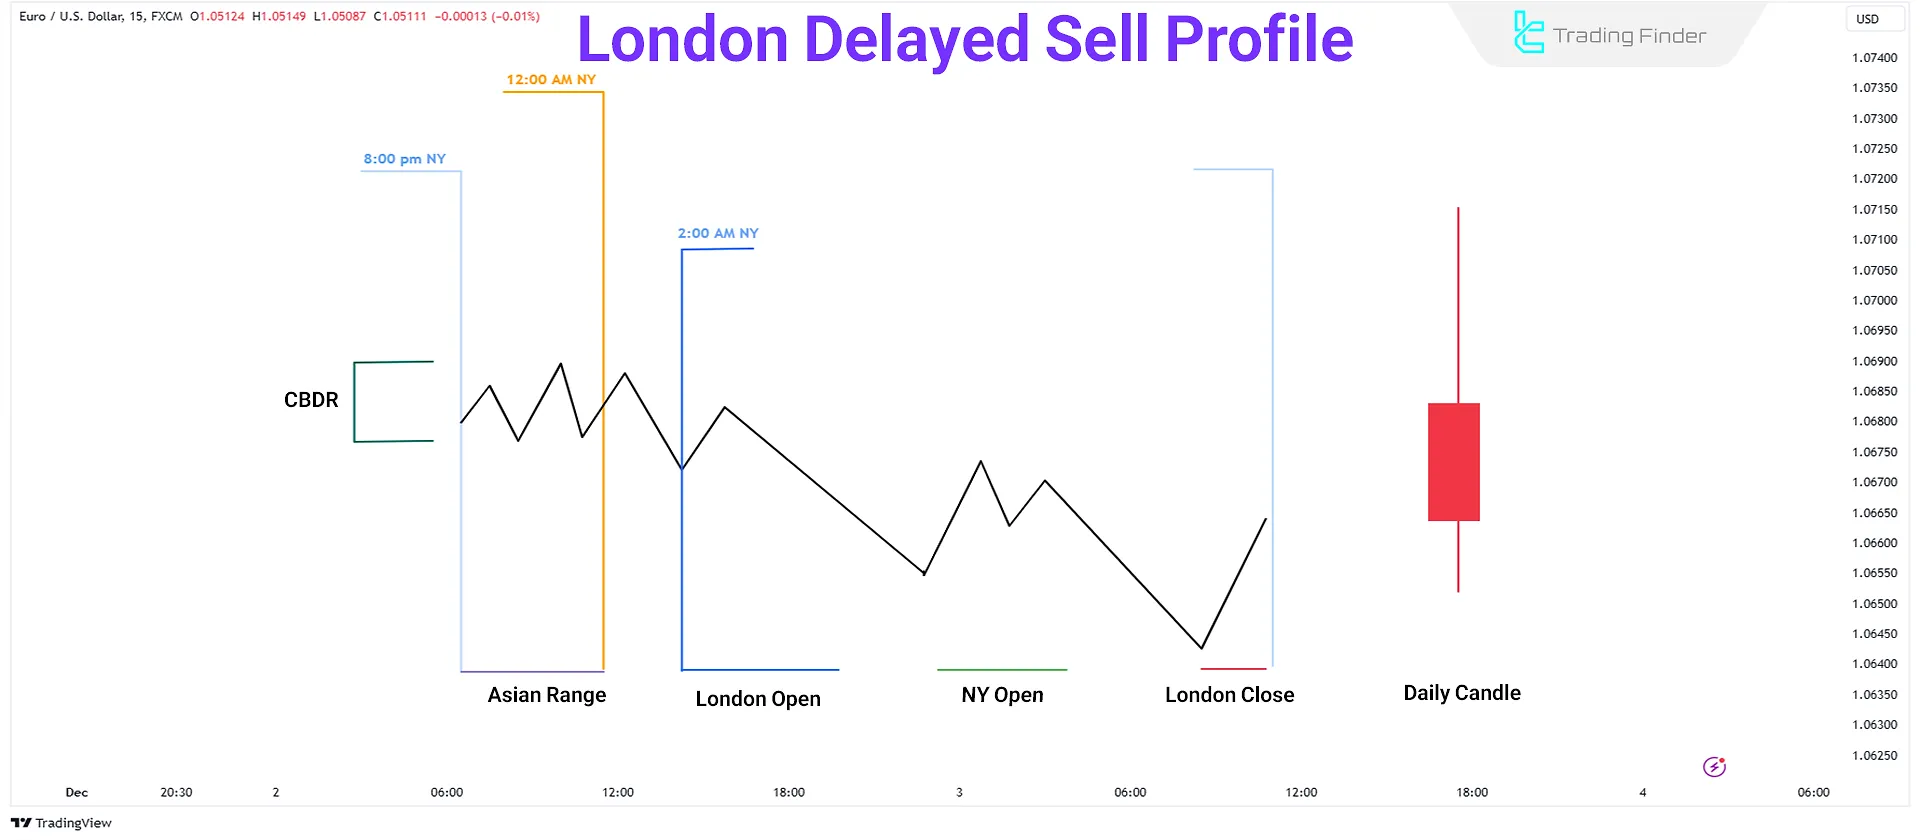
London Delayed Protraction Sell Profile
This profile is applicable when the market does not show a price rally after 12:00 AM (New York time), and the CBDR might exceed 40 pips.
The key differences between the delayed and normal sell profiles are as follows:
- Flexible CBDR: This profile does not strictly require a CBDR smaller than 40 pips; a larger or smaller range is also suitable;
- Delayed Protraction: Unlike the normal protraction, the rally in this profile occurs right after 2:00 AM (New York time).
Example of a Delayed Sell Profile in the London Session
Imagine the market does not show a significant rally after midnight; Instead, it continues to decline until 2:00 AM. At this point, it makes a small rally, providing an ideal entry point for sell positions as the price moves toward a premium PD Array.
Steps for Trading with the London Delayed Sell Profile:
- Wait for a Price Rally at 2:00 AM: Be patient until a price rally occurs around 2:00 AM;
- Mark the Recent ICT Range: After therally, mark the recent ICT range and identify premium PD Arrays;
- Enter a Sell Trade: Enter a sell trade when the price reaches the premium PD Array or wait for a Market Structure Shift (MSS) on a lower timeframe for confirmation;
- Stop Loss and Take Profit: Set your stop loss above the highest point of the ICT range; Target discount PD Arrays or sell-side liquidity for take profit.
Buy Profiles During the London Session
The bullish version of this pattern begins like a classic buy or sell setup with a price drop below the open price. Then, the price starts to rise.
When the price decreases, a buy entry point is formed, and the price reaches a target point on a higher timeframe, such as a bearish order block or an unfilled Fair Value Gap (FVG).
If this happens during the New York session, it indicates a classic market reversal. This pattern is aligned with reaching a bearish order block on a higher timeframe, attacking a Turtle Soup, or closing a range.
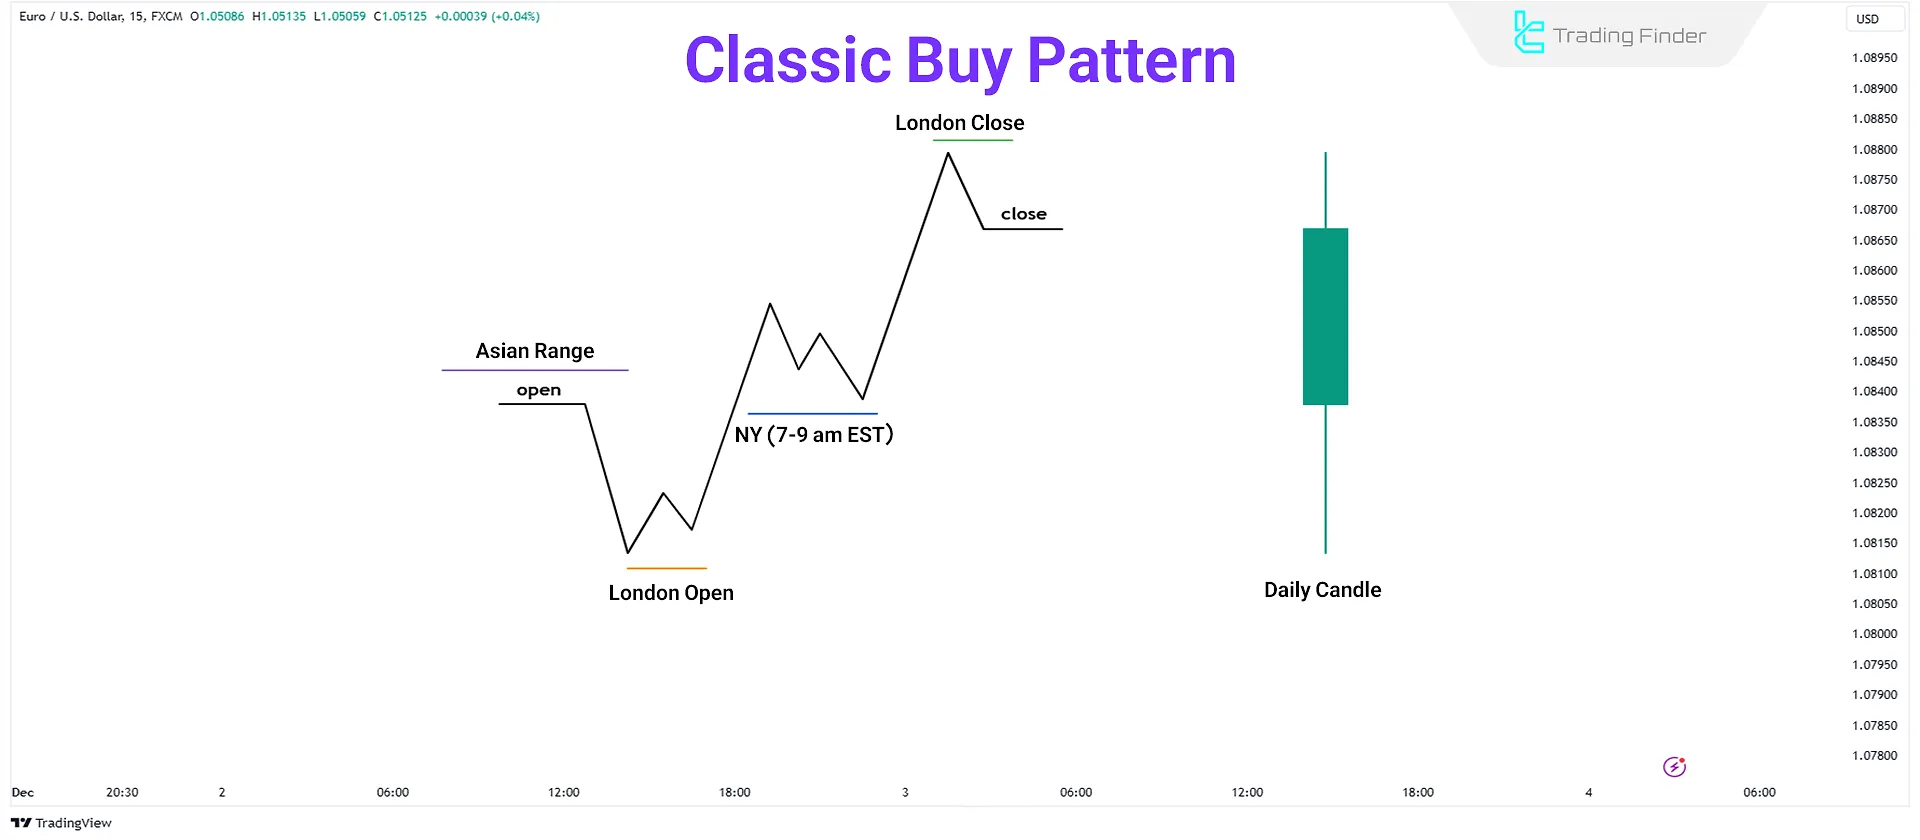
On a bullish day, an initial low is formed during the London session, followed by a price increase; This increase forms the day's high (High of Day) around the closing of the London session during the New York session.
Then the price drops again, wiping out the initial low created in the London session. Ideally, this pattern should form after a market range and follow the dominant trend on a higher timeframe.
This strategy involves monitoring the market during the last hour of the London session and the first hour of the New York session.
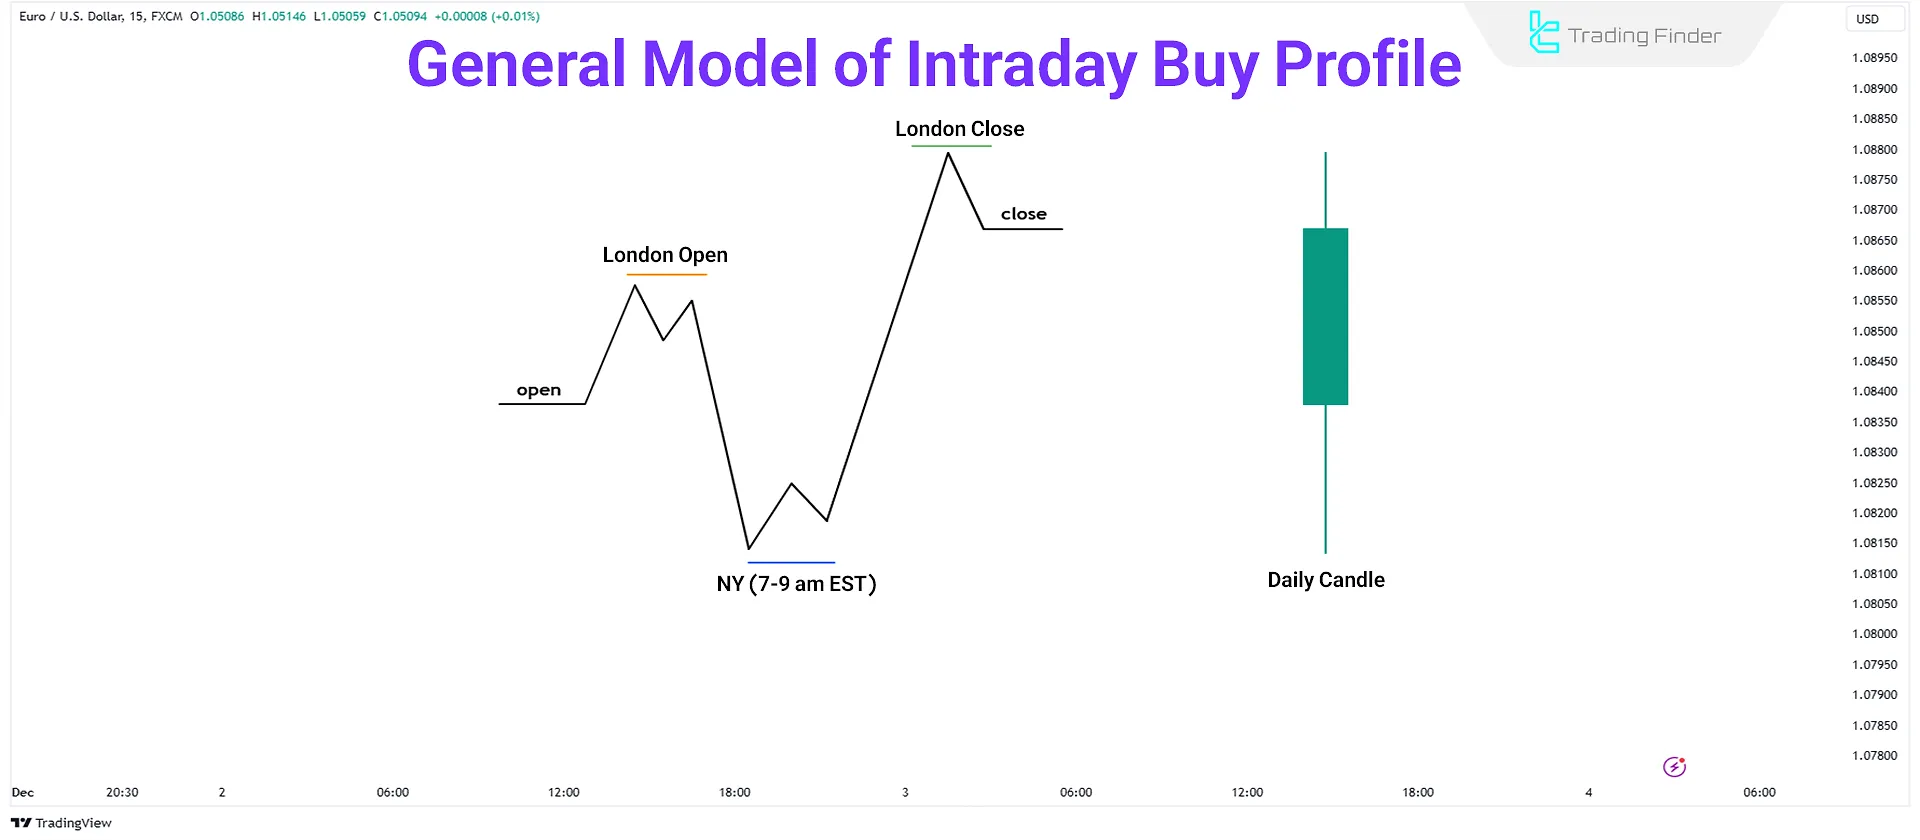
Similarly, there are two types of buy profiles:
- Normal Buy Profile
- Delayed Buy Profile
These setups are based on a bullish market outlook.
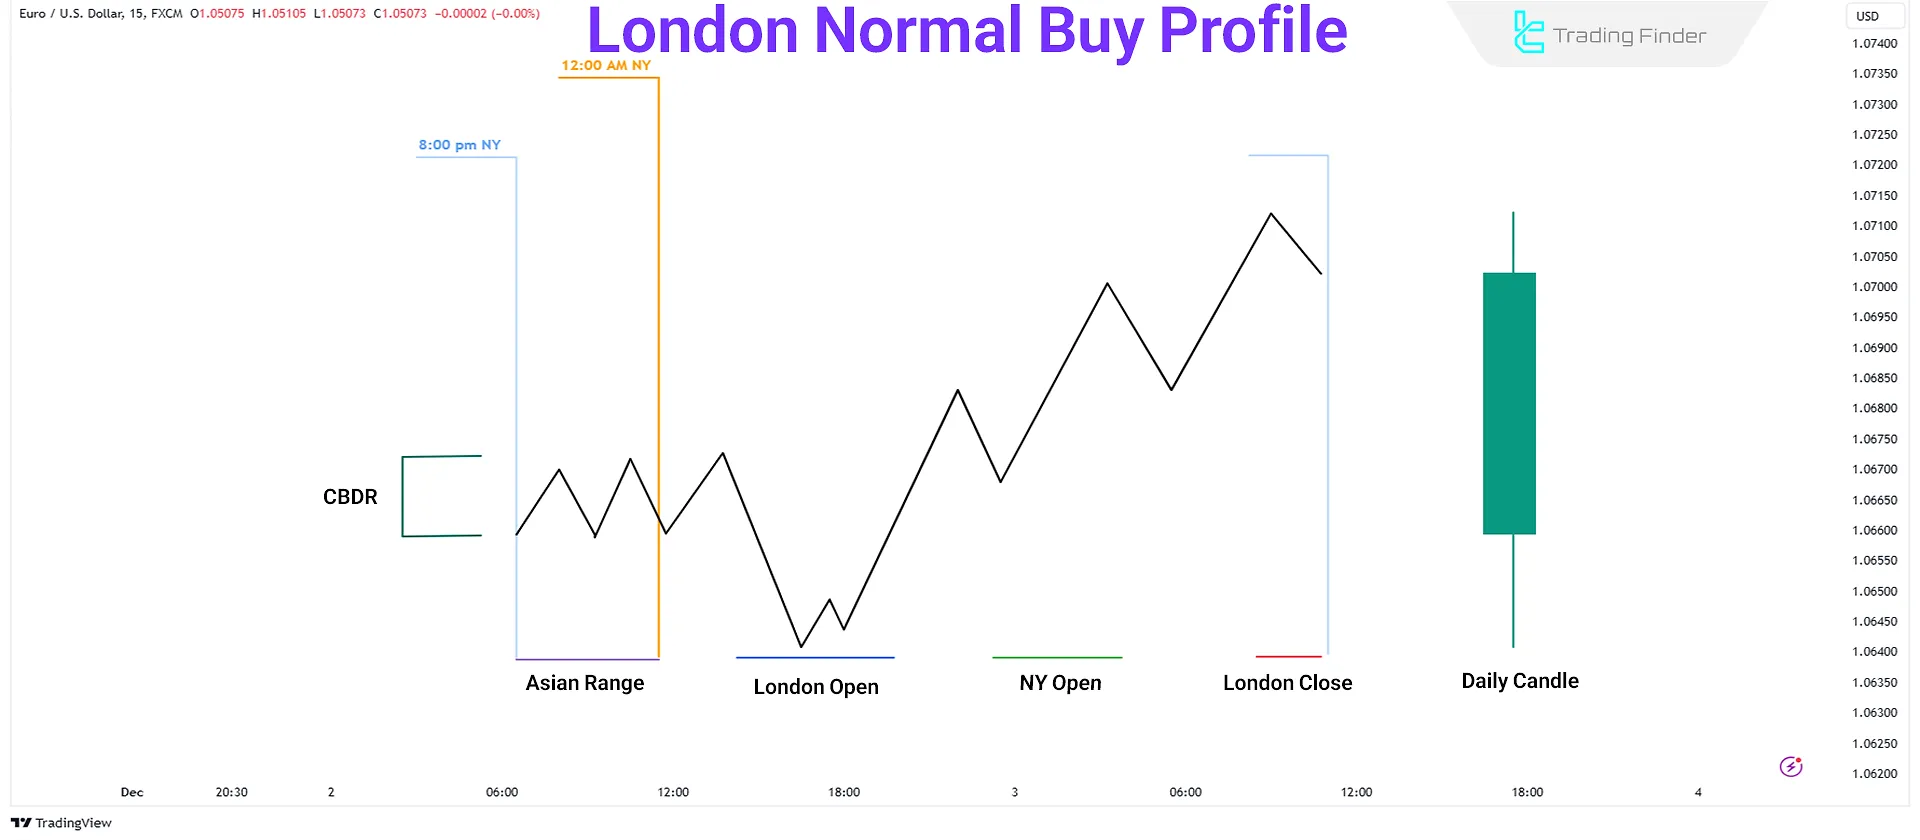
London Normal Protraction Buy Profile
This profile is used to initiate buy positions in the London session and requires specific conditions:
- Central Bank Dealers Range (CBDR): A CBDR smaller than 40 pips is essential for this profile;
- Asian Session Range: As in the sell profile, a narrow range of 20 to 30 pips is required;
- Intraday Market Movement: The market should begin to drop immediately after midnight New York time and continue until 2 AM;
- Protraction Phase: Before the price starts to rise and creates an ideal buy opportunity, look for a price drop of one or two standard deviations below the CBDR.
Example of a Normal Buy Profile in the London Session
The market consolidates during the Asian session and starts to decline after midnight. By 2 AM, it reaches its lowest point, providing an excellent entry point for buy positions as the price starts to rise.
Steps to Trade with the London Normal Buy Profile:
- Bullish Bias: Ensure the overall market trend for the day is bullish;
- Verify Key Criteria: Check all key metrics mentioned above;
- Entry: Look for a price rally immediately after 12:00 AM, although a slight upward movement before the rally is acceptable. Entry could occur as early as 1:00 AM or after 2:00 AM;
- Market Structure Shift (MSS): After the price movement in theLondon session and below the CBDR range, wait for a market structure shift (MSS) on a lower timeframe (e.g., 5 minutes or less);
- Execution: Place a buy trade in the discount zone with a stop loss below the lowest point of the London session;
- Take Profit: Set your target on higher timeframe liquidity pools or any premium PD Array.
London Delayed Protraction Buy Profile
This buy profile applies if the price fails to drop as expected after 12:00 AM. Here, the London expansion isdelayed, meaning the price does not drop immediately after 12:00 AM, even though the overall market bias remains bullish.
- Flexible Central Bank Dealers’ Range (CBDR): This setup works with both CBDRs larger and smaller than 40 pips;
- Timing and Market Behavior: The protraction phase or initial drop occurs right after 2:00 AM (New York time).
Example of a Delayed Buy Profile in the London Session
For example, a delayed buy profile in the London session forms when the market does not record a meaningful decline after midnight and instead continues its price trajectory toward higher levels.
Under these conditions, the analytical focus shifts to a price retracement into a Premium or Discount Array (PD Array), and this structure creates an optimal entry zone for buy trades within the Smart Money logic.
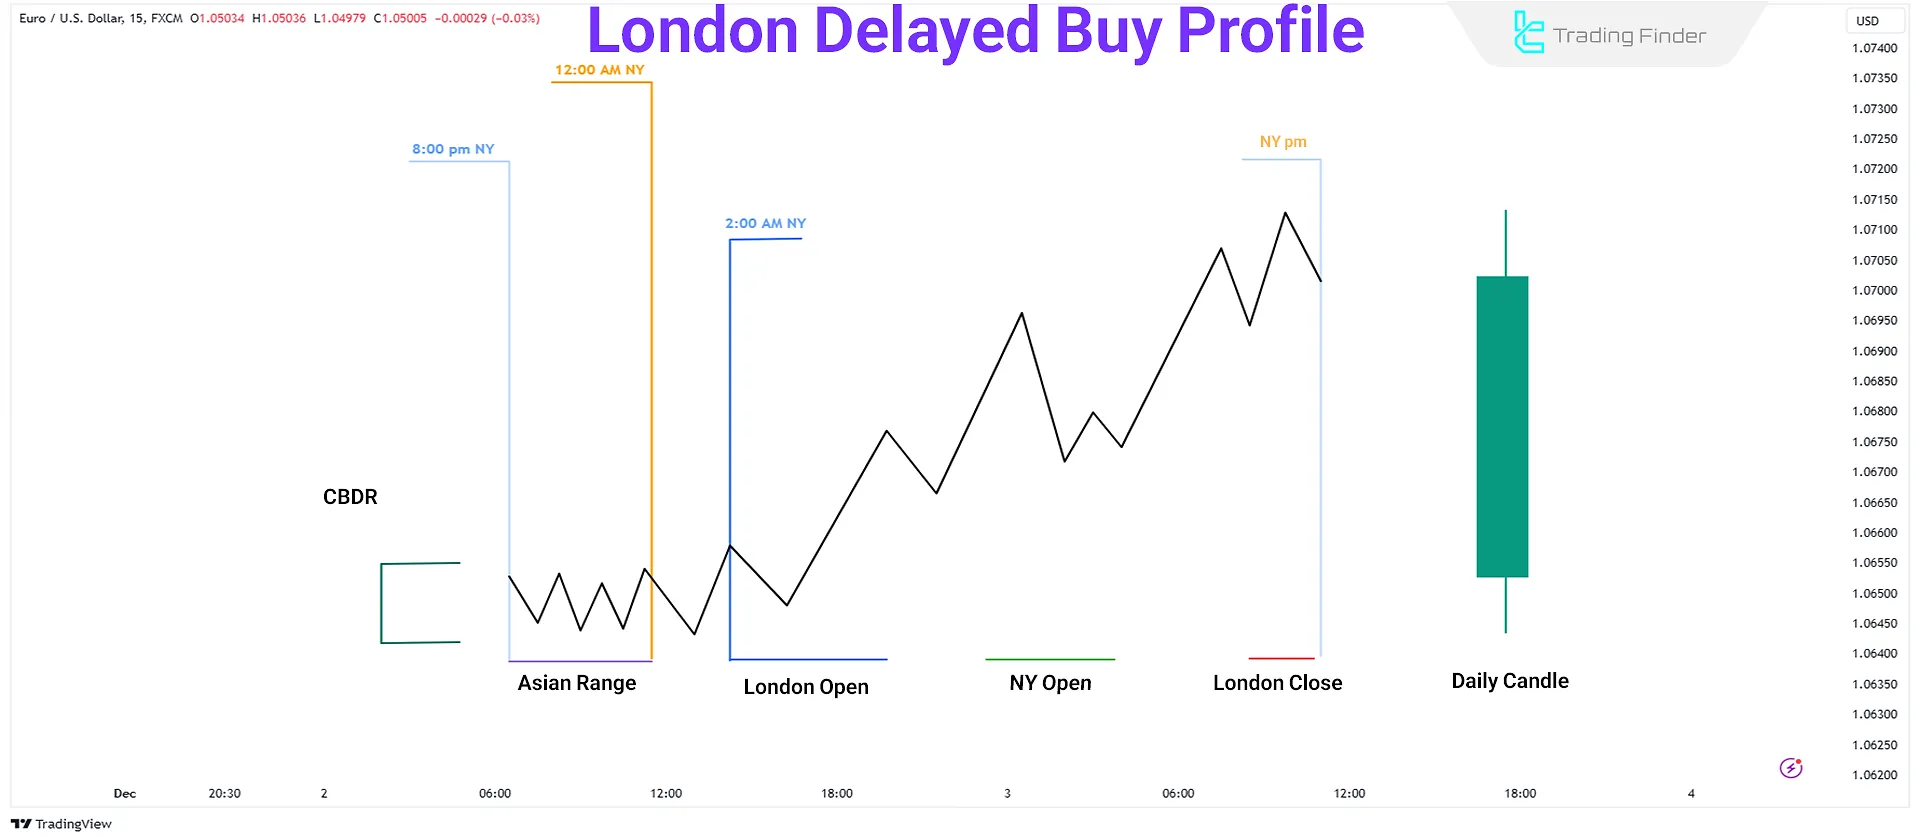
Steps for Effective Use of This Profile:
- Trading Setup from Midnight to 2 AM: Be vigilant from midnight to 2:00 AM (New York time); if significant movements occur, follow the buy profile criteria;
- Backup Plan from 2 AM to 3 AM: If initial conditions are not met by 2:00 AM, shift your focus to delayed protraction profiles and look for setups within this time frame;
- Daily Chart Analysis: Begin your assessment with the daily chart to determine the directional bias;
- Intraday Chart Setup: On intraday charts, place vertical lines at key times (12:00 AM and 2:00 AM) and observe market behavior around these points.
The educational article on ICT intraday profiles on the Writofinance.com website provides more detailed explanations about intraday profiles, which interested readers can refer to for a better understanding.
Comparison of Normal and Delayed Profiles in Intraday Profiles
In the analysis of daily profiles, one of the key parameters is the timing of Protraction formation and its alignment with the initial liquidity flow. This factor determines whether the trading day, in terms of price behavior, falls into the normal or delayed category.
In the table below, the differences between these two are examined based on various characteristics:
Analytical feature | Normal profile | Delayed profile |
Time window of Protraction formation | 00:00 to 02:00 a.m. (UTC) window and the initial establishment of the daily structure | Period after 02:00 a.m. (UTC) and the late emergence of the dominant direction |
Quality and strength of the Initial Drive | Continuous movement with a clear imbalance | Weak volatility with incomplete displacement |
Initial liquidity positioning | Liquidity aligned with the direction of the day and in line with the dominant trend | Counter-directional liquidity or a deceptive liquidity grab |
Structural risk | Low risk with rapid stabilization of the dominant direction and a lower probability of fake moves | High risk accompanied by fake moves, initial stop runs, and the possibility of early reversals |
Targeting precision | Clear targeting with transparent liquidity distribution and a predictable daily range | Targeting dependent on additional confirmation and the use of higher timeframes for context |
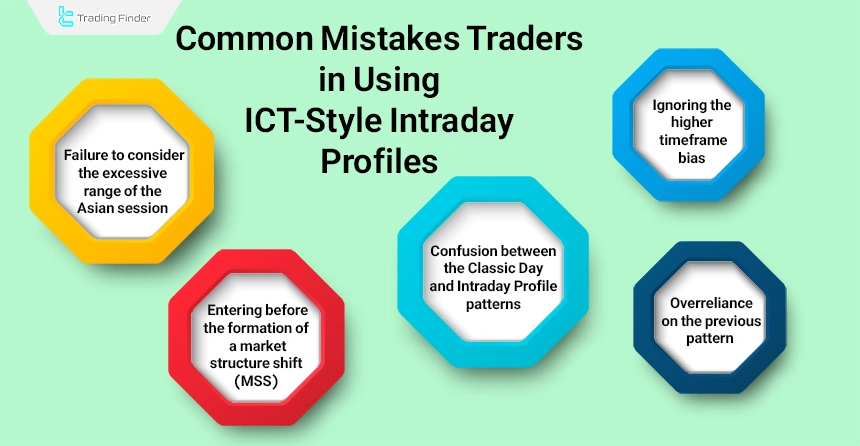
Common Trader Mistakes in Using Intraday Profiles
Many intraday losses occur due to incorrect interpretation of profiles, and these errors reduce the accuracy of daily analysis. The most important mistakes include:
- Entering before the formation of a Market Structure Shift (MSS): Early entry based solely on observing Protraction, while MSS is considered the definitive signal of a structural change;
- Overreliance on the previous pattern: Excessive focus on repeating past patterns without considering current-day conditions;
- Ignoring higher-timeframe bias: Failing to account for HTF Bias when interpreting profiles;
- Confusion between Classic Day patterns and Intraday Profiles: Mixing Classic Templates with Intraday Profiles and creating a misreading of the daily structure;
- Failure to consider excessive Asian session range: High volatility during the Asian session and a reduced probability of a normal profile forming later in the day.
ICT-style FVG Session Intraday Daily Indicator for MetaTrader
The FVG Session Intraday indicator for MetaTrader is one of the specialized ICT-style tools designed for day traders and liquidity-based traders.
The main function of this indicator is the precise identification of Fair Value Gaps (FVGs) across the three major sessions: Tokyo, London, and New York.
These gaps are typically formed at the beginning of strong market moves and play an important role in identifying potential price retracement zones.
- ICT-style FVG session intraday daily indicator for MT5
- ICT-style FVG session intraday daily indicator for MT4
By plotting the daily high and low range of each session and highlighting the first FVG, this tool helps users analyze the probable price path and liquidity flow with greater clarity.
Bullish FVGs are displayed in green, and bearish FVGs are displayed in red. If price breaks through these zones, the color of the area automatically fades to indicate a reduction in its validity for the trader.
This feature is especially important for traders who trade based on level breaks or retracements.
This indicator is compatible with a wide range of markets, including Forex, cryptocurrency, stocks, commodities, and even the forward market.
In a practical example, on a currency pair chart on the 15-minute timeframe, after an FVG forms during the Tokyo session, price returns to that same area to absorb liquidity and then continues its upward trend.
Additionally, on another 1m currency pair chart, a bearish FVG forms, price retraces into it, and pending orders are triggered an area where traders usually place SL just before the zone and enter sell trades.
YouTube:
The indicator settings section allows users to define the exact timing of the Tokyo, London, and New York sessions, set the minimum width of the FVG range, and specify the server time offset relative to GMT.
The required skill level for using this tool is intermediate, and it falls under the category of ICT, liquidity, and trading session indicators for MetaTrader.
Overall, the FVG Session Intraday indicator is considered a key tool for ICT-style traders and, by accurately identifying fair value gaps, provides a deeper understanding of intraday price behavior.
Conclusion
Profiting from London session trades depends on precision in understanding ICT-style intraday profiles. By following the outlined criteria and maintaining continuous monitoring, you can significantly improve the accuracy of your trades.
Regardless of whether you are looking for a normal or delayed protraction scenario, these profiles provide a powerful framework for navigating the London session and achieving profitable trades.


