


The New York Reversal Strategy in daily profiles is a core concept in ICT trading style, used by professional traders to identify price reversal opportunities.
This strategy focuses on key market structure shifts during the New York session, helping traders pinpoint entry points for high-probability trades.
What is the New York Reversal?
The New York Reversal is a price action pattern in financial markets. In this strategy, the primary focus is on the London and New York AM sessions and Kill Zone.
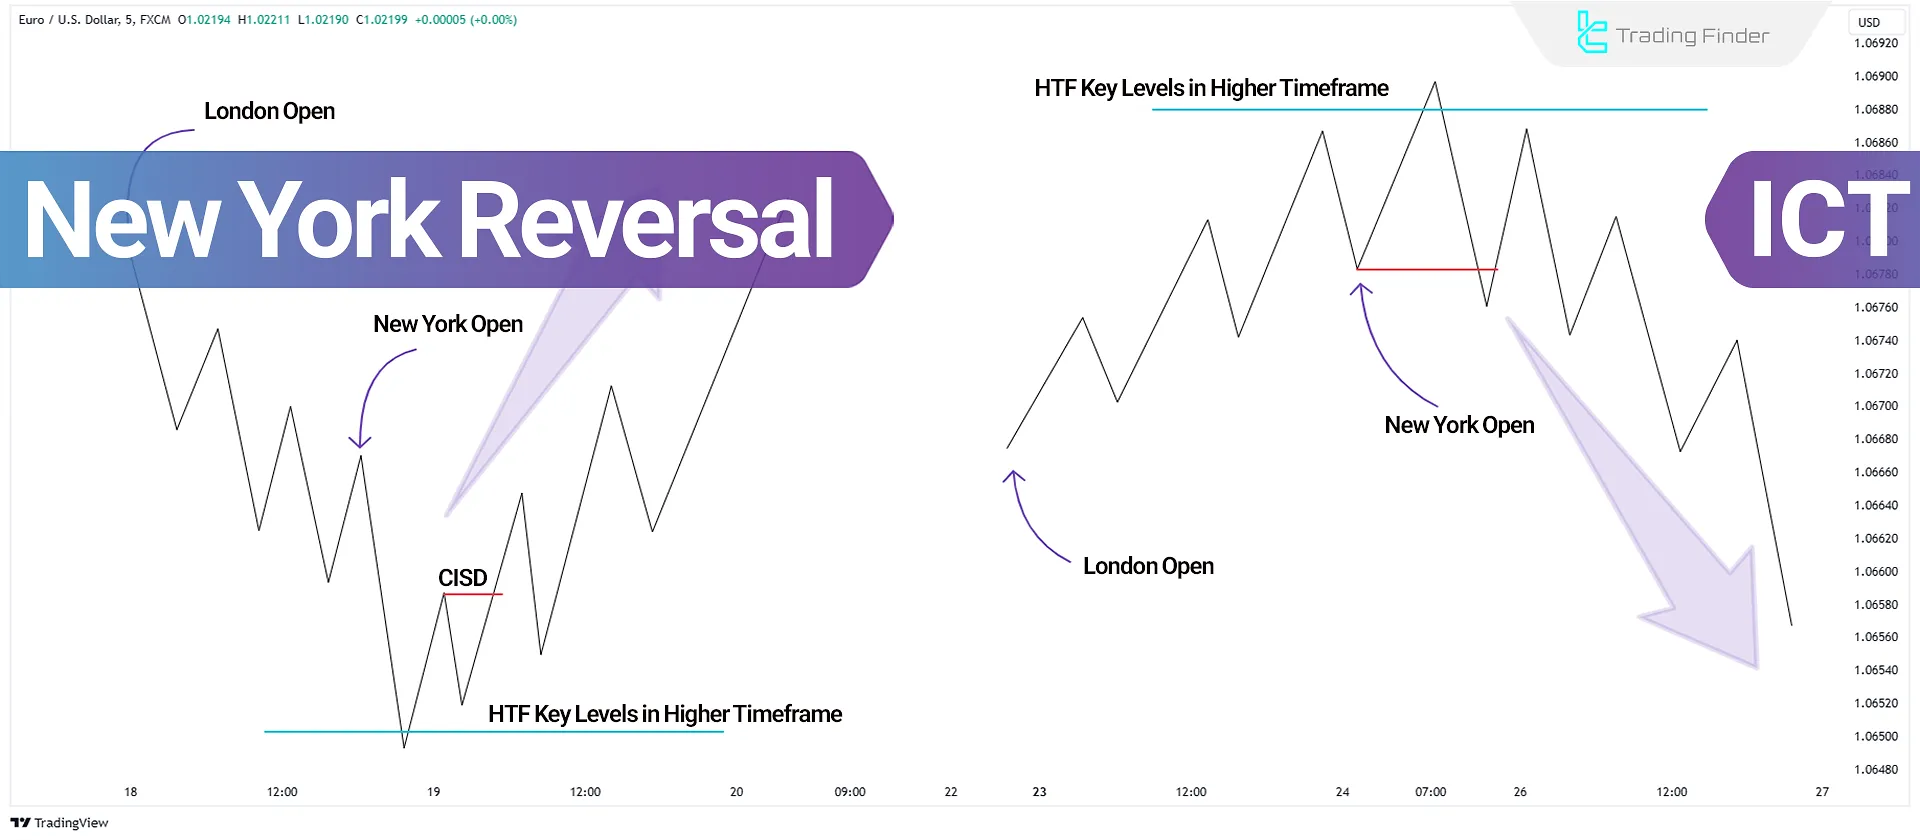
The New York Reversal occurs when the London session fails to reach key higher timeframe levels, leading to a price continuation during the New York session. This setup occurs in two scenarios.
#1 Bullish New York Reversal
Here's how the New York session's inversion to the uptrend works:
- The London session pushes price lower but does not reach a higher timeframe key level
- During the New York session, price moves to the key level and reverses upward, initiating a bullish trend
#2 Bearish New York Reversal
The bearish New York Reversal works the same way as the bullish one but just in a different direction:
- The London session pushes price higher but fails to reach a higher timeframe key level
- During the New York session, price moves to the key level and reverses downward, initiating a bearish trend
This pattern is widely used by professional traders to identify high-probability reversal opportunities.
Steps to Execute the New York Reversal Strategy in Daily Profiles
To apply the New York Reversal Strategy, follow these steps:
- Identify Market Structure: Locate higher timeframe key levels such as support, resistance, or liquidity zones
- Analyze the London Session: Check if price reached or failed to reach these levels
- Observe Market Structure Shifts: Look for a Market Structure Shift (MSS) or Change in State Delivery (CISD)
- Enter Trades: Use Fair Value Gaps (FVGs) or Order Blocks (OBs) to take positions at key levels
Examples of New York Reversal in Daily Profiles
To perform market analysis using New York Reversal strategy, we will review bullish and bearish examples.
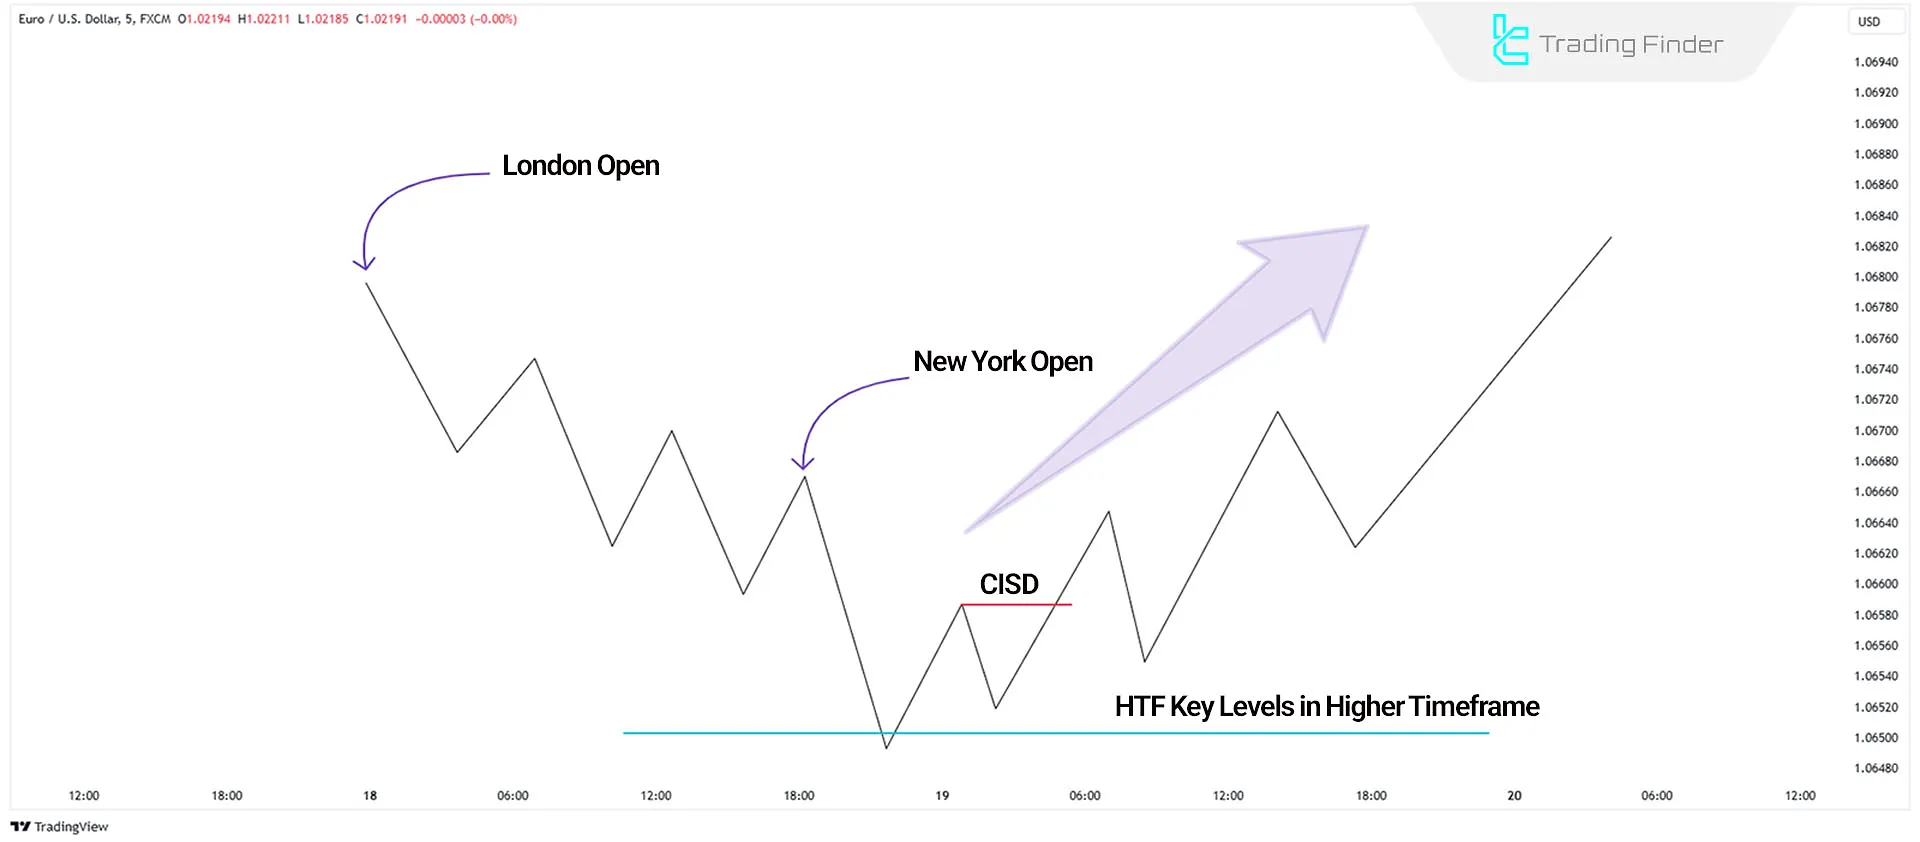
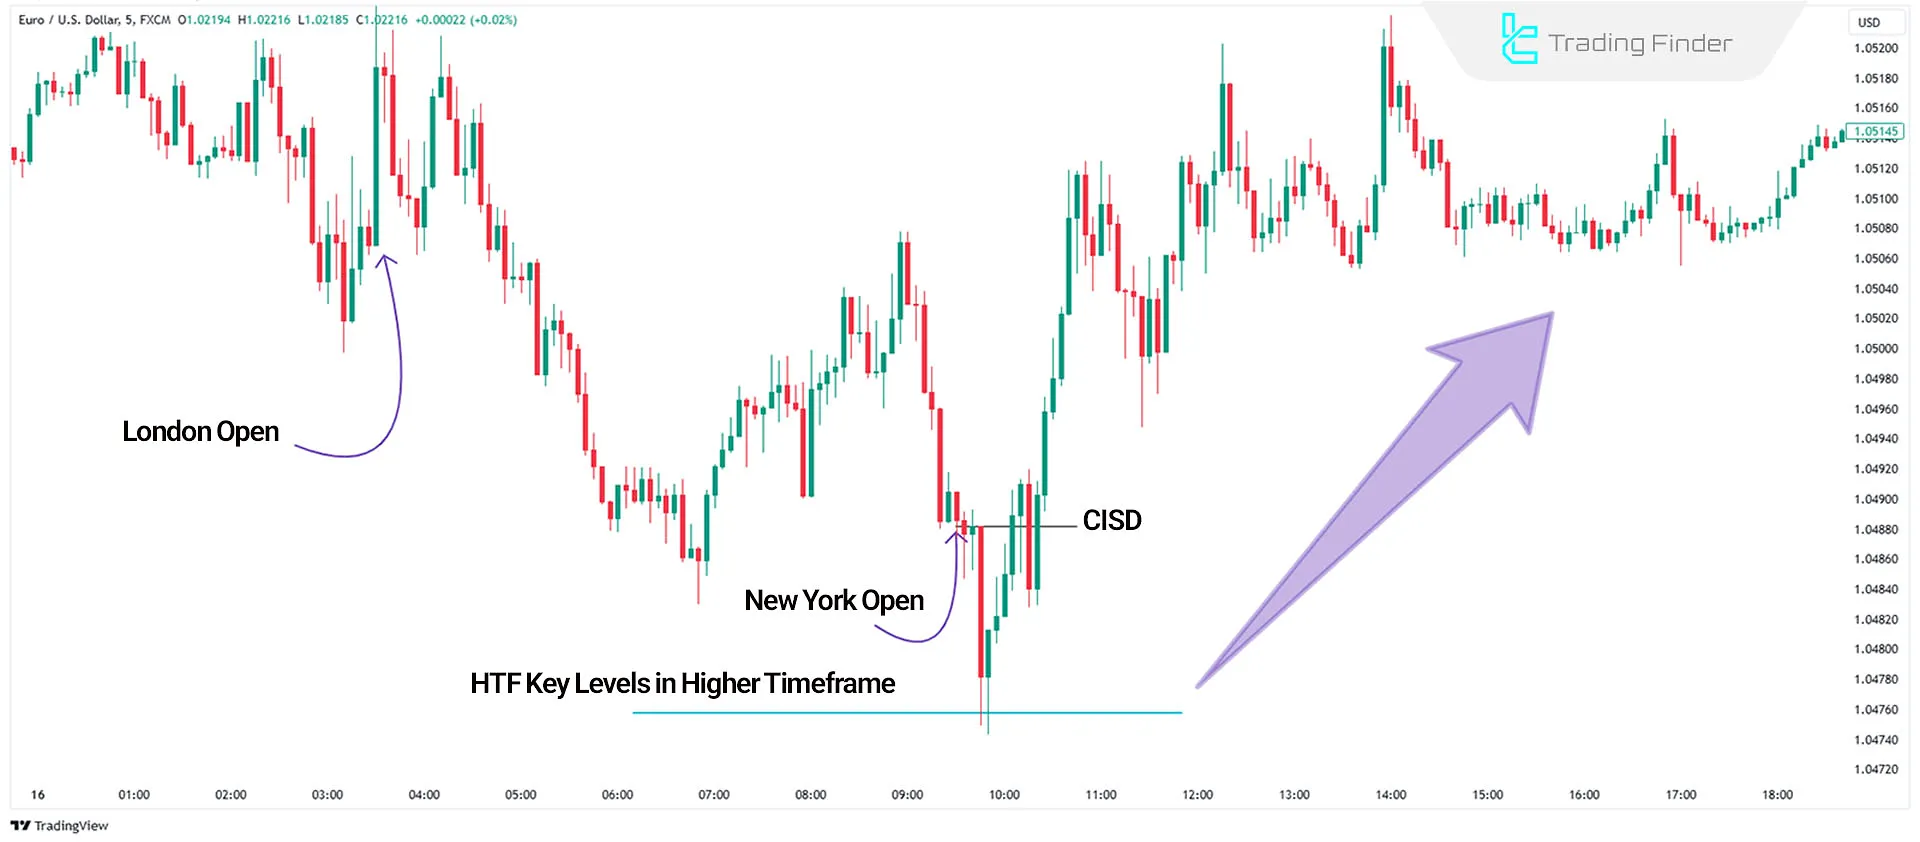
Bullish New York Reversal in Daily Profiles
In a 5-minute EUR/USD chart, price declines during the London session. As the New York session opens, price continues to drop until it reaches a higher timeframe key level.
After confirming reversal signs such as CISD and MSS, traders can enter long (buy) positions.
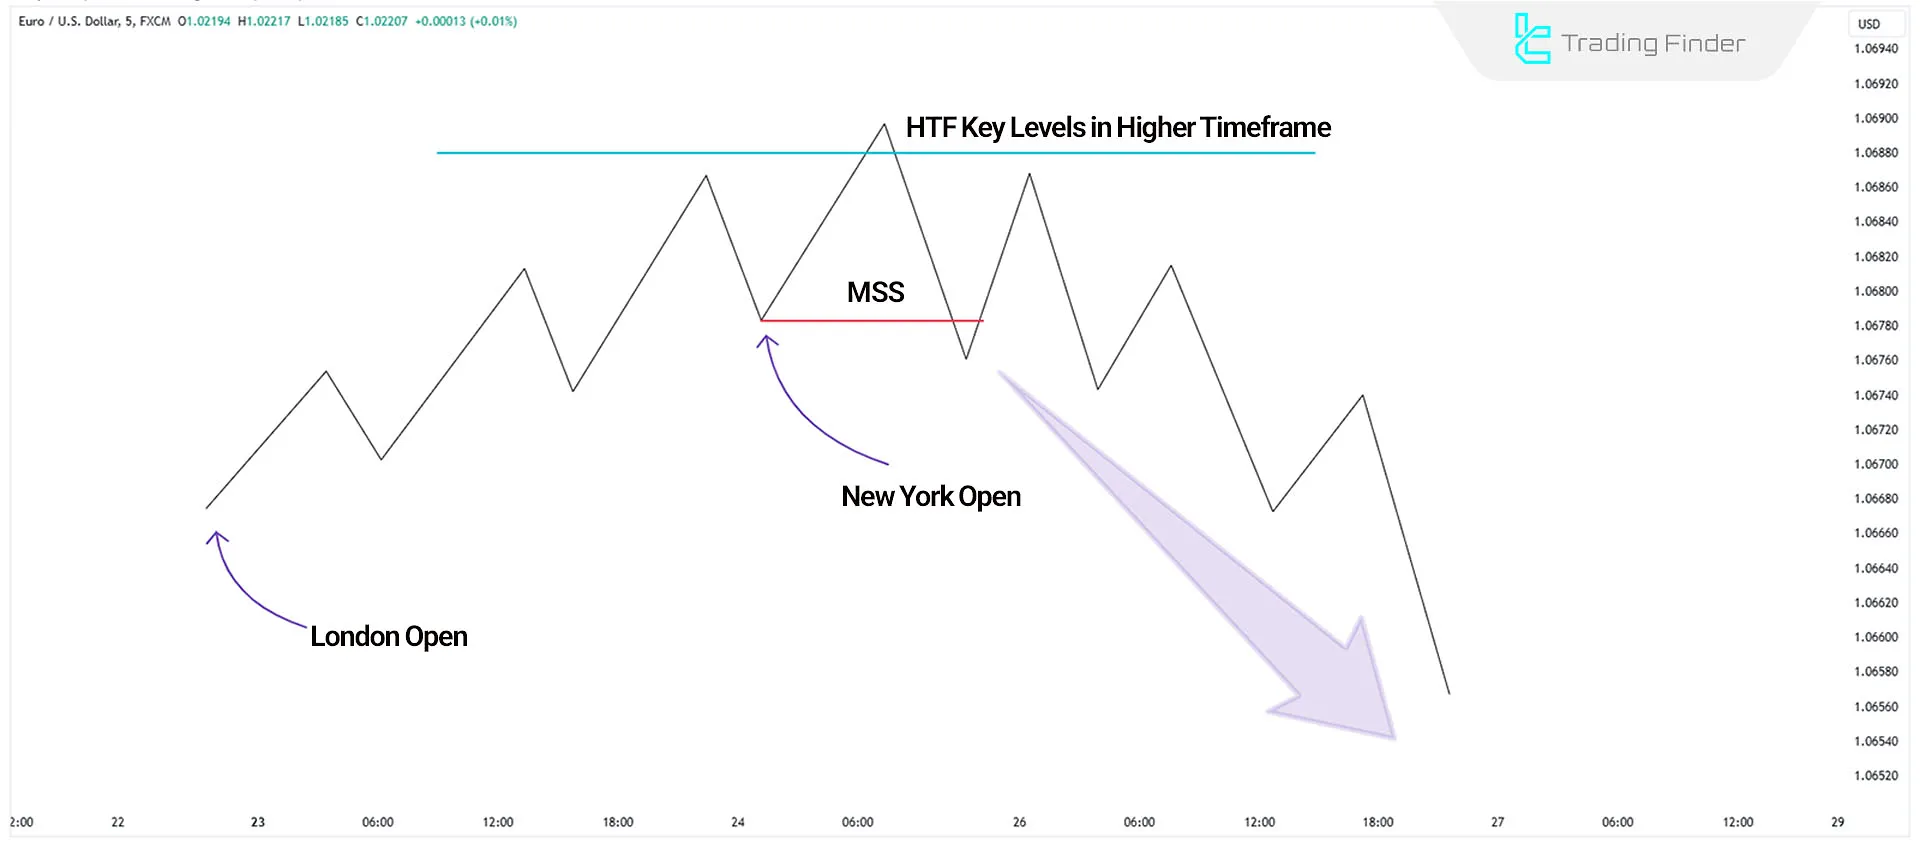
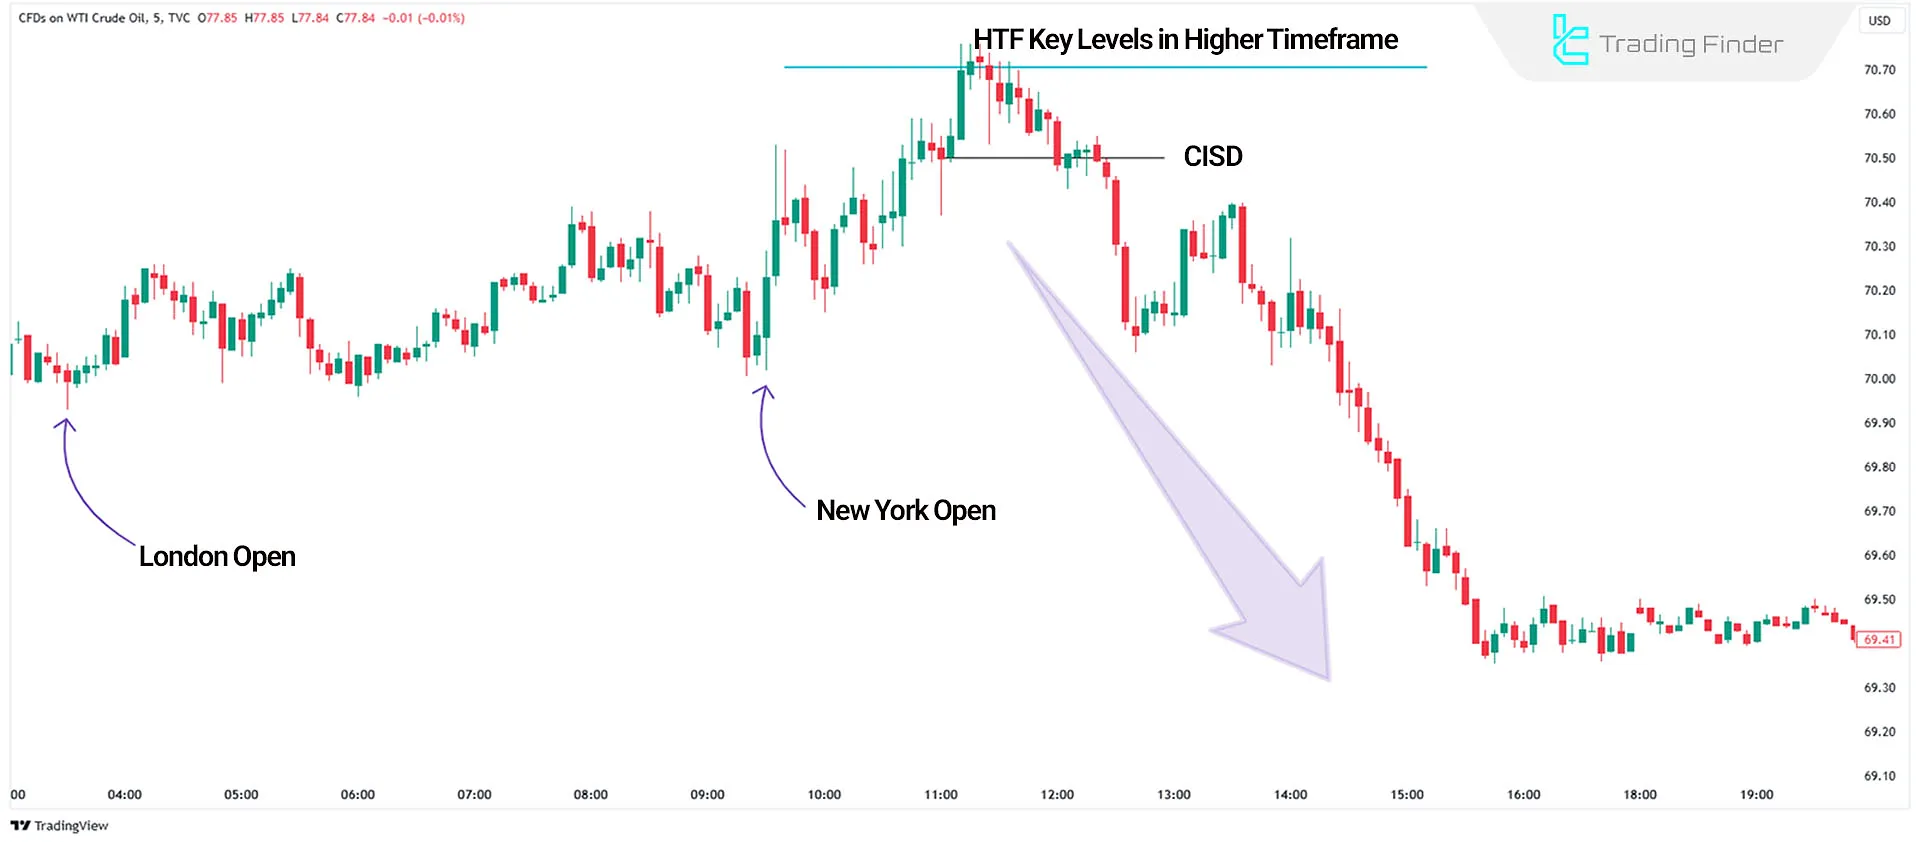
Bearish New York Reversal in Daily Profiles
In a 5-minute OIL chart, the price trends upward during the London session. As the New York session opens, the bullish movement continues until the price reaches a higher timeframe key level.
After spotting reversal signs such as Change in Short-Term Direction (CISD) and Market Structure Shift (MSS), traders can enter short (sell) positions.
Key Considerations for Using the New York Reversal Strategy
Key Points for Utilizing the New York Reversal Are as Follows:
- The key reversal windows in the New York session are 8:30 AM, 9:30 AM, and 10:00 AM EST
- For precise trade entries, use 15-minute timeframes or lower
- To manage risk, stop losses can be placed above or below an FVG or OB
Conclusion
The New York Reversal Strategy in Daily Profiles is an effective method for identifying price reversal points in financial markets.
This strategy focuses on higher (daily) and lower (1m – 5m) timeframes, combining them with key liquidity zones in kill zones to support trades with optimal risk and profitability.


