


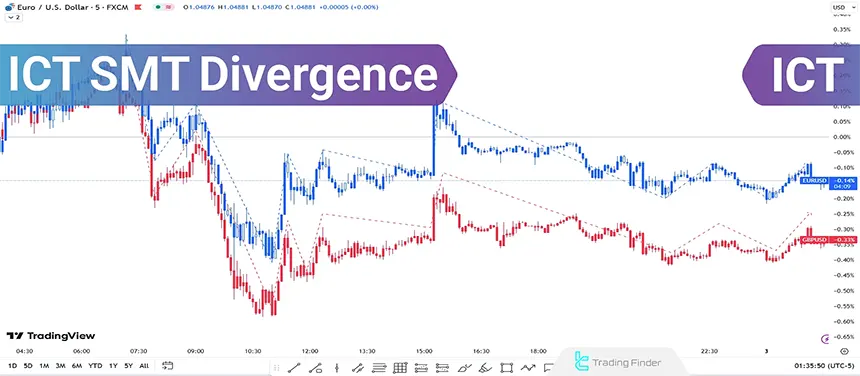
ICT SMT Divergence occurs whentwo related and correlated assets show opposite trends [one bullish and the other bearish] on their price charts during the same timeframe in ICT style.
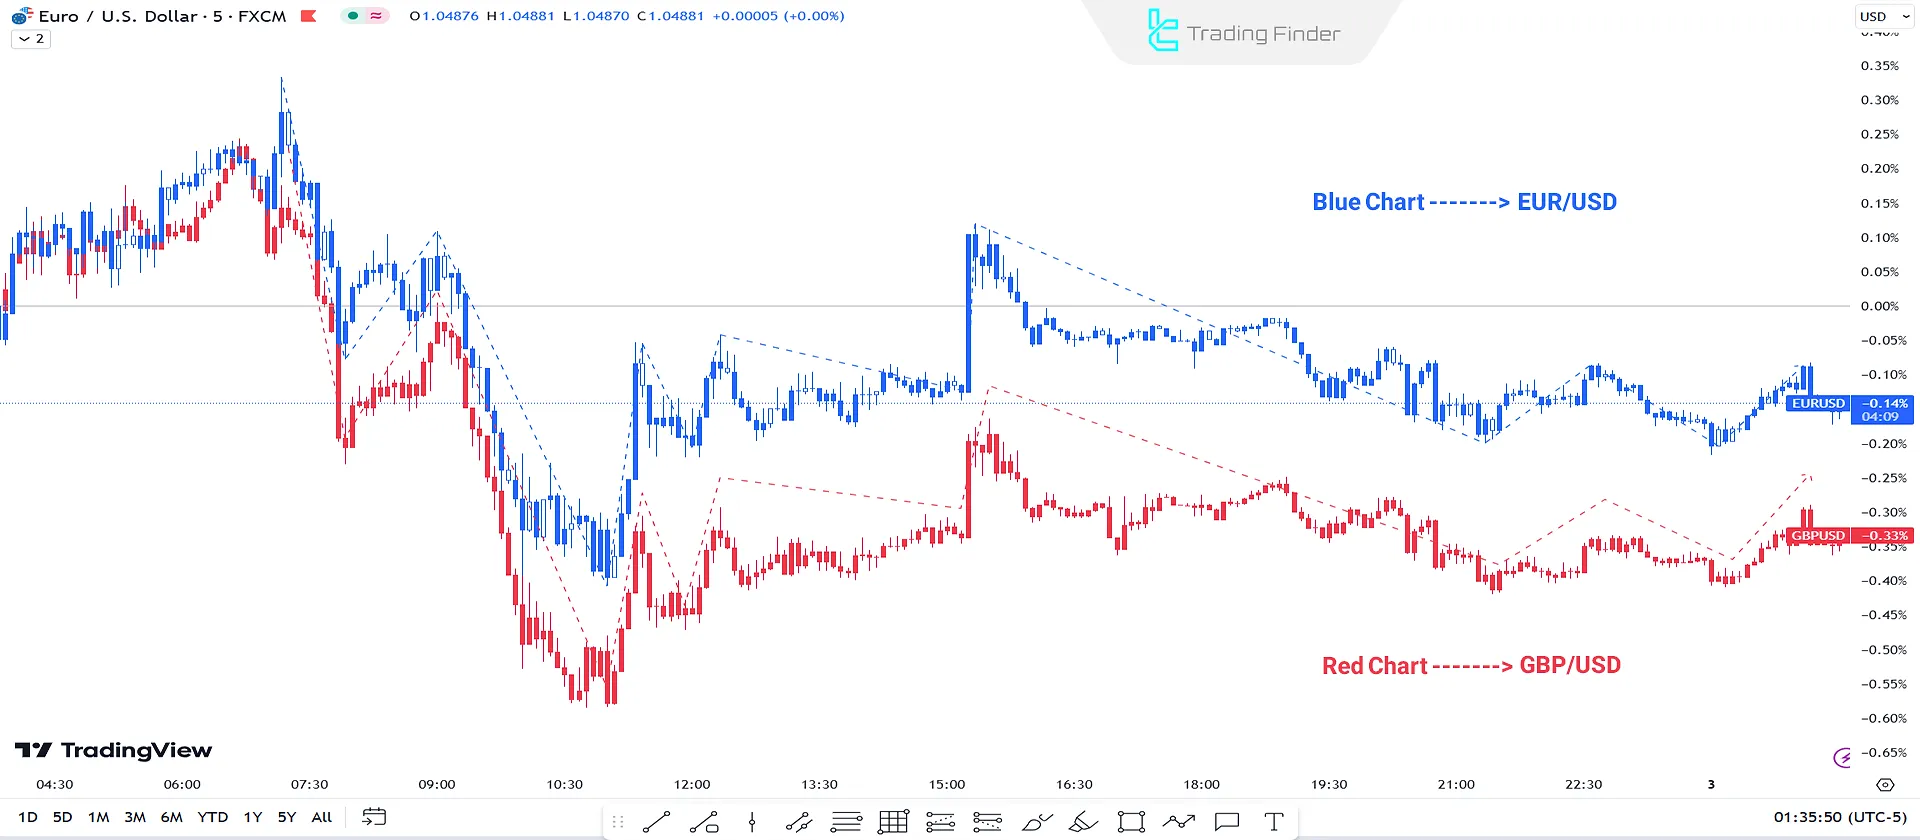
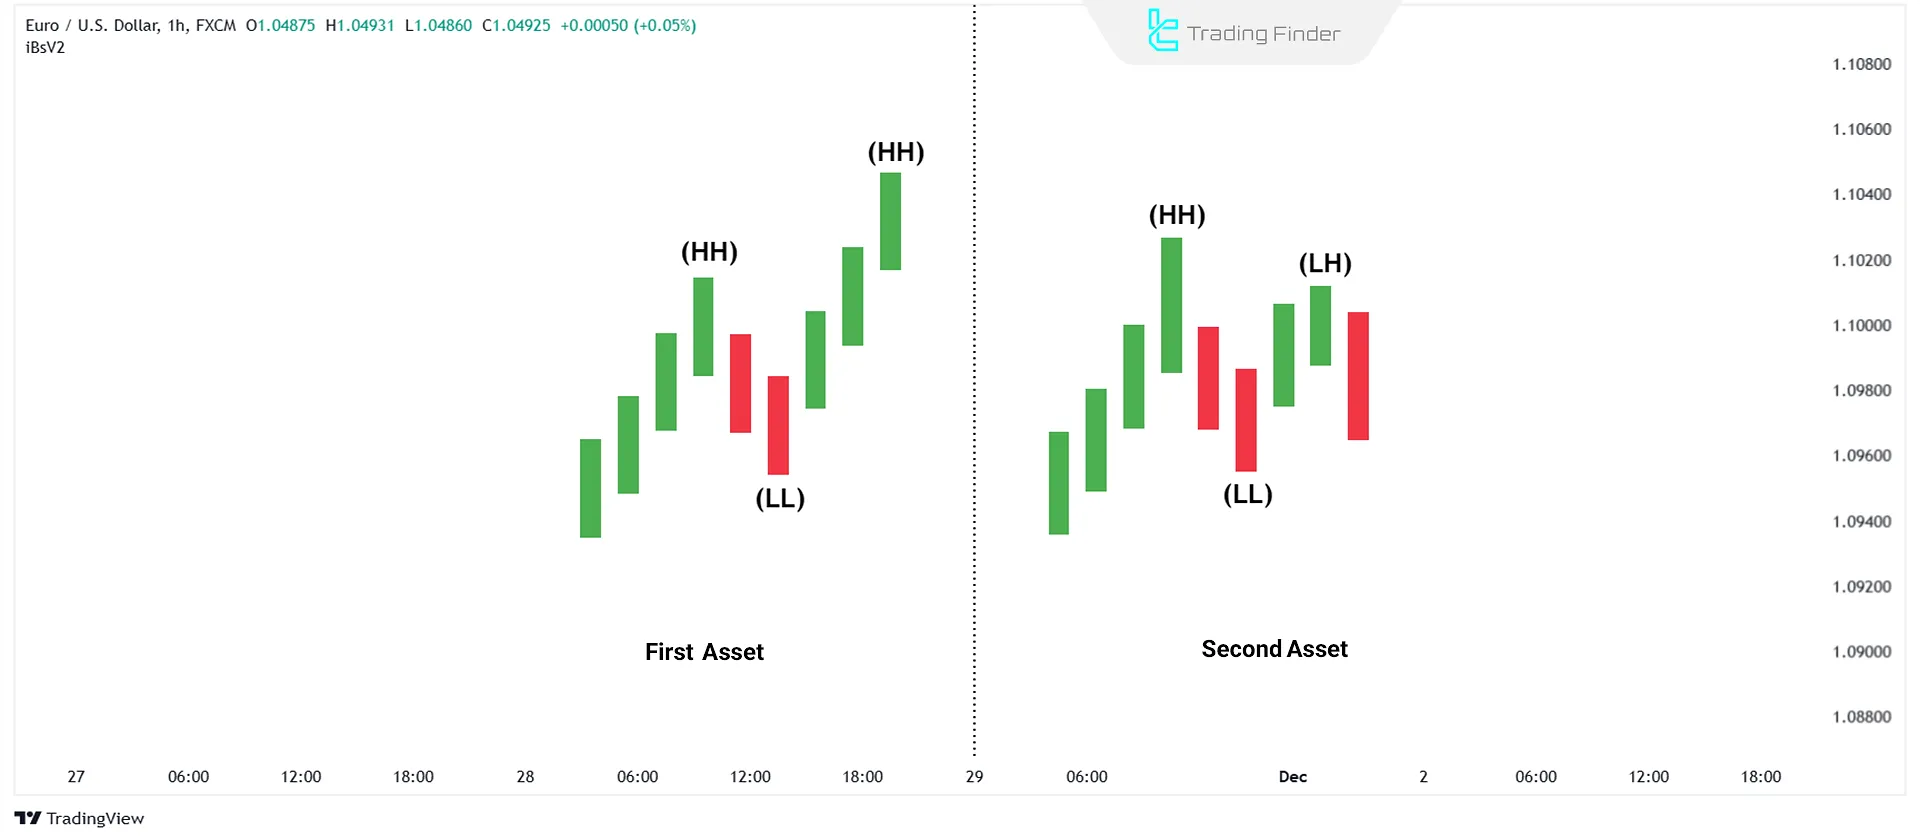
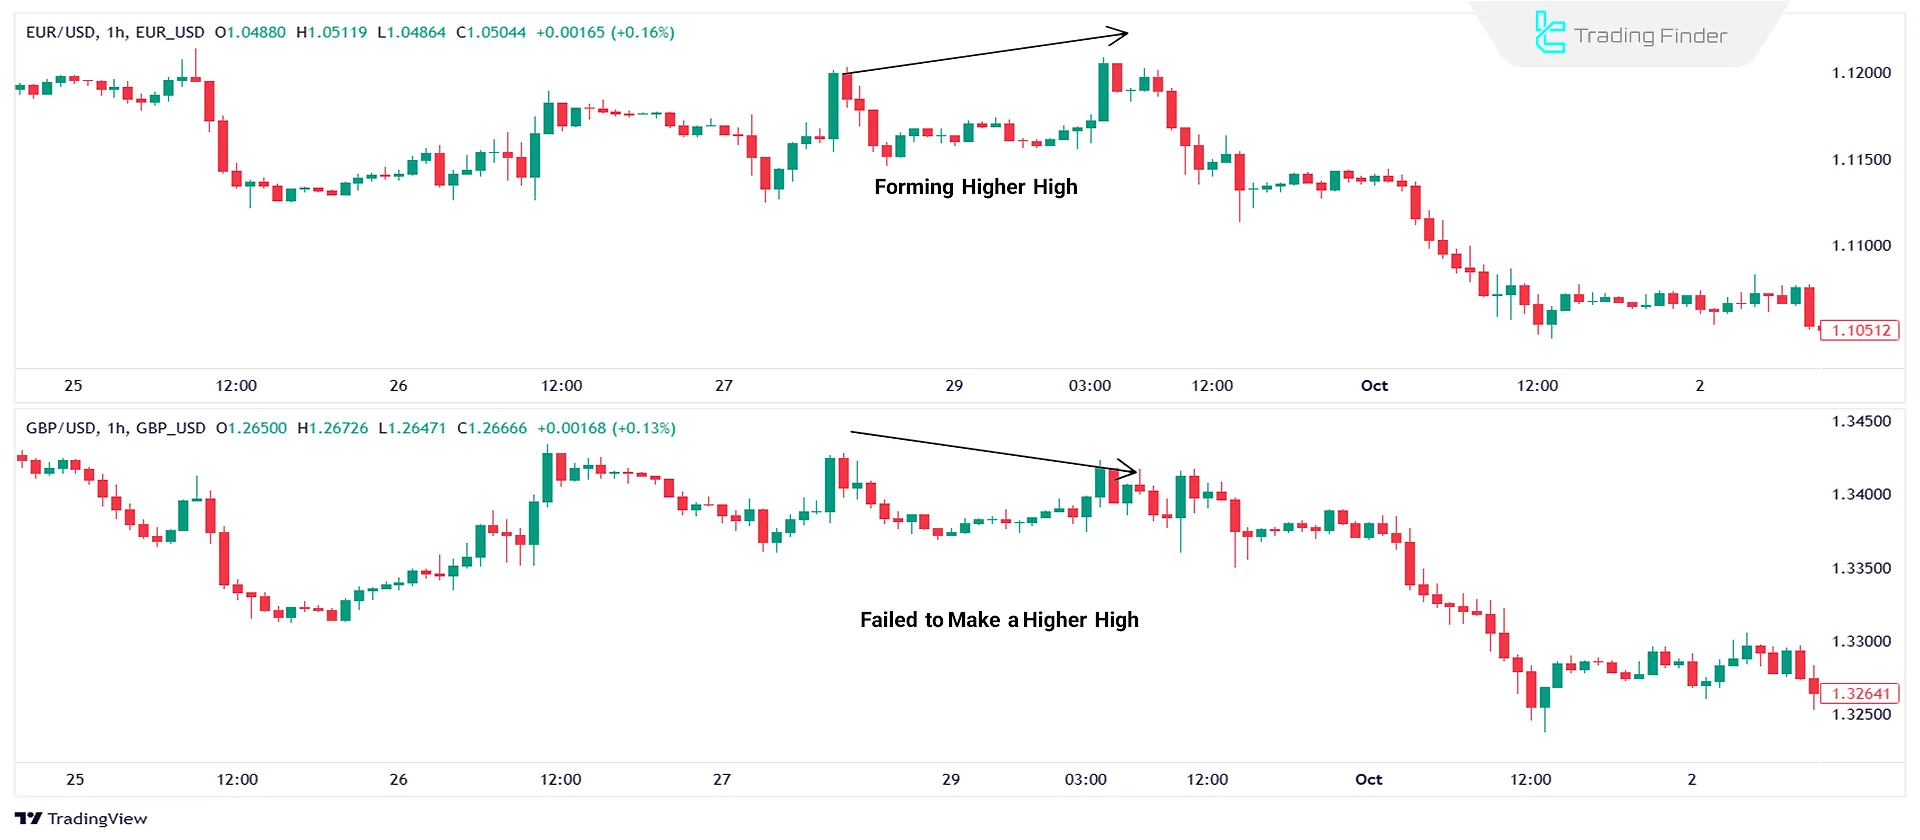
This situation can occur in positively correlated assets such as EUR/USD versus GBP/USD. For example, EUR/USD forms a Higher High (HH), while the other asset forms a Lower High (LH) instead of a Higher High (HH.)
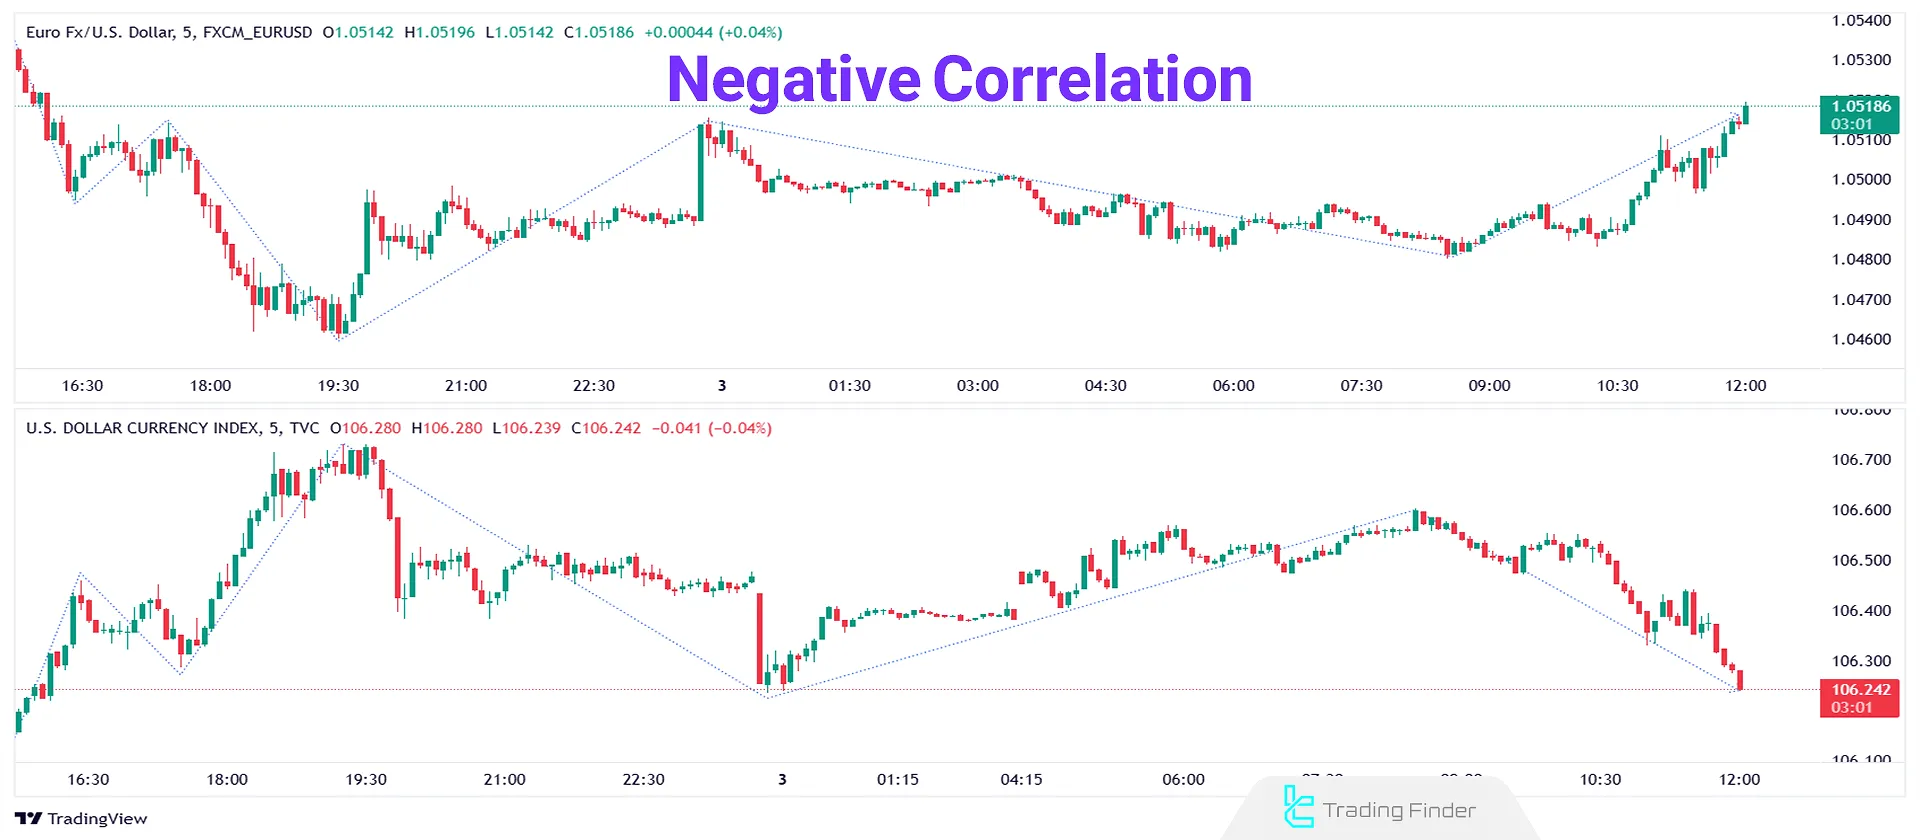
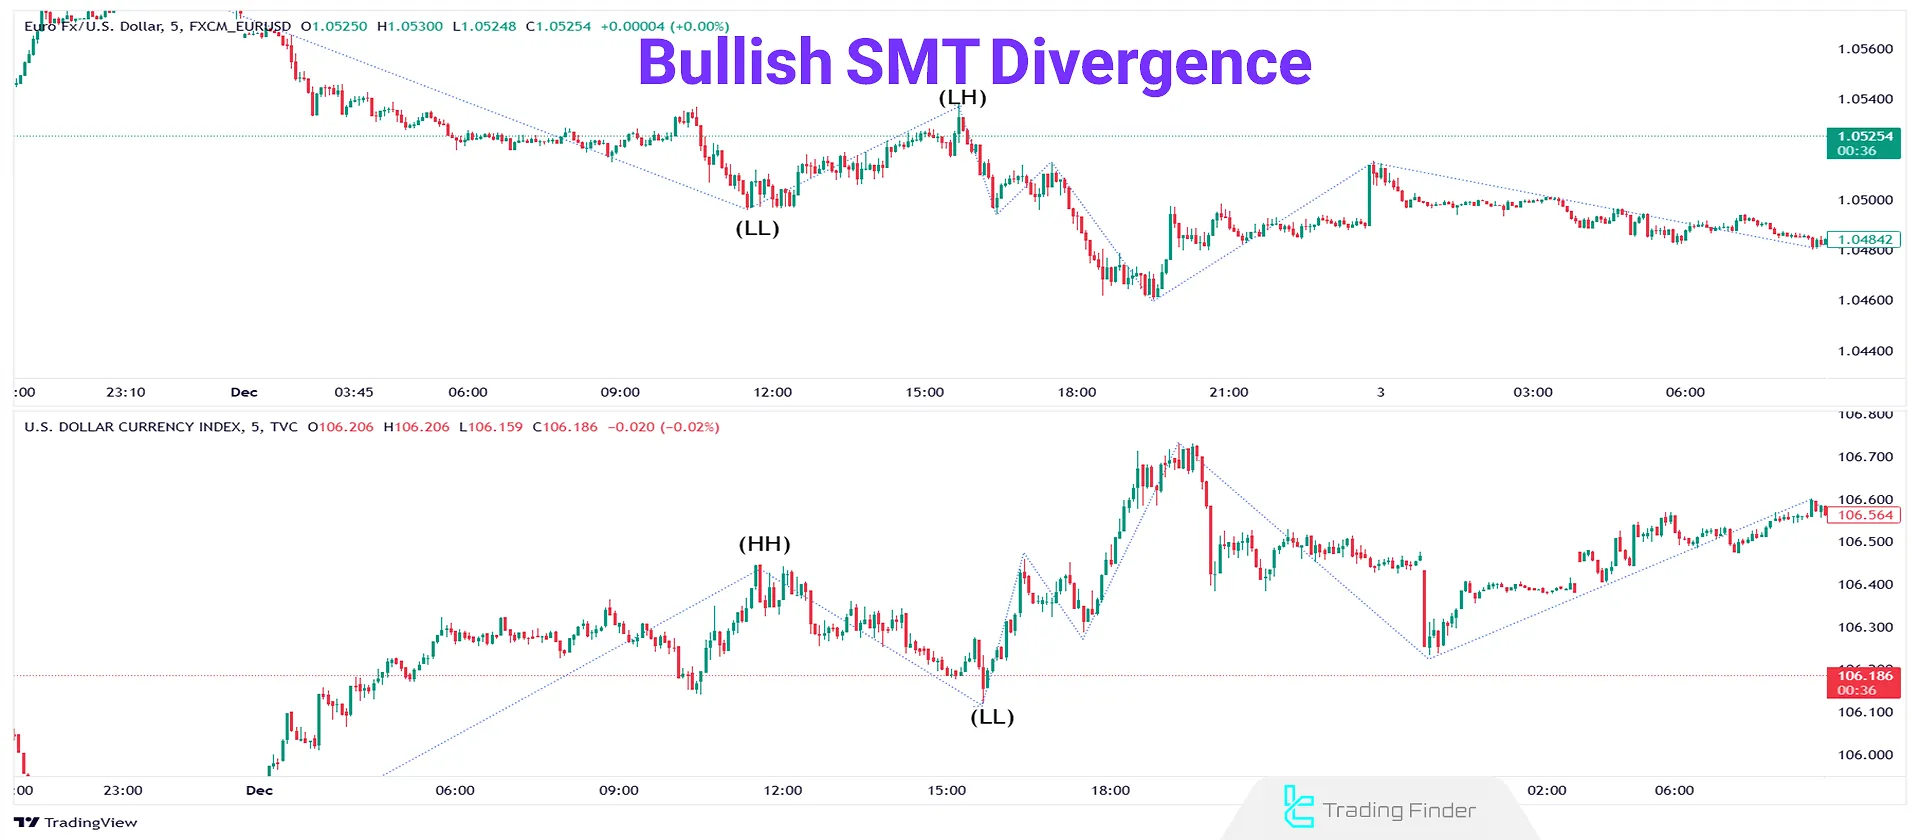
In negatively correlated assets, like EUR/USD versus the US Dollar Index (USDX), EUR/USD forms a Higher Low (HL); while the other asset forms a Lower High (LH) instead of a Higher High (HH).
What is ICT SMT Divergence?
Typically, correlated assets in financial markets move symmetrically. If two positively correlated assets exist and one forms a Higher High (HH), the other will also form a Higher High (HH).
For instance, the price charts of two positively correlated assets, EUR/USD versus GBP/USD, show this phenomenon over the same timeframe.
ICT SMT Divergence, or the Smart Money Technique (SMT), highlights a market scenario where two correlated assets show opposing structures within the same timeframe (one bullish and the other is bearish.)
Sometimes, correlated assets decouple. For example, if one forms a Higher High (HH), while the second fails to form a Higher High (HH), and vice versa, this situation is known as ICT SMT Divergence.
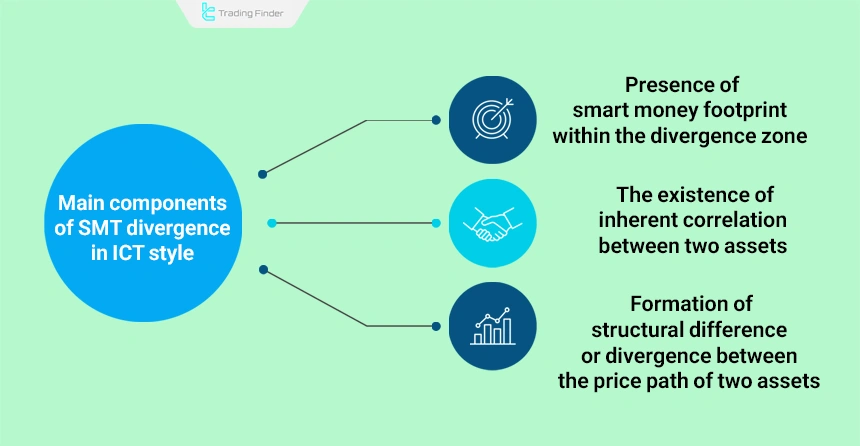
SMT Divergence Only Becomes Meaningful when Three Fundamental
components are present within the market structure:
- The existence of an inherent correlation between two assets;
- The formation of structural difference or divergence between the price path of the two assets;
- The presence of smart money footprint within the divergence zone.
Inherent Correlation Between Assets
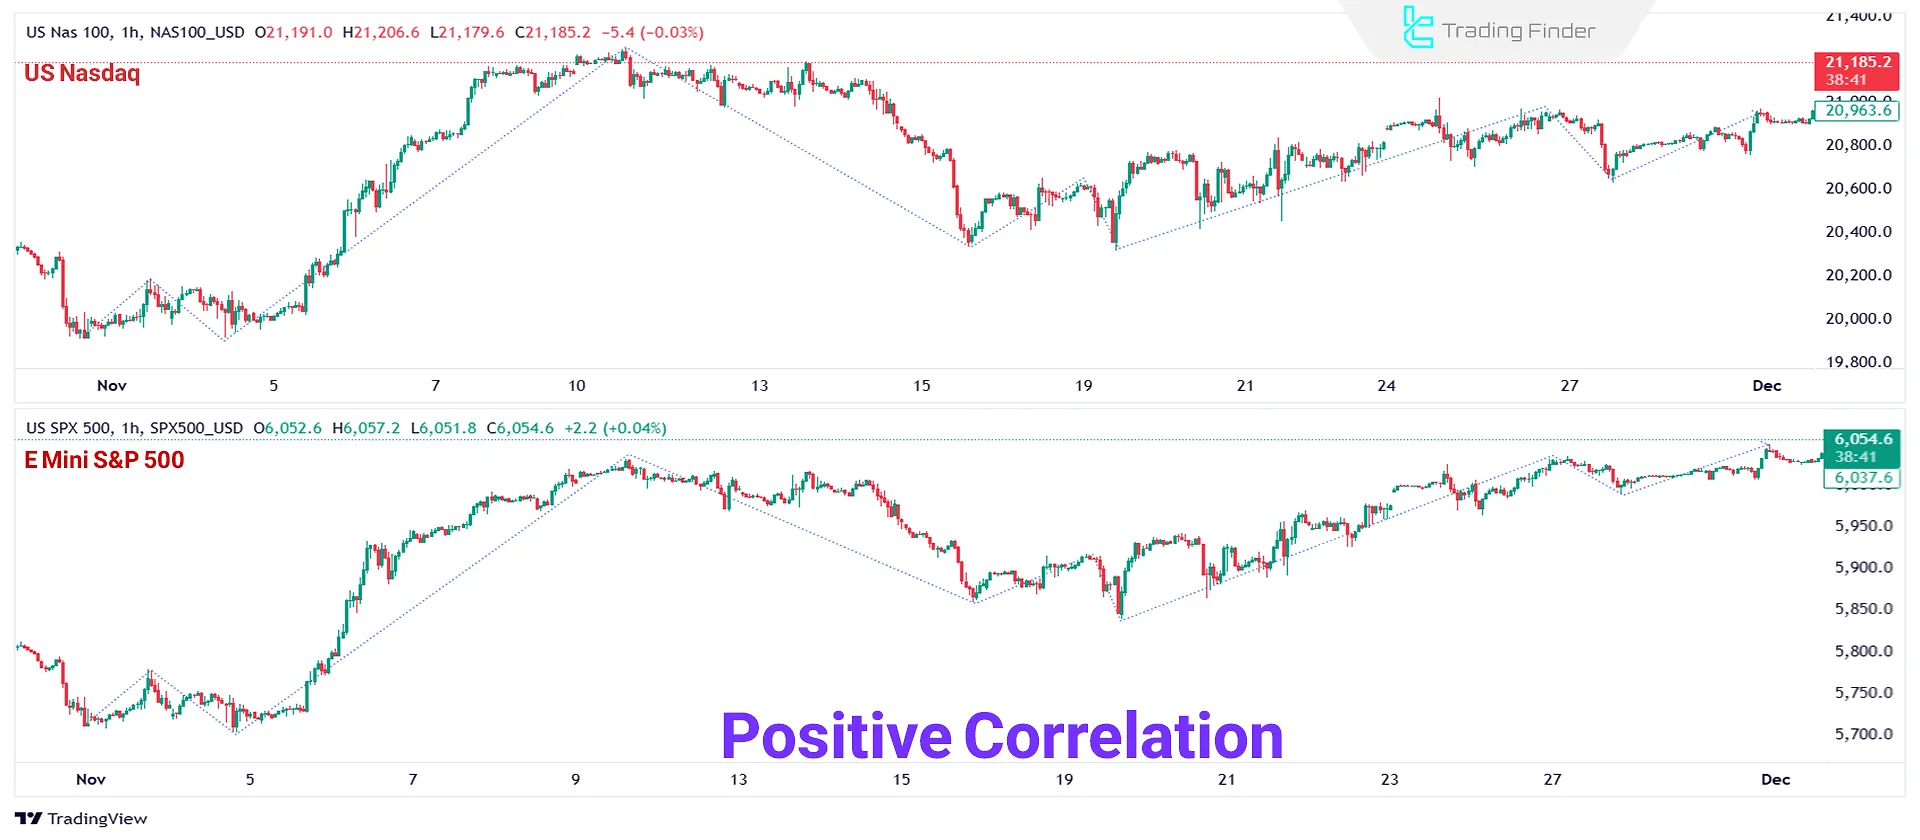
The behavior of two assets must normally be aligned so that comparing the price flow becomes meaningful. This alignment is seen in correlated currency pairs such as EURUSD and GBPUSD or in major indices like the S&P 500 and NQ, and it forms the foundation of SMT analysis.
Structural Difference or Divergence in the Price Path of Two Assets
Divergence forms when one of the assets deviates from the usual rhythm and builds a conflicting structure. One asset registers a higher high, but the correlated asset is unable to form a new high.
In the opposite scenario, one asset creates a lower low while the other asset forms a higher low. This structural mismatch forms the core of SMT divergence and reveals the shift of power between the buy side and the sell side.
Smart Money Footprint in the Divergence Zone
The validity of SMT divergence increases when signs of smart money intervention are observed in the same zone.
Key elements of the ICT style such as liquidity levels, order blocks (Order Blocks), fair value gap (FVG), and PD Array structures manifest the presence of major institutions within the price flow.
Combining these signals with the structural contrast between the two assets shows that the behavioral difference is not accidental and originates from liquidity displacement and price flow.
For a better understanding of SMT divergence in ICT style, the educational video of the TTrades channel on YouTube can also be referenced. In this video, divergence or convergence between the NQ and S&P 500 indices is also examined.
How to Use ICT SMT Divergence?
ICT SMT Divergence acts as a potential reversal signal for correlated assets.
When two positively correlated assets are trending upward, but one forms a Higher High (HH), while the other fails to do so, it signals a potential trap for traders.
This divergence indicatesmarket weakness and suggests a possible reversal for these assets.
ICT SMT Divergence can be used between two correlated assets as a trading strategy. When their price charts interact with the Premium/Discount Array (PD Array) on a higher timeframe, it provides confirmation to enter a trade.
Positive and Negative Correlations in ICT SMT
There are two main types of divergence: Positive and Negative.
Positive Correlation
A positive correlation occurs when two assets generally move in the same direction.
In forex markets, EUR/USD and GBP/USD pairs often move together. Similarly, ES (S&P 500) and Nasdaq (NQ 100) display symmetrical movements in indices.
Bitcoin (BTC) and Ethereum (ETH) are examples of assets reflecting symmetrical correlation in the crypto market.
Negative Correlation
A negativecorrelation occurs when two assets move in opposite directions. For example, the US Dollar Index (DXY) and EUR/USD pairs often exhibit inverse correlation in the forex market.
Bitcoin (BTC) and the US Dollar Index (USDXY)correlate negatively in the crypto market.
Example of Positive, Negative and Non-Correlation
In identifying SMT divergence, recognizing the type of correlation between assets is highly important. In the table below, we refer to examples of different types of correlations:
Type of correlation | Sample assets | Description |
Positive correlation | USD/USD – EUR/GBP | Common influence from similar economic factors |
USD/USD – AUD/NZD | Similarity of economic structure and dependence on the commodity market | |
Negative correlation | XAU/USD – DXY | Increase in the value of the dollar against the decrease in gold attractiveness |
Crude oil – airline stocks (JETS) | Increase in fuel costs versus decline in stock value | |
No correlation | Technology stocks – cryptocurrencies | Difference in fundamental drivers and market behavior |
Application of SMT divergence in different markets (Forex, Crypto, Indices and Commodities)
SMT divergence is not limited only to the forex market, and it can be used in any market where correlation exists between two assets.
This concept is used in related forex currency pairs, indices such as NASDAQ and S&P500, correlated crypto assets such as BTC and ETH, and also commodities such as gold and silver or oil and energy indices.
In all these markets, the behavioral difference between two correlated assets can create an opportunity for SMT formation.
Identifying Types of SMT Divergence in ICT Style
Based on the overall direction of market movement, SMT divergence within the analytical framework of ICT style is identified and categorized into two main groups, namely bullish divergence and bearish divergence.
In the following, we examine these two with more details.
Bullish SMT Divergence
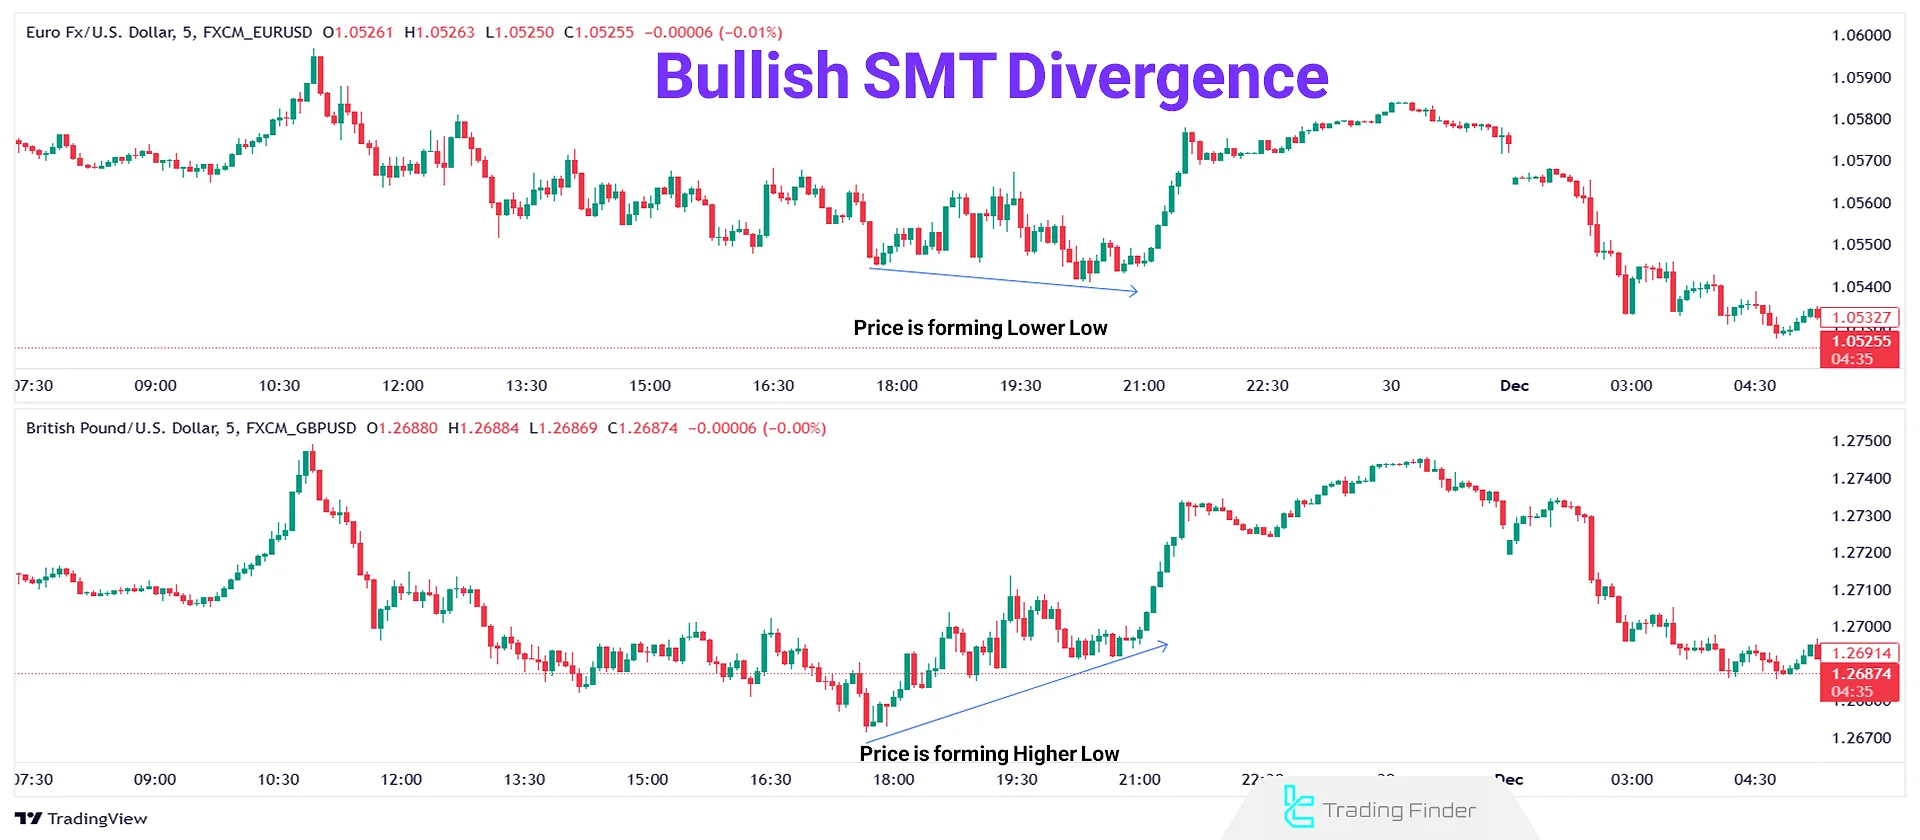
Bullish SMT Divergence in positively correlated assets occurs whenboth are trending downward, but one forms a Lower Low (LL) while the other forms a Higher Low (HL).
In negatively correlated assets, Bullish SMT Divergence happens when one asset creates a Lower High (LH), while the other forms a Lower Low (LL) instead of a Higher Low (HL).
A specific asset that forms a Lower Low (LL) instead of a Higher Low (HL) is considered manipulated, and the SMT divergence in it indicates a bullish reversal.
Bearish SMT Divergence
Bearish SMT Divergence occurs in positively correlated assets when both are trending upward. It happens when one asset forms a Higher High (HH), while the other forms a Lower High (LH.)
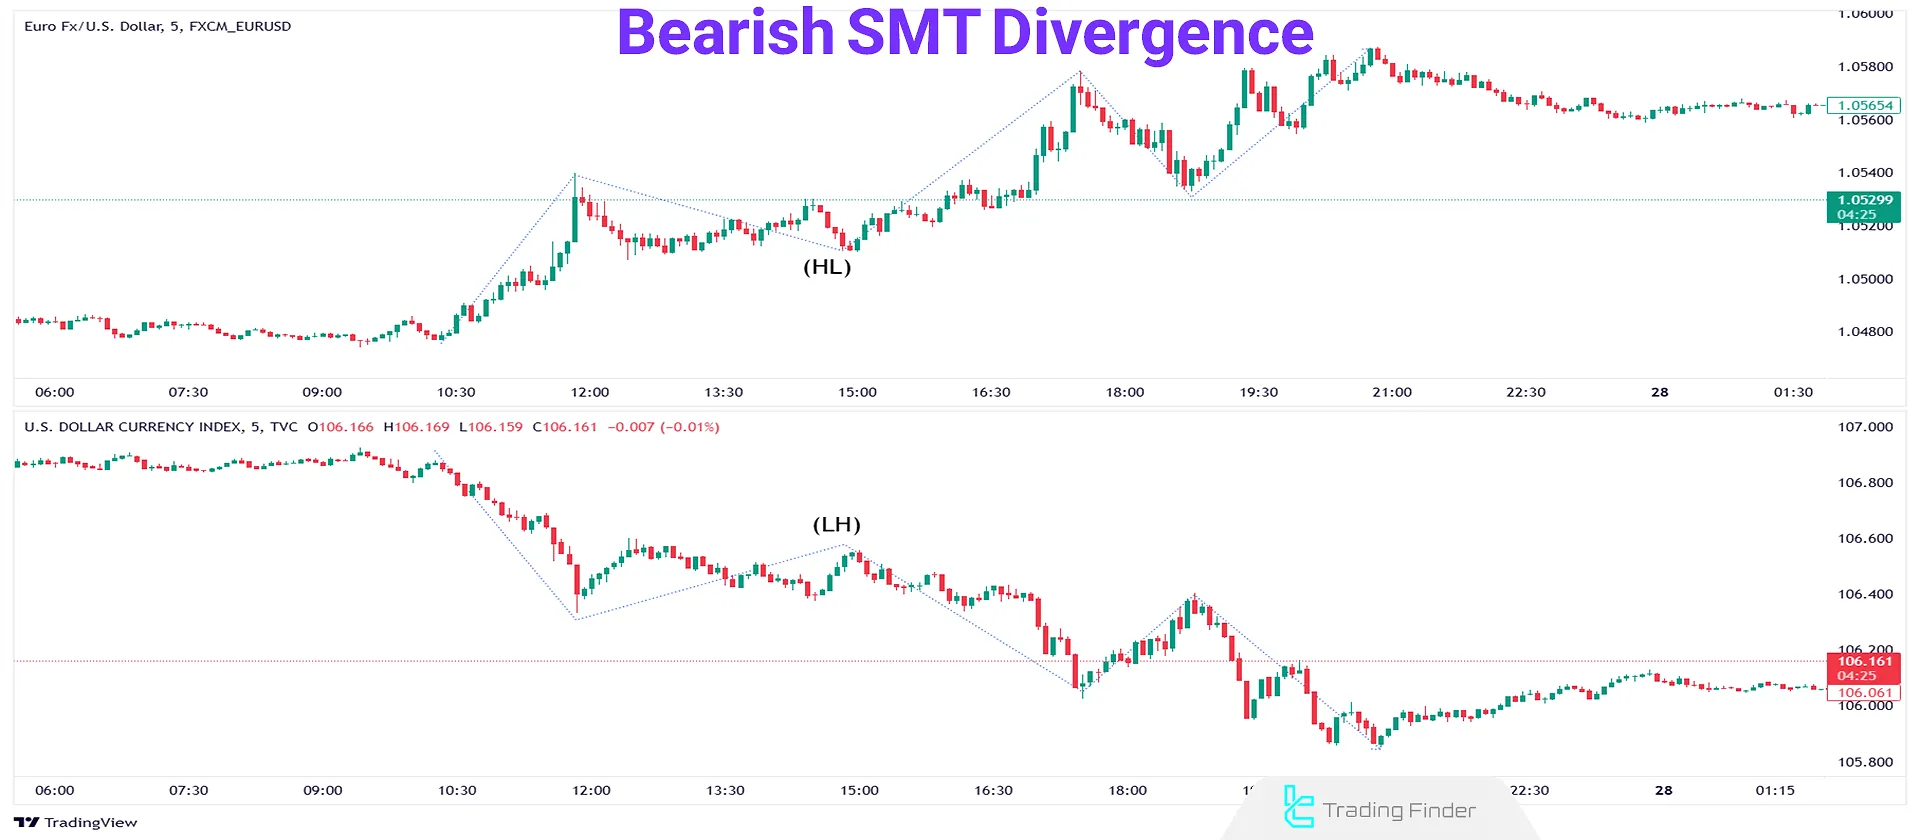
For negatively correlated assets, Bearish SMT Divergence happens when one asset forms a Higher Low (HL); while the other forms a Lower High (LH) instead of a Higher High (HH).
Therefore, an asset that forms a Lower High (LH) instead of a Higher High (HH) is considered manipulated, and the SMT divergence in it indicates a bearish reversal.
How to Trade with SMT Divergence
For trading with SMT divergence in ICT style, divergence only plays the role of a “confirming” factor and is not the main entry point.
SMT divergence becomes important when it forms in a key zone; a place where liquidity is active and smart money behavior defines the market direction.
Therefore, price must first reach structures such as Order Block, FVG, PD Array elements, or liquidity ranges so that the price reaction in these zones becomes valid, and then SMT divergence acts as confirmation of the order flow.
Buy and sell scenarios after price reaches the key zone:
- Buy scenario: bullish SMT, formation of bullish FVG, pullback and entry, stop loss below the FVG, target with 1:3 ratio or next liquidity;
- Sell scenario: bearish SMT, price reaching a bearish Order Block, retracement and entry, stop loss above the OB, target with 1:3 ratio or lower liquidity.
The educational article about ICT-style divergence on the writofinance.com website examines different bullish and bearish SMT divergence scenarios in various market currency pairs, which interested readers can refer to.
Indicator of Smart Money Divergence of Indices (SMT Divergence Indices ICT) in Metatrader
The SMT Divergence Indices ICT indicator in the Metatrader platform is one of the specialized ICT-style tools designed for comparative analysis of three powerful market indices, namely Dow Jones (DJI), NASDAQ (NASDAQ) and S&P 500.
The purpose of this tool is to extract hidden ICT-style SMT divergence between the movement structure of these indices and provide signals that can reveal changes in liquidity flow and power displacement in the market.
This indicator detects three important types of divergence, including trendline divergence, High/Low divergence and SMT divergence in ICT, and allows traders to use the disharmonic behavior between indices as high-precision trading signals.
- Download the indicator of Smart Money divergence of indices for MT5
- Download the indicator of Smart Money divergence of indices for MT4
Considering the multi-dimensional nature of SMT analysis, this tool has very high applicability in day trading strategies, scalping and multi-timeframe analysis, and in addition to forex traders, it is also usable for stock market and index traders.
When one of the indices forms a low or high different from the other two indices, the indicator marks the divergence and warns of the probability of the start of a new trend; an issue that, in ICT style, is exactly important for identifying the direction of liquidity flow.
In the settings section, the user can select the three desired symbols in the Symbols section, and then control the display settings of trendline divergence, High/Low divergence, SMT detection and allowed distance between swings through the Divergence section.
This level of customization allows the indicator to be fully adjusted according to the trader’s strategy and the signals to be displayed with higher accuracy.
In real charts, when, for example, Dow Jones and S&P 500 have a bearish structure but NASDAQ shows a bullish pattern, the indicator identifies trendline divergence and announces the probability of a general market direction change.
The same matter is seen in High divergences as well; where the difference in highs can determine the beginning of a bearish trend.
In total, best smt divergence indicator is a valuable tool for ICT-style traders that provides the ability to observe structural differences between indices and helps identify precise entry and exit points.
Optimal Timeframe for Identifying ICT SMT Divergence
SMT divergence is a suitable technique for identifying entry points to a trade, and for this reason, the best result is obtained when this divergence is examined on the 15-minute timeframe or lower.
In higher timeframes, the formation of SMT divergence requires more time and the suitable opportunity for entering a trade may be lost.
Using this technique in shorter timeframes provides the possibility of fast reaction to market changes and better management of trading positions.
Common Mistakes of Traders in Using SMT Divergence in ICT
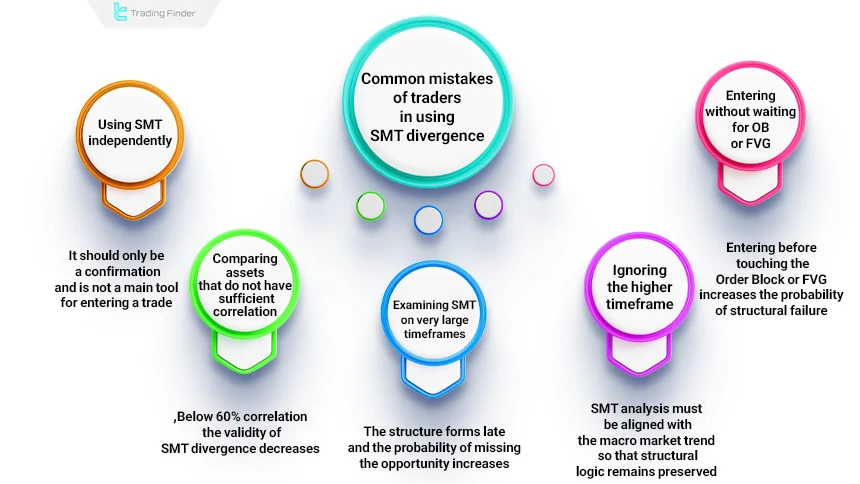
Traders sometimes make several common mistakes when using SMT, and these mistakes reduce analytical accuracy:
- Using SMT independently: SMT should only be a confirmation and not the main tool for entering a trade;
- Comparing assets that do not have sufficient correlation: If the correlation level is below 60%, SMT divergence does not have the required validity;
- Examining SMT on very large timeframes: The formation of structures takes a long time and there is a possibility of missing the opportunity;
- Ignoring the higher timeframe: SMT must be analyzed in line with the macro direction of the market so that its structural logic remains preserved;
- Entering without waiting for OB or FVG: Premature entry before touching the Order Block or the Fair Value Gap (FVG) increases the probability of structural failure.
Conclusion
SMT divergence in ICT style, by comparing price behavior of correlated assets, signals weakness or possible trend change, and disharmony between them indicates reduced strength of the current trend.
By examining two correlated charts simultaneously, SMT reveals subtle differences in market structure, usually on 15-minute timeframes or lower.
It helps identify fake moves, accumulation and distribution phases, and confirm or reject potential entry scenarios.
In advanced use, SMT more precisely shows liquidity direction and likely stop-hunt areas, as behavioral differences between correlated assets often indicate liquidity concentration on one side of the market and increase the probability of spotting high-potential reversal points.


