


Standard Deviation and Fibonacci in the ICT trading style are used to identify price targets, retracement zones, and price reversals.
These tools allow traders to determine entry and exit points while analyzing deviations to predict market trends.
What is the Concept of Standard Deviation in ICT Style?
Standard Deviation is a key statistical concept that measures the dispersion of data relative to its mean. In technical analysis, this concept is used to forecast future price levels.
What is the Fibonacci Tool, and How is It Used in the ICT Style?
Standard Deviation projections serve as a tool for identifying price targets, retracement zones, reversals, and convergence with other technical analysis strategies.
These projections help traders pinpoint potential trend change areas.
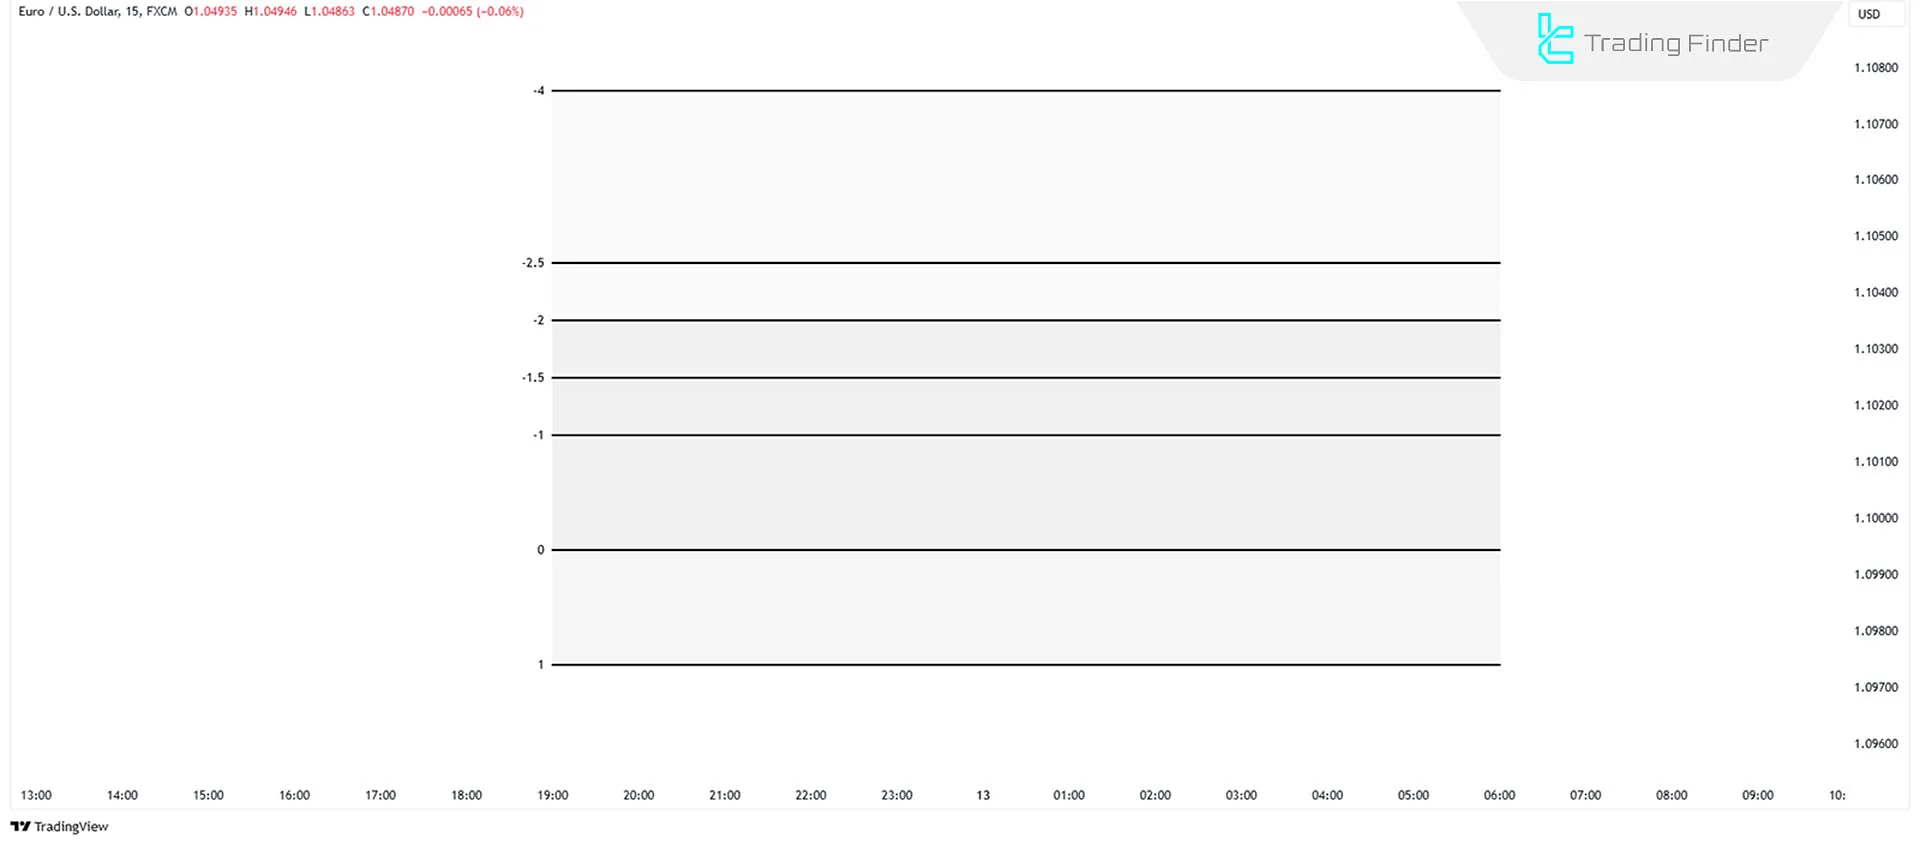
Fibonacci Settings in the Standard Deviation Tool
The Fibonacci settings in the Standard Deviation tool, specifically for the ICT trading style, are as follows:
- 1
- 0
- -1
- -2
- -2.5
- -4
These levels represent different zones of price retracement and expansion. Using these settings, traders can identify key price areas and utilize them as entry or exit points.
How to Use the Fibonacci Tool to Forecast Price Movements?
To use the Fibonacci tool in market analysis, the first step is to identify anchoring points or the main leg of movement.
These points usually emerge when the price is in a strong trend and then experiences a corrective move or a structural shift.
#1 Identifying the Smart Money Reversal Point
When the price is in an uptrend or downtrend and a minor retracement or manipulation leg forms, this point can be considered the starting point for drawing Fibonacci levels.
#2 Predicting Targets and Key Zones
Once the manipulation leg is identified, the Fibonacci tool is drawn from the Low to the High or vice versa, marking the standard deviation zones.
These zones, including -2, -2.5, and -4 levels, are key areas for price projection and market targeting.
Application of the Standard Deviation Tool
The Standard Deviation tool helps identify retracement levels and price reversals. When the price reaches -2 to -2.5, a retracement or trend reversal is likely.
If the price surpasses these zones and closes beyond them, it may continue towards the -4 level, indicating maximum price expansion.
Convergence with Other Technical Analysis Tools
One significant advantage of Standard Deviation projections in the ICT trading style is their alignment with other technical tools, such as PD Arrays, Fair Value Gaps (FVG), and Confluence Levels.
Integrating Standard Deviation with other tools enhances accuracy.
- PD Arrays: These help identify significant price levels aligning with standard deviation zones. They consist of Fair Value Gaps FVGs and confluence levels, providing optimal trade entry points.
- Confluence Levels: When Standard Deviation projections align with other key levels, such as price reversals or gaps, the accuracy of the predictions increases.
Combining Standard Deviation and Fibonacci in ICT Style
In ICT trading, Fibonacci and Standard Deviation tools are combined to identify key market zones.
This approach simplifies analysis; drawing the Fibonacci tool automatically makes the standard deviation levels visible.
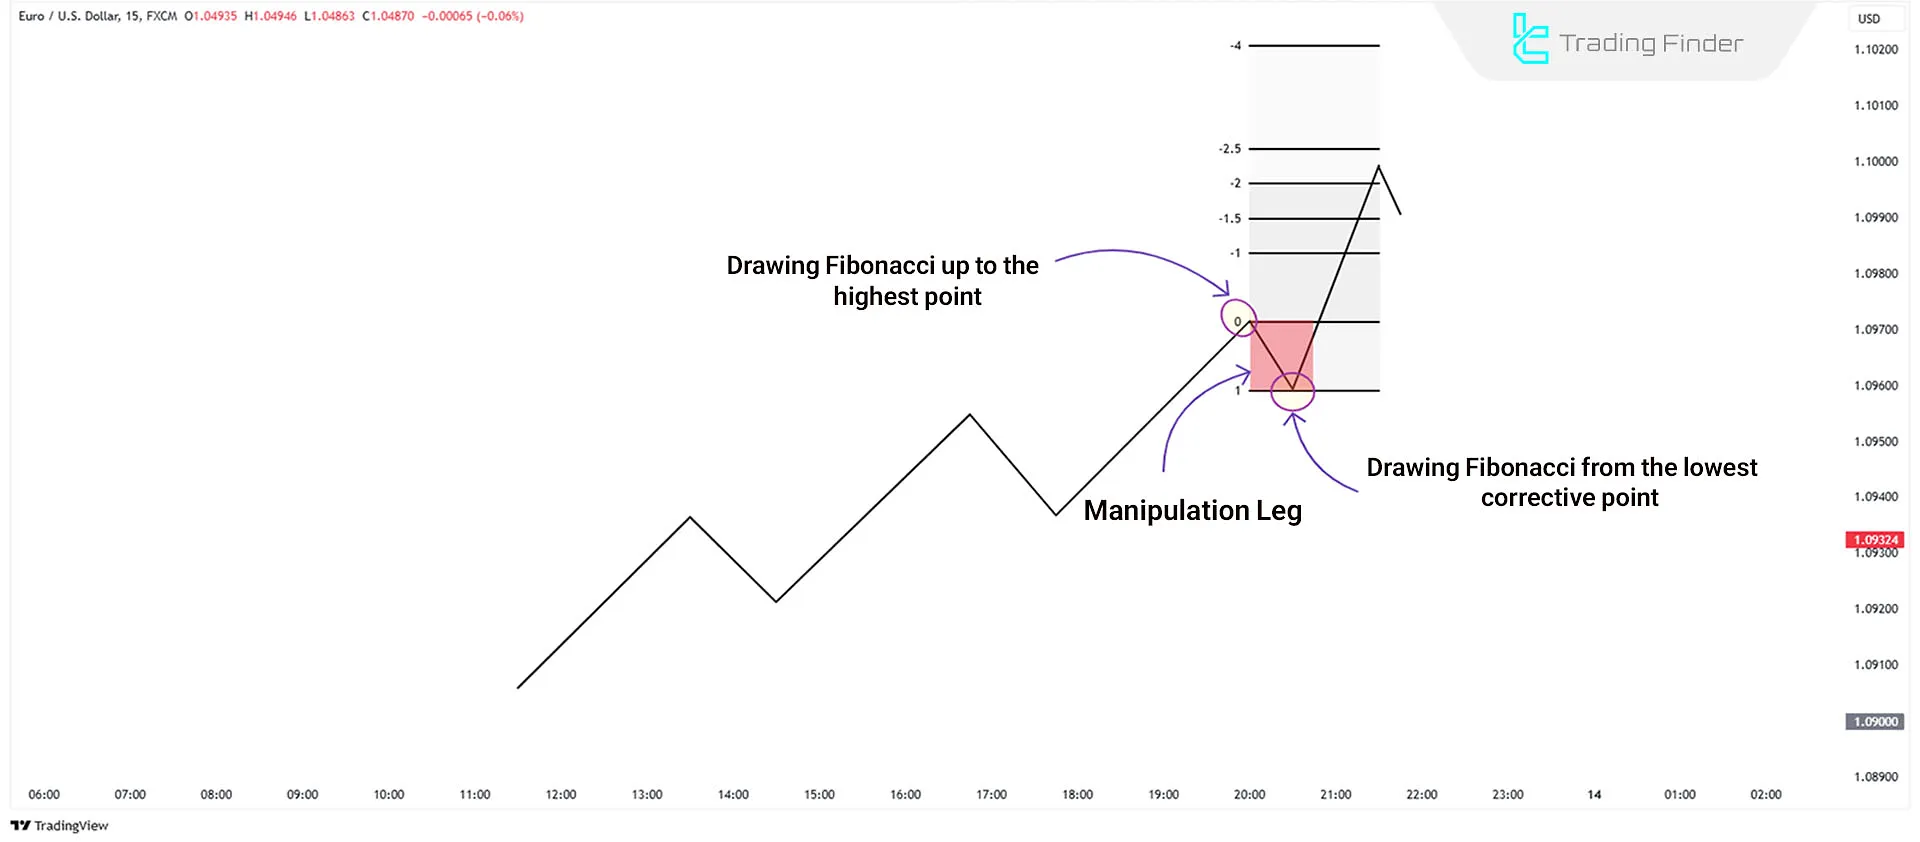
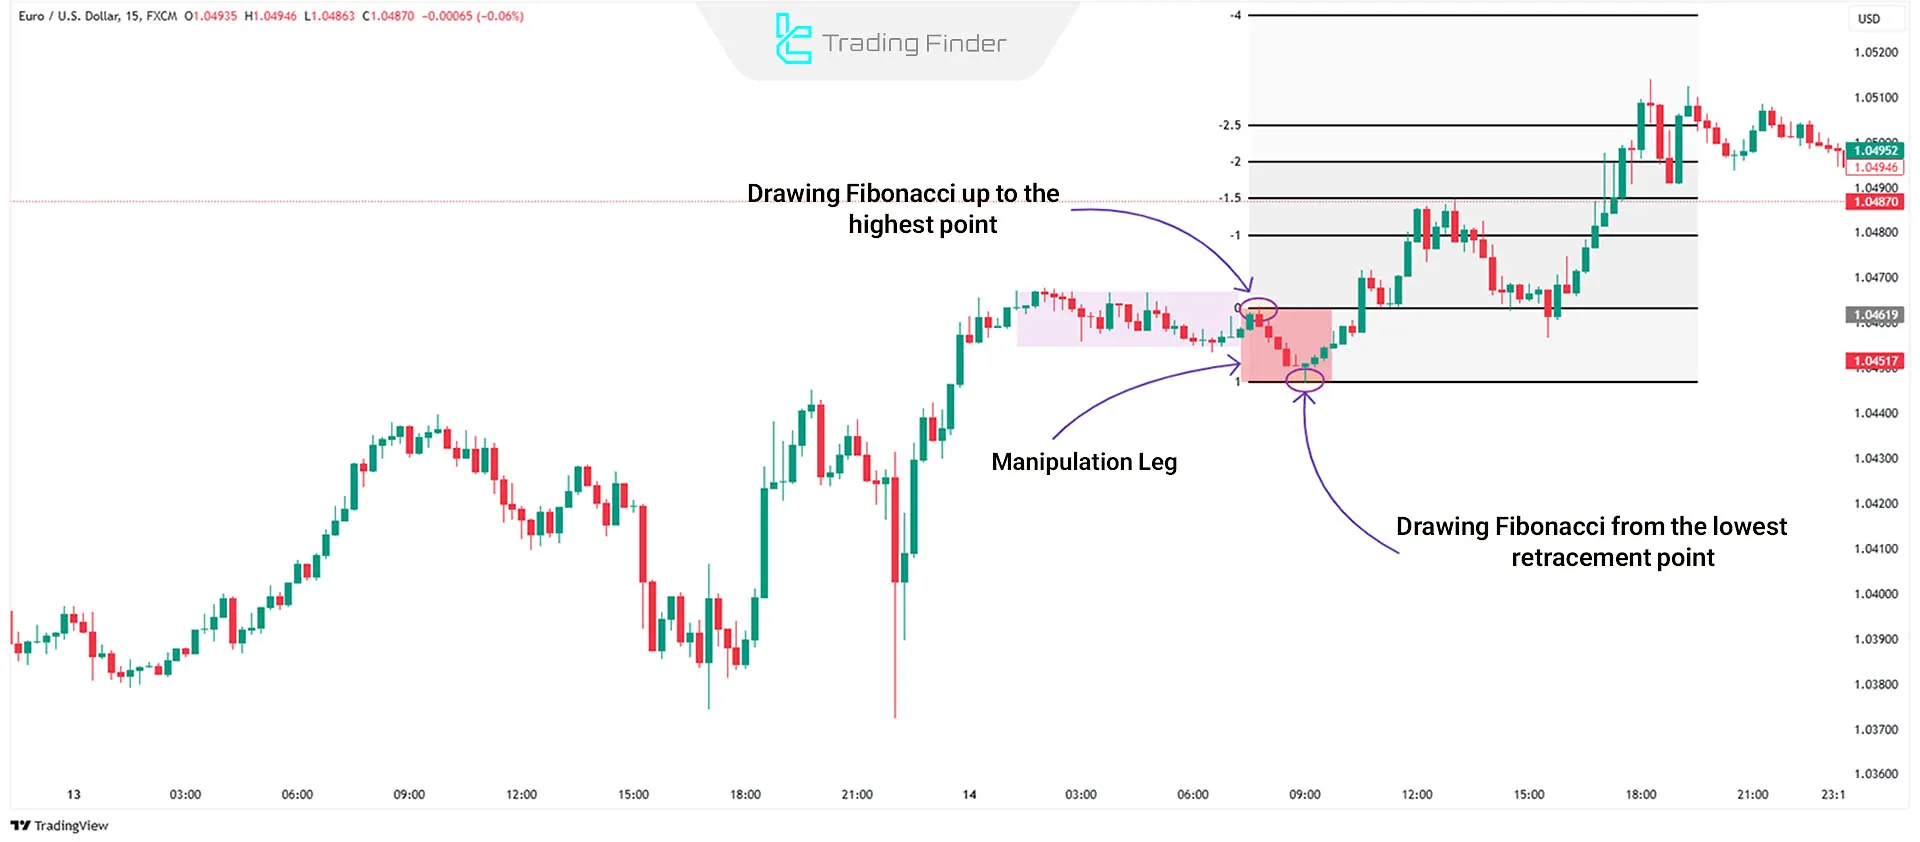
Example of Bullish Standard Deviation and Fibonacci Analysis
TheEUR/USD 15-minute chart, the Fibonacci tool is drawn over a manipulation leg. After a ranging phase, the market moves aggressively downward due to smart money intervention before reversing to the upside.
Using the specialized Fibonacci settings, the tool is drawn from the lowest part to the highest point of the corrective leg, revealing expansion levels for upcoming price movements.
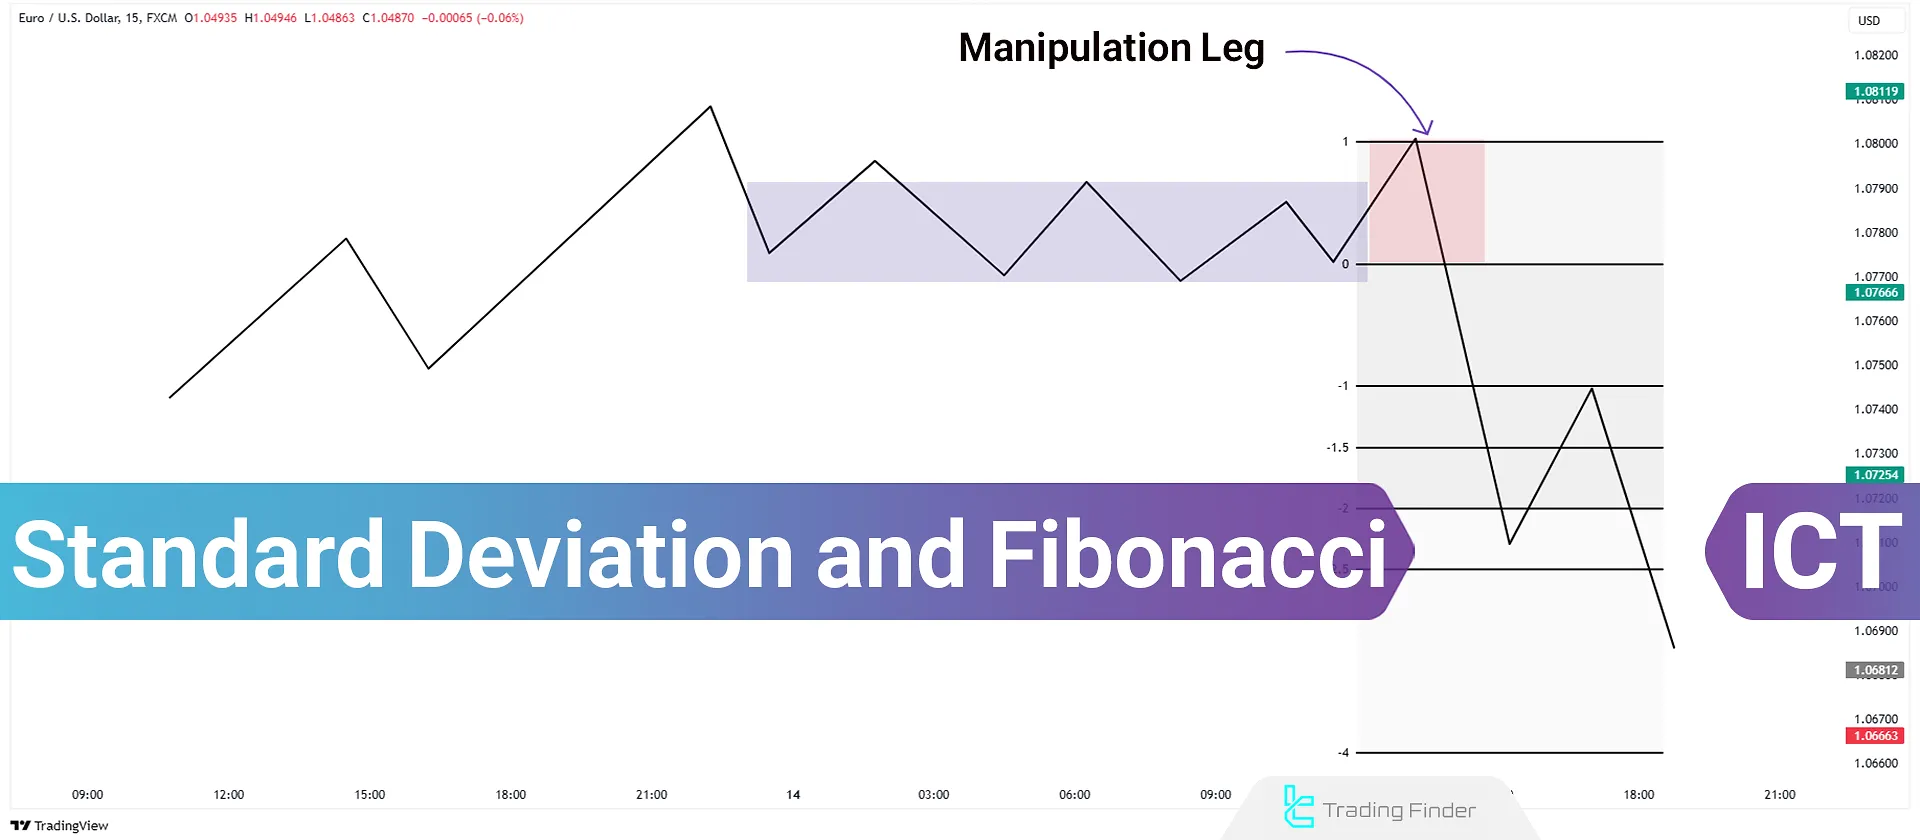
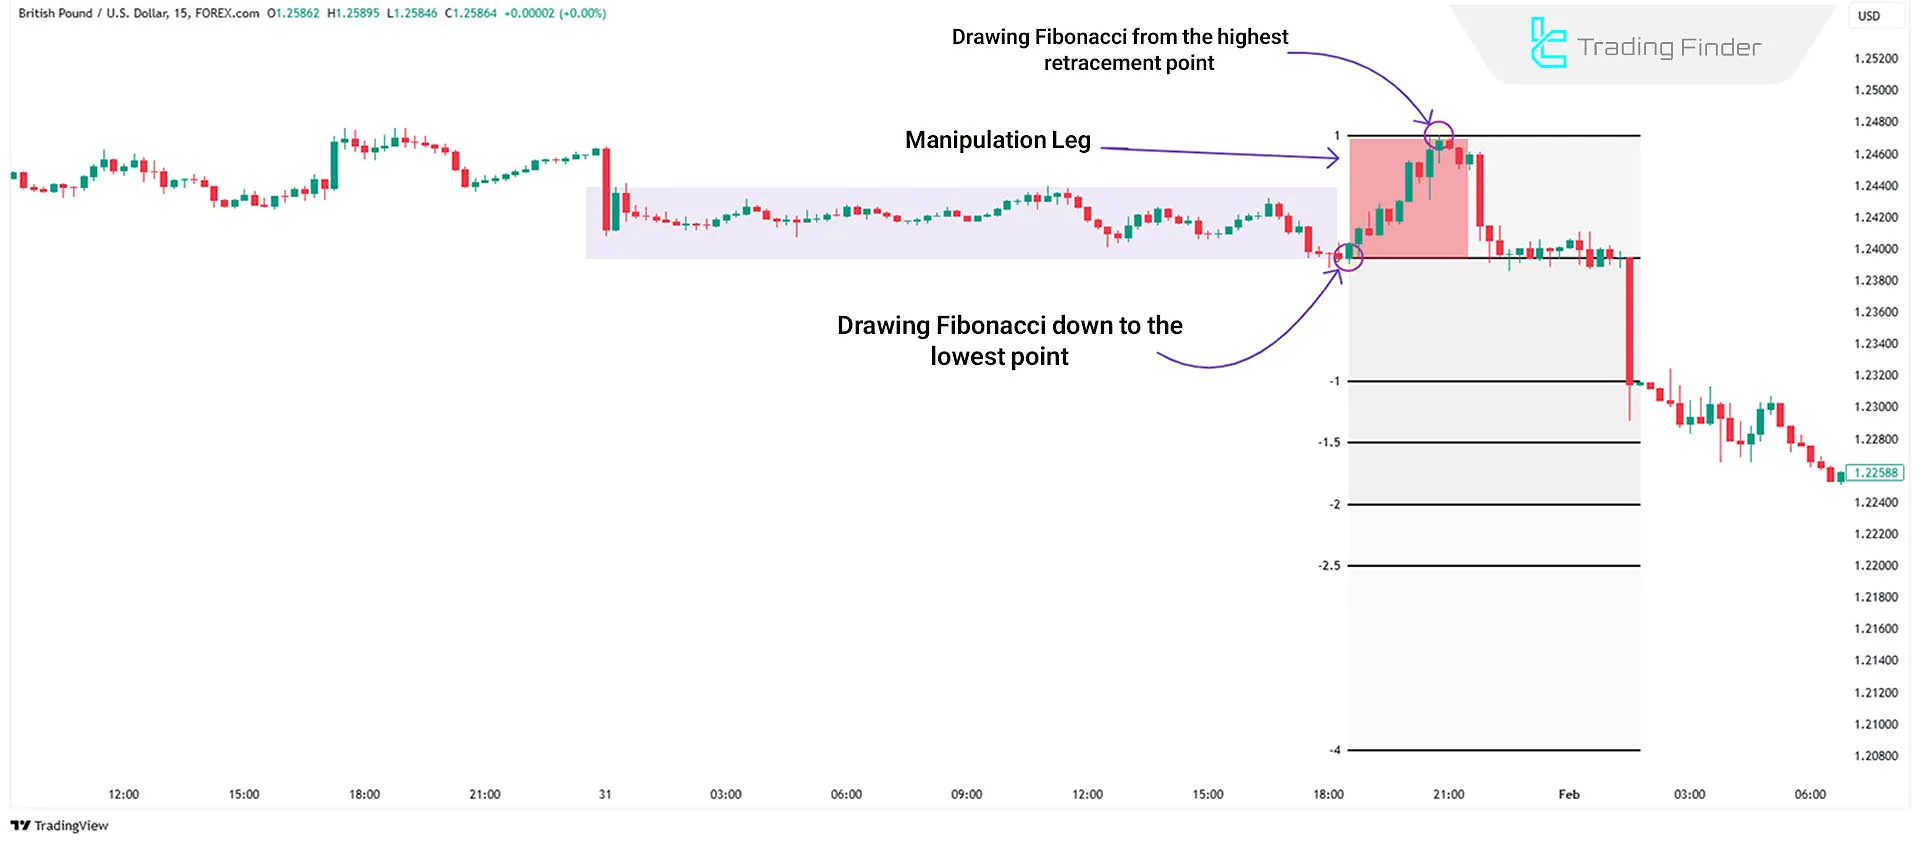
Example of Bearish Standard Deviation and Fibonacci Analysis
TheGBP/USD 15-minute chart, the Fibonacci tool is applied to a bearish manipulation leg. After a price range formation, the market initially moves aggressively upward before reversing downward due to smart money intervention.
By applying the specialized Fibonacci settings, the tool is drawn from the highest point to the lowest part of the corrective leg, revealing expansion levels in the downward direction.
Conclusion
In the ICT trading style, combining Standard Deviation and Fibonacci tools helps predict price movements effectively.
Standard Deviation assists in forecasting retracement and price reversal zones, while Fibonacci determines retracement and expansion levels.
This combination is particularly useful for identifying manipulation legs and market structure shifts.


