


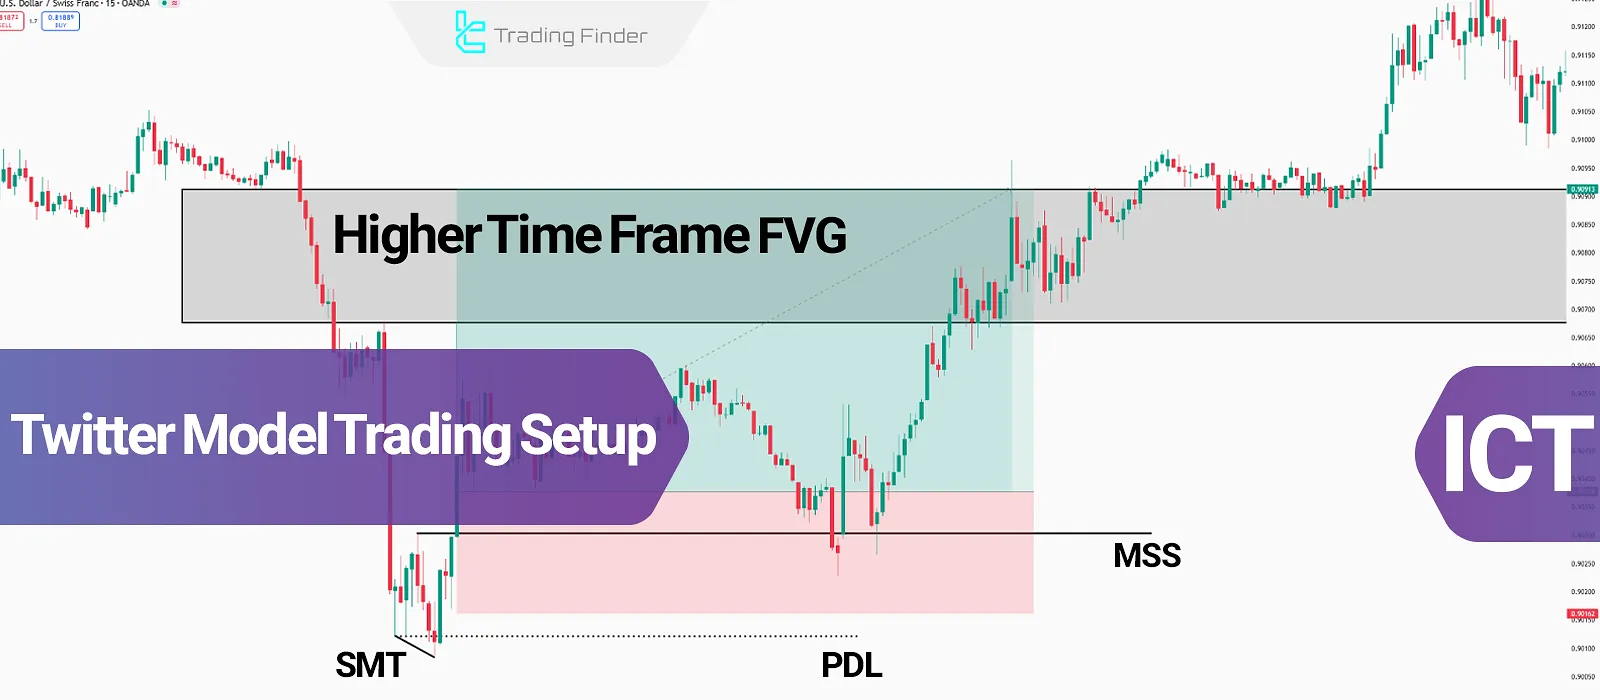
The Twitter Model trading setup is essentially an advanced pattern based on market structure in the ICT style, where concepts such as Market Structure Shift (MSS), Fair Value Gap (FVG), and daily key levels like Previous Day High (PDH) and Previous Day Low (PDL) are simultaneously analyzed.
When price imbalance forms on the chart, this strategy provides a framework to ensure entries are aligned with liquidity and order flow. Meanwhile, many analysts in the ict twitter space share their experiences and real-world examples of this method.
Under such conditions, the trader can rely on the overlap of FVG with PDH or PDL levels to determine precise entry and exit points, while optimizing risk management based on key market moves.
ICT Concepts in the Twitter Model Trading Setup
The Twitter Model setup is built upon multiple ICT concepts analyzed across different timeframes:
The Twitter Model ICT trading setup operates by combining different concepts across multiple timeframes. This model is recognized as an advanced framework in ict trading twitter discussions.
The publication of certain ict tweets about this strategy has introduced more traders to its approach.
Table of key concepts also highlighted in educational content such as fx evolution twitter:
Concept | Explanation | Application in Twitter Model ICT Setup |
Market Structure Shift (MSS) | Market structure change through a break of Swing High or Swing Low | Identifying medium-term trend reversals and confirming entry after a valid breakout |
Smart Money Divergence (SMT) | Movement discrepancy between correlated assets, revealing false breaks or liquidity grabs | Determining smart money positioning and identifying early entry or exit signals |
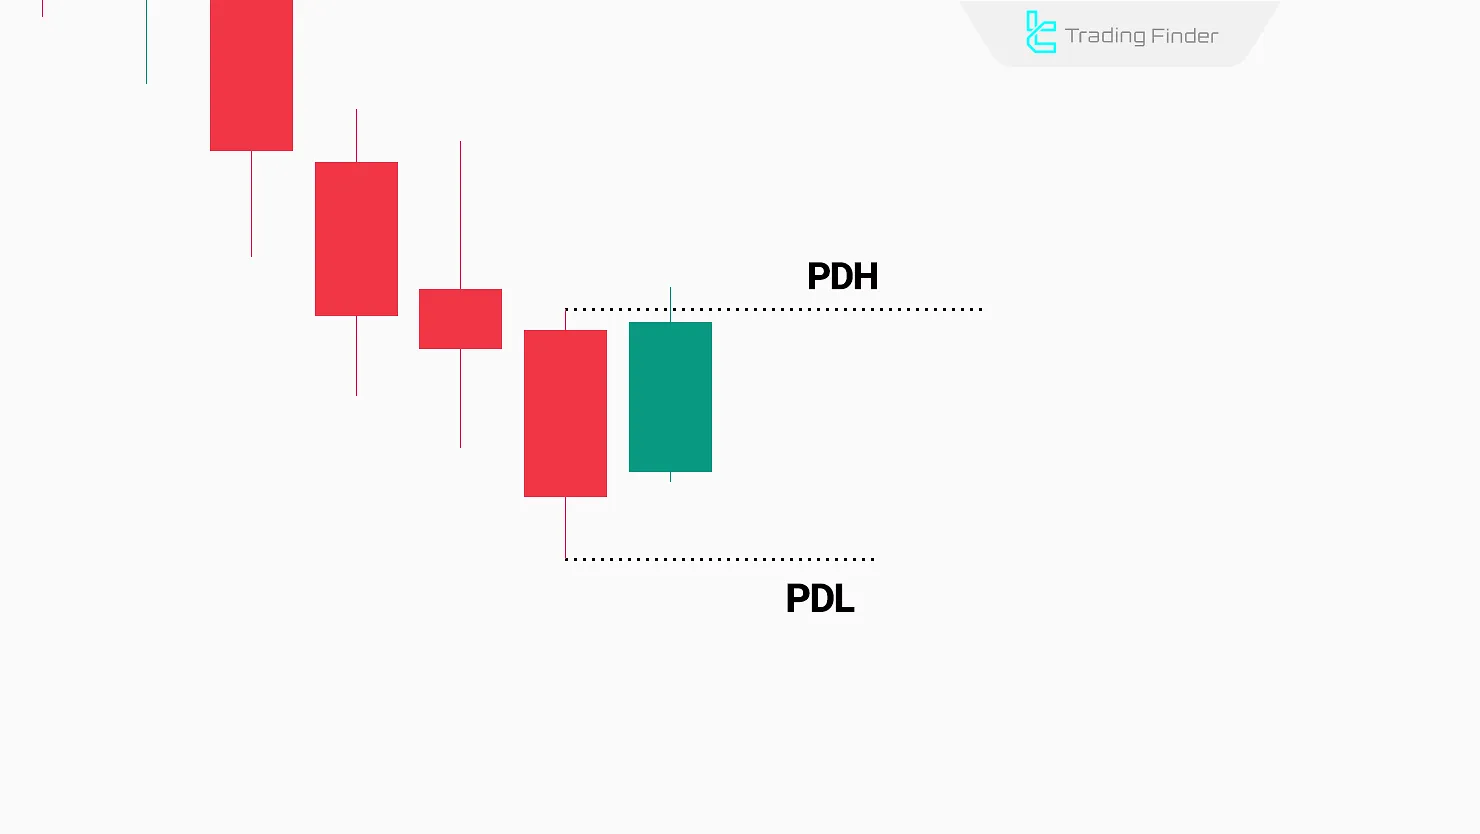
Previous Day Low (PDL) | The lowest price of the previous trading day | Acts as a liquidity level or potential support in bullish trends |
Previous Day High (PDH) | The highest price of the previous trading day | Acts as a liquidity level or potential resistance in bearish trends |
Fair Value Gap (FVG) | Price gap among three consecutive candles indicating liquidity imbalance | Key zones for entries and gap fills within the trading setup |
Twitter Model Setup; Identification and Trading Steps
The Twitter Model strategy is one of the ICT trading setups, where each component is analyzed and identified on a different timeframe.
On the TTrades YouTube channel, the Twitter Model trading setup (ICT Twitter Model) has been taught in the video below:
Formation Steps of the Twitter Model
Before applying the Twitter Model, the first task is to establish a clear reference point for divergence using the higher-timeframe structure.
- Identify PDH or PDL on the daily timeframe as the divergence reference level;
- Mark Midnight Open to assess the trade direction (Buy/Sell);
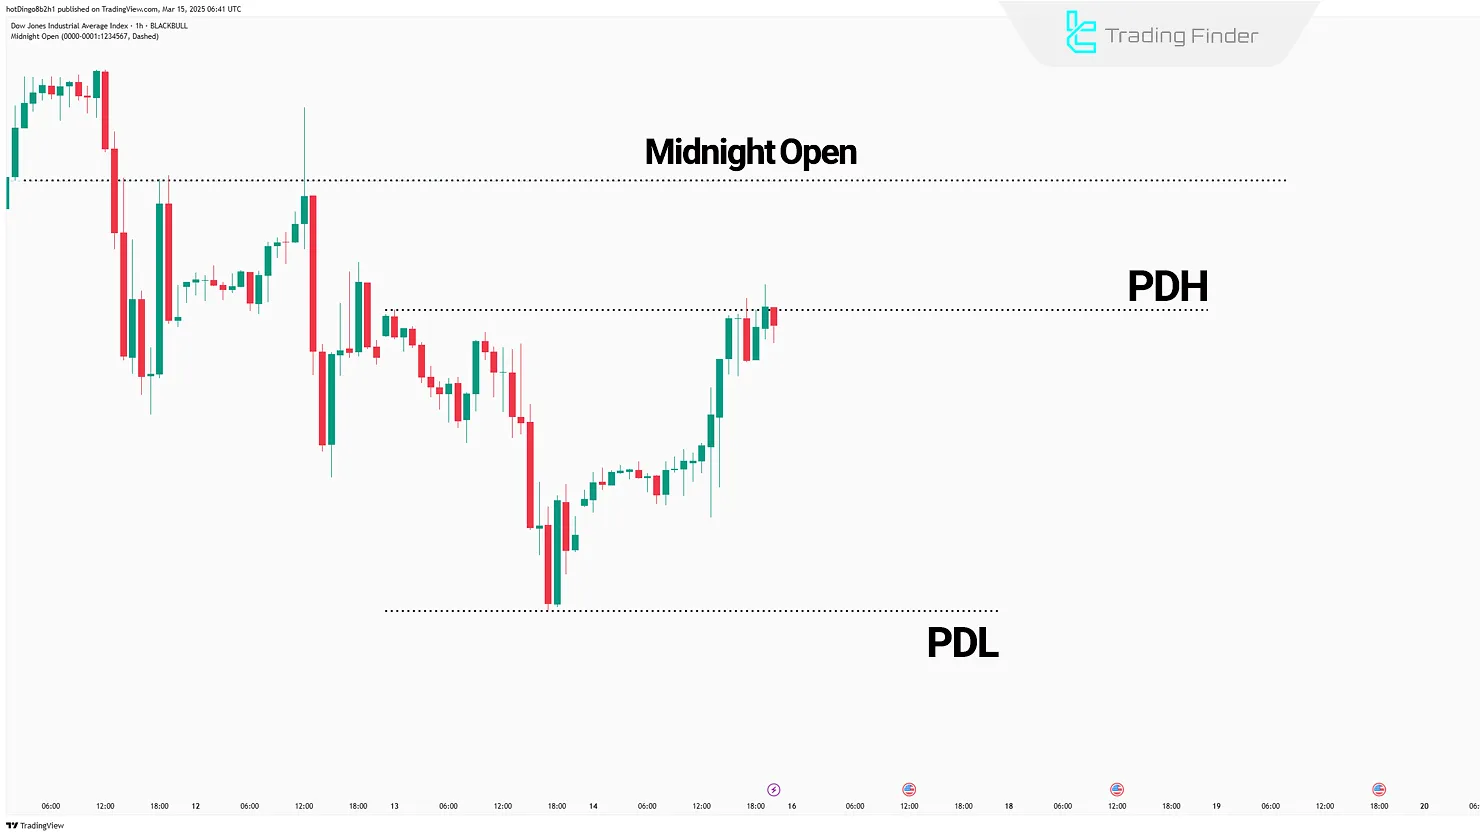 Defining Midnight Open to determine direction in Twitter Model Setup
 - Spot Fair Value Gap(FVG) in the 1-hour timeframe as the price zone is likely to return to;
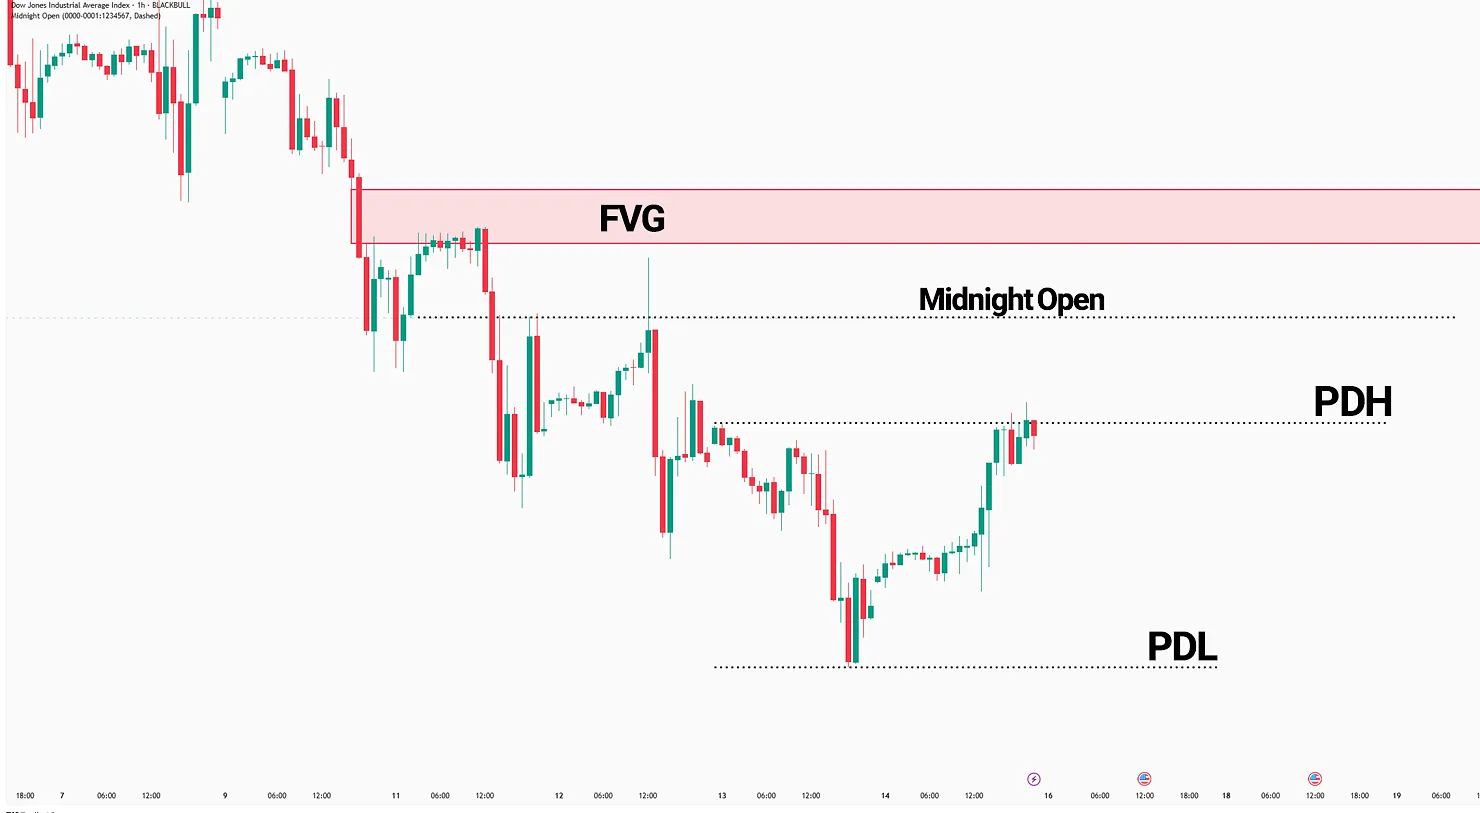
- Look for SMT Divergence to PDH/PDL on the 15-minute timeframe;
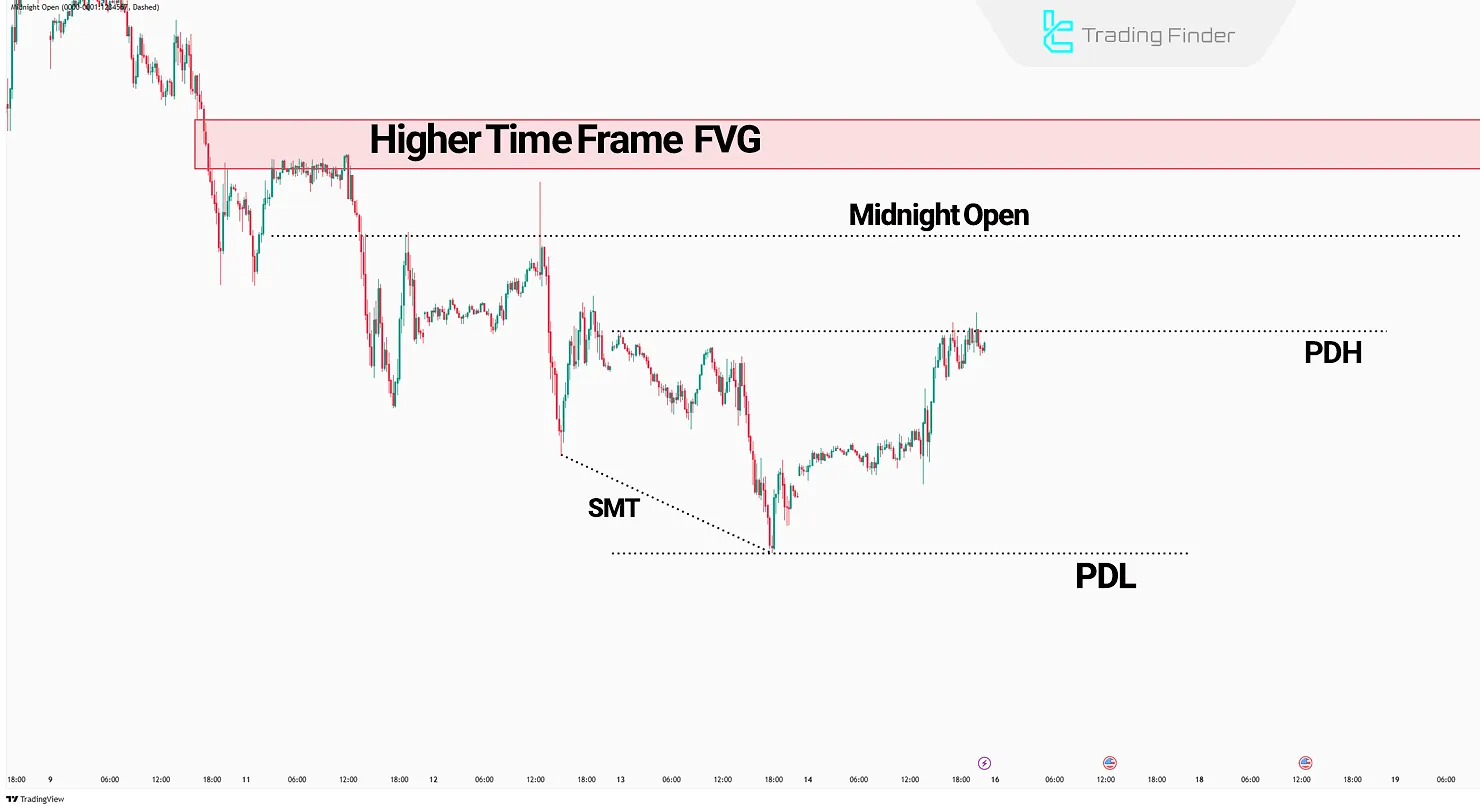
- Confirm Market Structure Shift (MSS) in the 15-minute timeframe.
Entry is valid only if all conditions above are confirmed. If any are missing, the setup is invalid, and no trade should be taken.
Trading Steps Using the Twitter Model Setup
After confirming the Market Structure Shift (MSS), trade orders are placed as follows.
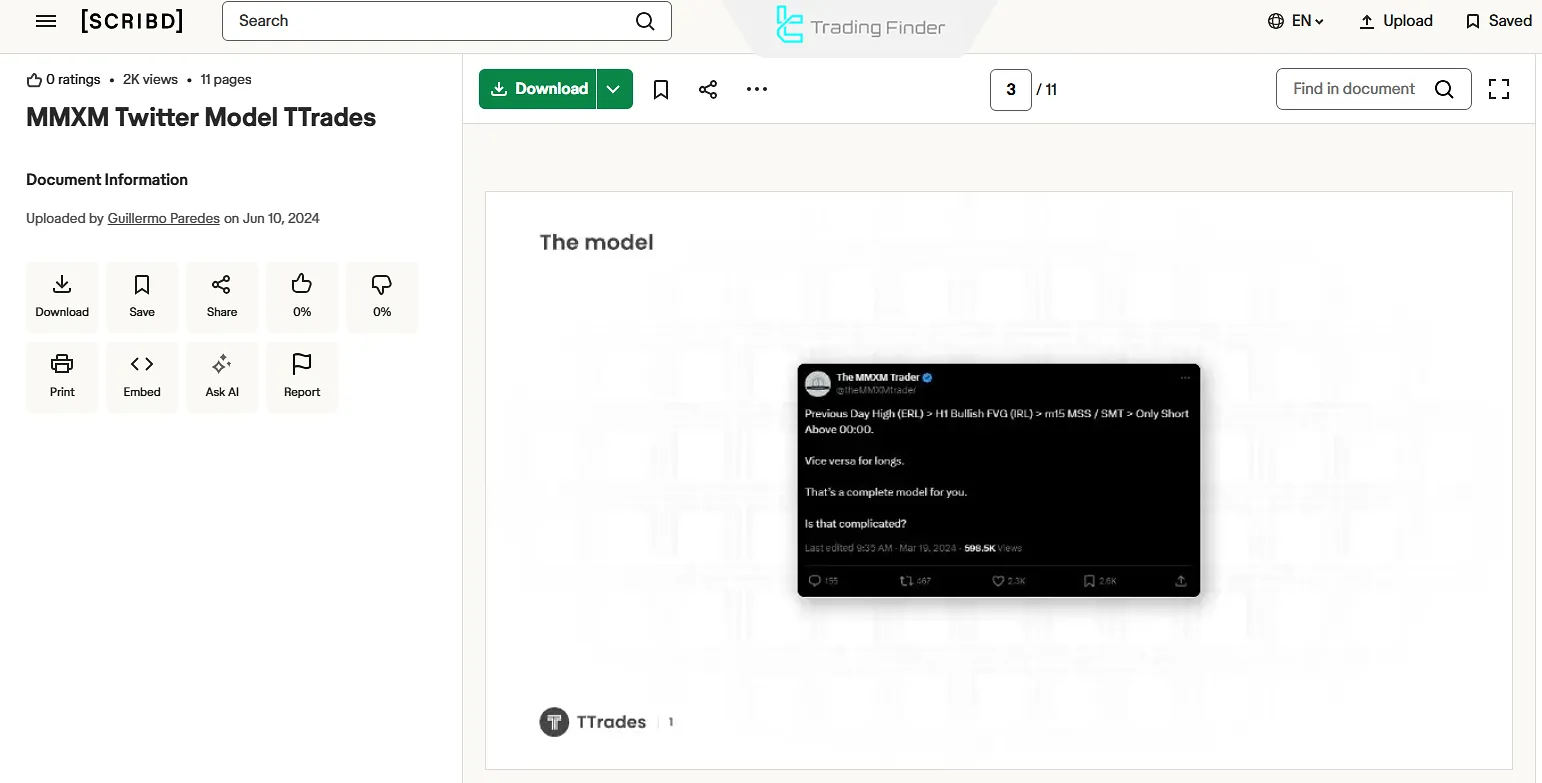
The ICT Twitter Model trading setup tutorial has been made available as a PDF file for download on scribd.com.
Entry Points
Entry selection within the Twitter Model depends on balancing risk-to-reward efficiency with the likelihood of price retracement.
- Immediately after MSS confirmation: This type of entry lowers the risk-to-reward ratio, but prevents missing the move if no retracement occurs;
- Pullback to the 1H Fair Value Gap (FVG): This entry improves the risk-to-reward ratio, but if the price does not retrace, the trade opportunity is missed.
Stop Loss (SL) Points
Stop loss placement is determined by weighing the trade-off between tighter risk-to-reward potential and protection against liquidity grabs.
- Below the MSS candle: Placing thestop loss here offers a favorable risk-to-reward ratio, though it is susceptible to stop hunts;
- Below the wick of the SMT divergence candle: This stop loss is more secure, although it reduces the risk-to-reward ratio.
Take Profit (TP)
Depending on the price movement and momentum, the 1-hour FVG zone is a suitable area for exiting the trade.
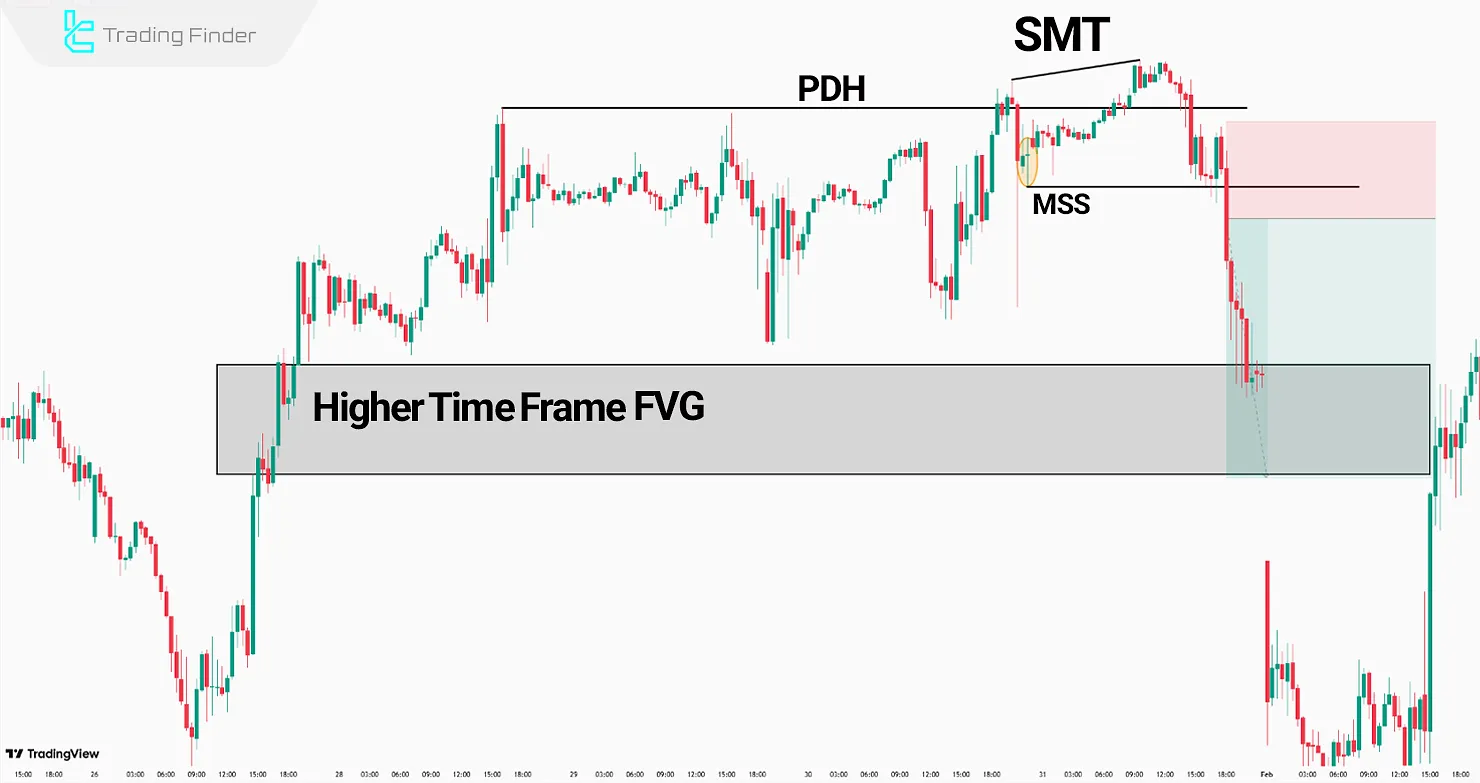
On the chart, it can be seen that after an SMT divergence forms at the high area, liquidity above the Previous Day High (PDH) is absorbed, and then with the formation of a Market Structure Shift (MSS), the first bearish signal is generated.
This structural break indicates a shift in order flow and the beginning of smart money movement toward lower levels.
Afterward, price returns to the Fair Value Gap (FVG) zone, creating conditions for entering a sell trade.
The overlap between MSS, PDH, and FVG provides an ideal position for entering in line with liquidity.
At this stage, the sell trade entry on the pullback to FVG is executed, similar to the analyses shared in twitter forex signals .
In this setup, the stop-loss is placed above PDH and the target is aligned with the liquidity of daily lows, resulting in a trade with controlled risk and a favorable risk-to-reward ratio.
Sample entry into a trade using FVG and MSS; similar to the tutorials on ict trader twitter :
Pros and Cons of the Twitter Model Setup
The Twitter Model setup aligns entries with Smart Money Concepts (SMC), but requires multiple confirmations, increasing complexity.
Review of strengths and weaknesses; similar to the analyses on ict trading twitter:
Pros | Cons |
Precise liquidity & order flow integration | Execution complexity |
Aligns with Smart Money behavior | Limited signal frequency |
Filters out fake breakouts | Requires multiple timeframe analysis |
Entry at high-liquidity points | Demands multiple confirmations |
Optimal risk management | Session dependency (NY & London) |
Twitter Model ICT Indicator
The Twitter Model ICT Indicator is one of the specialized tools for analyzing market structure and liquidity, used by professional traders to identify precise entry and exit zones.
This indicator is designed on TradingView by combining Market Structure, Liquidity, and FVG. It is applicable for timeframes ranging from M1 to H4. Many tutorials have been introduced in the fx evolution twitter community.
By integrating key ICT-style concepts such as Market Structure, Liquidity Zones, Previous Day High/Previous Day Low (PDH/PDL), and Fair Value Gap (FVG), this indicator provides a deep perspective on price movements.
For this reason, it falls under TradingView’s liquidity and reversal indicators category and is specifically designed for analysis on lower timeframes such as M1 to H4.
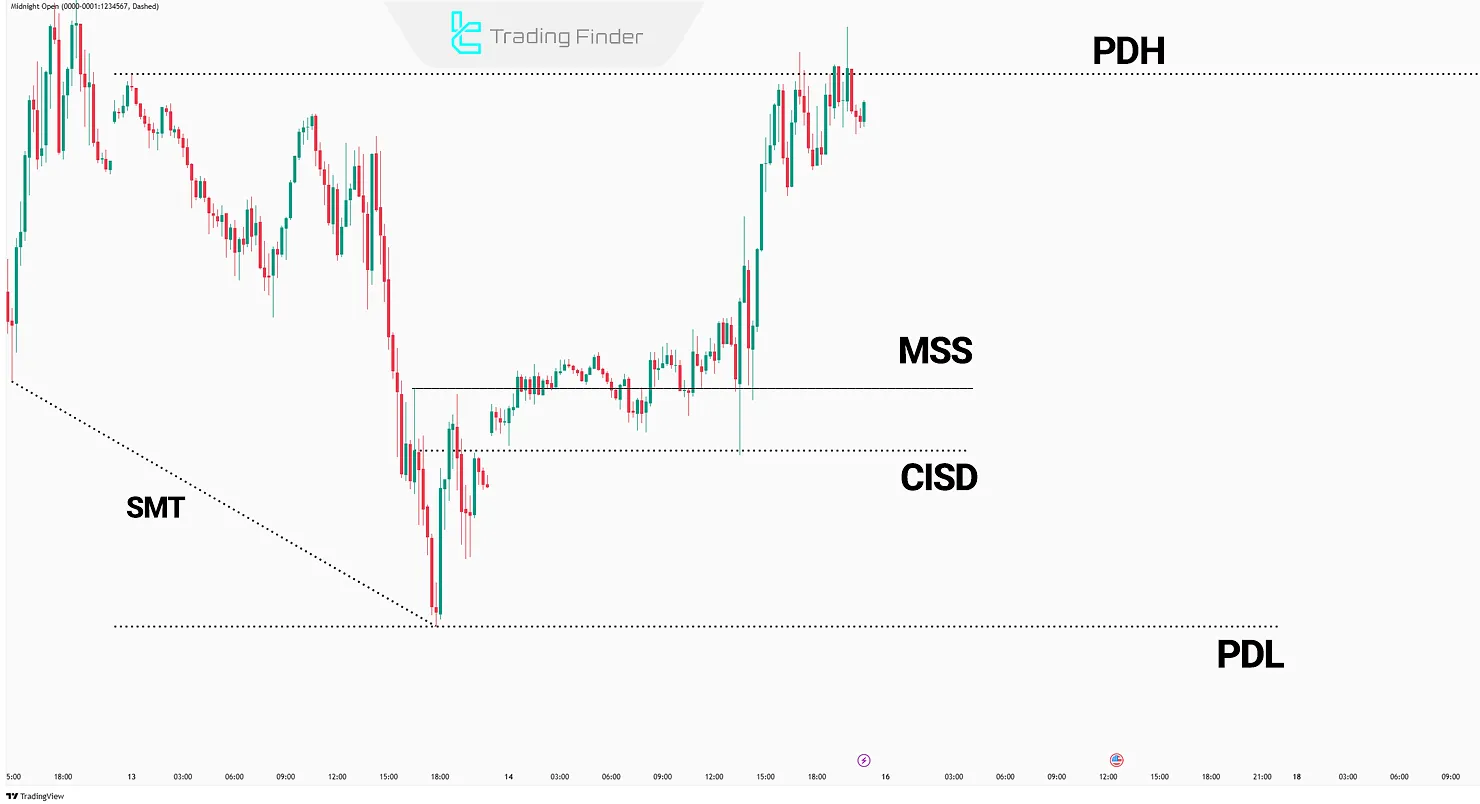
The main functionality of this model is based on liquidity grabs. For example, in a bullish setup, when price absorbs liquidity below the Previous Day Low (PDL) and then returns to the daily range, the occurrence of Change in State of Delivery (CISD) activates a buy signal.
Conversely, in a bearish setup, breaking above the Previous Day High (PDH) followed by a return of price to a balanced range, along with confirmation of CISD, generates a sell signal. This structure allows traders to take entries aligned with liquidity flow and the prevailing trend.
The indicator’s settings section offers high flexibility. In the Logical Setting panel, users can define the validity of CISD levels, review past candles, and select a second asset for SMT divergence.
In the Session Setting panel, the trading time zone can be customized so the indicator aligns with the intended session. The Display Setting panel provides features such as showing PDH and PDL, SMT divergence lines, and the daily open price.
These combined features make the Twitter Model ICT Indicator suitable for various markets including Forex, Cryptocurrency, and even the Forward market.
Given its liquidity-based nature, traders can use it to capture key price moves in both bullish and bearish directions. Ultimately, this indicator serves not only as a signal tool but also as a framework for understanding market behavior and adapting to ICT concepts, earning a special place in modern market analysis.
Different examples of this trading setup can be seen in ict trading twitter resources:
- Download the Twitter Model ICT Indicator for MetaTrader 5
- Download the Twitter Model ICT Indicator for MetaTrader 4
- Add the Twitter Model ICT Indicator to TradingView
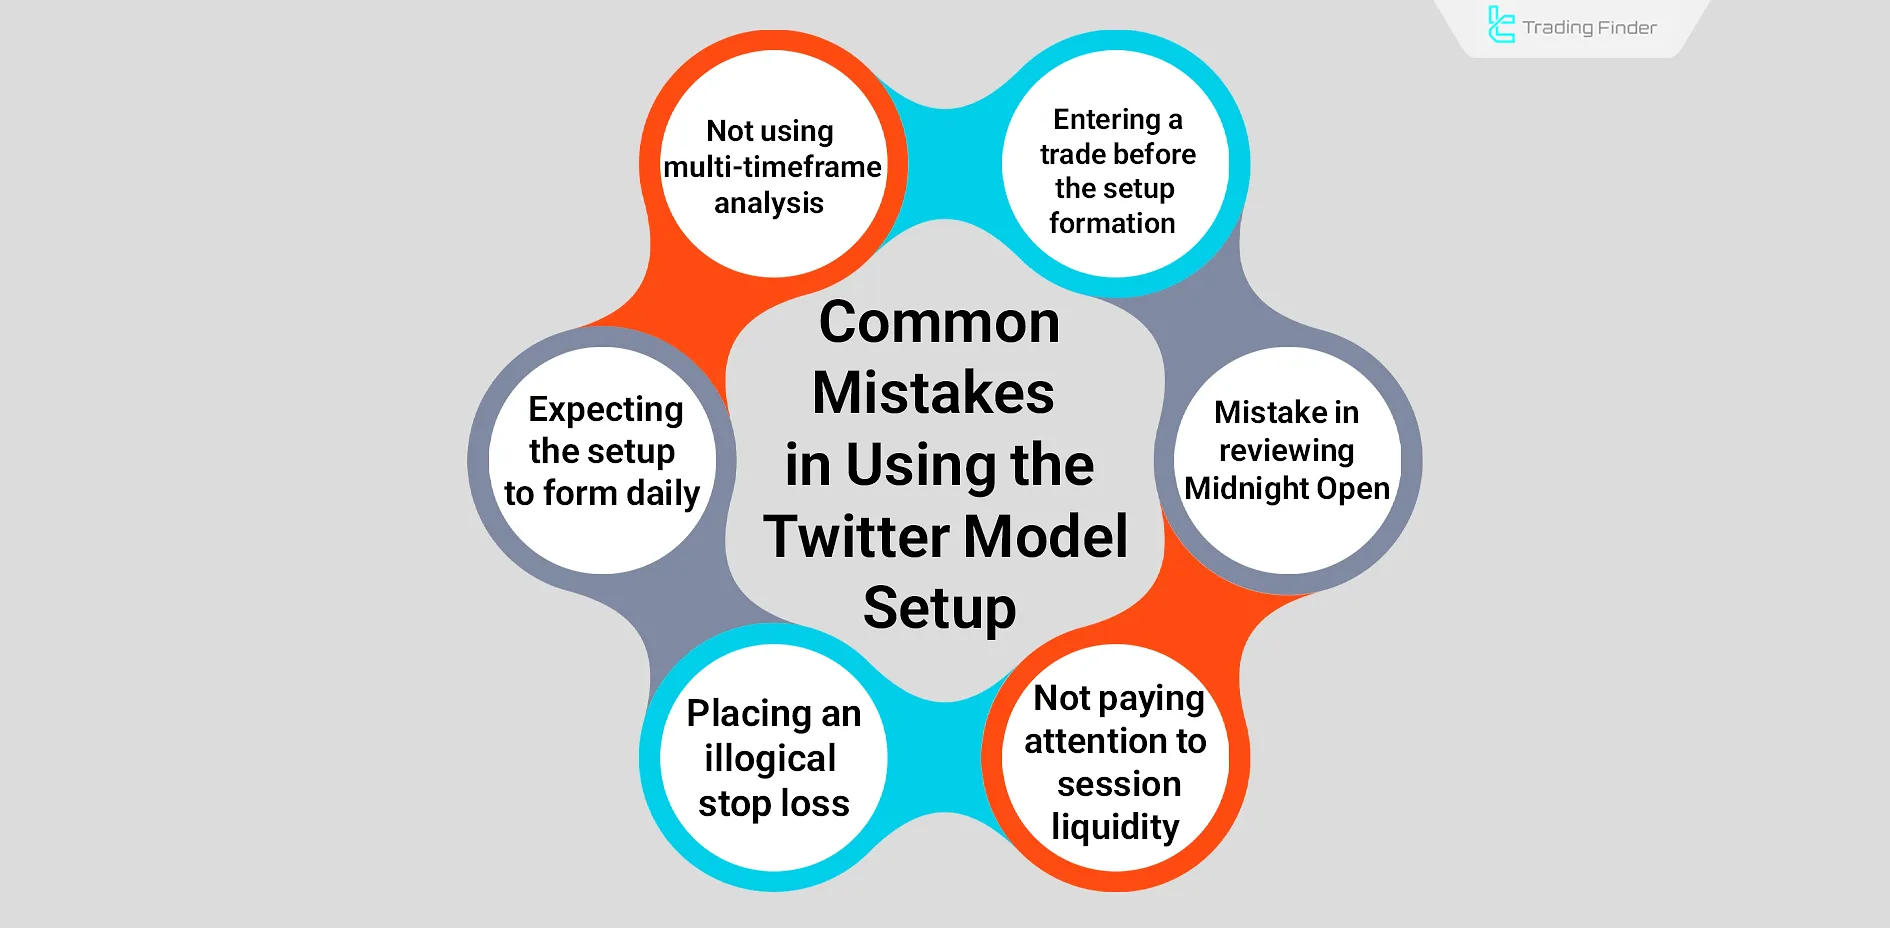
Common Mistakes in Using the Twitter Model Trading Setup (Twitter Model setup ICT)
Different mistakes such as not applying multi-timeframe analysis, ignoring liquidity, and others reduce the success rate of this trading setup.
Common mistakes in using the Twitter Model Setup:
- Incomplete entry into the setup: entering a trade before all components of the setup are formed reduces trade success rate;
- Ignoring the multi-timeframe nature of the setup: analyzing all factors on a single timeframe eliminates the core logic of the setup;
- Misinterpreting the Midnight Open: lack of precision in reviewing this level can lead to entries against the liquidity flow;
- Neglecting session liquidity: executing the setup in low-liquidity sessions, especially Asia, usually results in fake breakouts or incomplete moves; this setup inherently relies on the London and New York overlap;
- Placing illogical stop-loss levels: choosing a stop-loss too close to the MSS candle leads to liquidity hunts, while placing it too far away destroys the risk-to-reward ratio;
- Expecting the setup to form daily: this model requires multiple confirmations, so it offers limited opportunities. Attempting to find continuous signals leads to overtrading and poor results.
Conclusion
The Twitter Model combines MSS, SMT, FVG, and liquidity levels to map Smart Money movement. However, it requires proper multi-timeframe analysis and deep understanding of ICT concepts.
Valid entries require both confirmed SMT divergence and MSS formation.
Identifying key levels like PDL/PDH along with price reaction to FVG zones improves stop-loss placement and risk-to-reward ratio.
The Twitter Model setup is a combination of MSS, SMT, FVG, and liquidity, enabling precise entries with smart money. The experiences and tutorials shared in ict tweets have contributed to the wider adoption of this method within the trading community.


