


The ICT Weekly Range Expansion Model is an analytical approach used in short-term trading to identify price expansions throughout a trading week. The weekly range expansion is based on three key elements of Fair Value Gap (FVG), Liquidity Pool, and Old Highs/Lows.
The expansion of this range begins when the market, after collecting initial liquidity, moves toward one of these three key zones and extends the weekly structure, a process defined within expansion ICT.
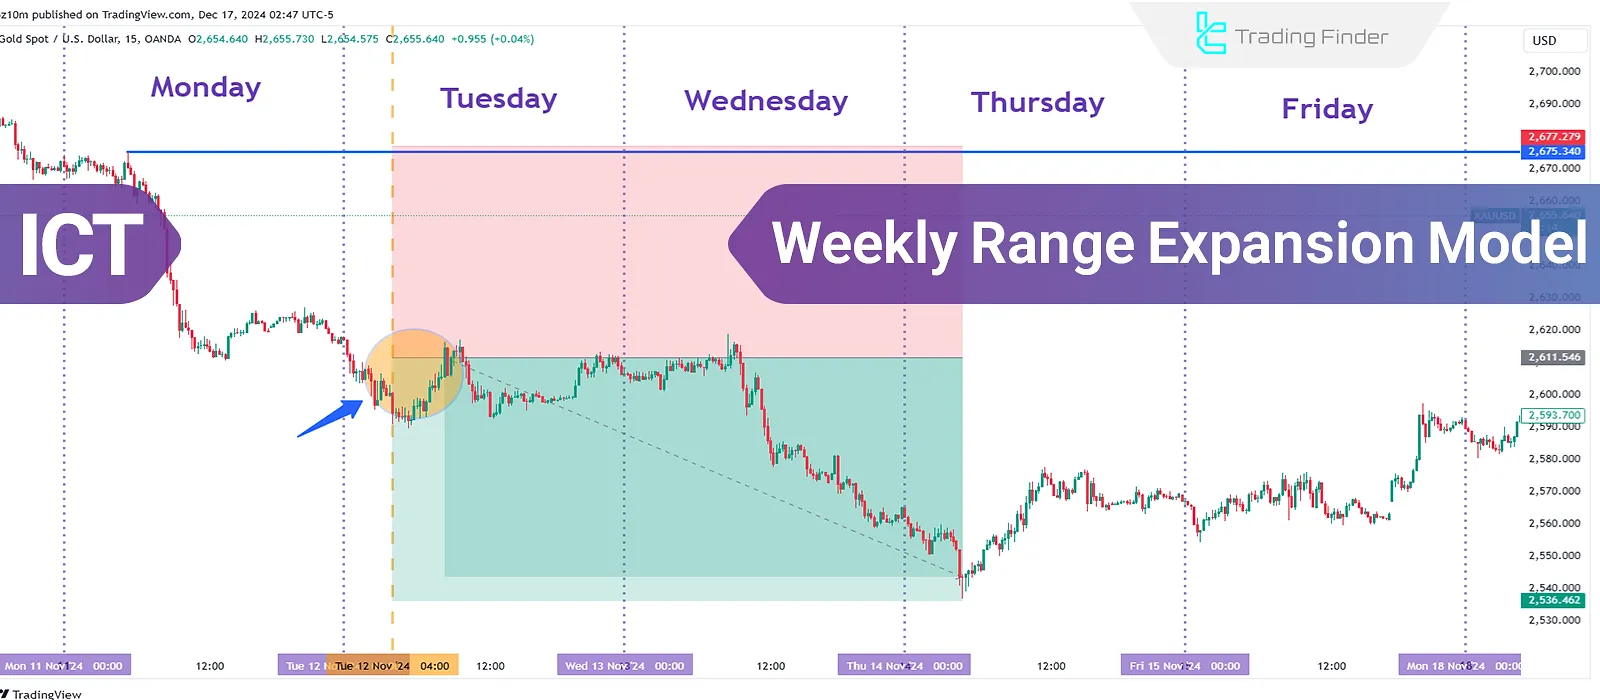
This behavior usually occurs from Tuesday to Thursday; that is when the highest order volume becomes active and the primary direction of the week, known as the ICT weekly bias or weekly bias ICT, reveals itself.
These three factors allow the trader to identify the starting point of the move, the continuation path of price, and the potential market targets with greater precision within a weekly bias trading framework.
What is the ICT Weekly Range Expansion Model?
In ICT style, Weekly Range Expansion Model is a short-term strategy designed to profit from weekly market movements. This model operates based on three key components known as PD Arrays:
- Fair Value Gap (FVG): Price areas formed due to market speed, where price seeks to return and fill the gap;
- Old Lows/Highs: Areas where liquidity is concentrated, serving as price targets or reversal points;
- Liquidity Pool: Areas where stop orders accumulate, attracting price movement.
Note: This model is applicable to various financial markets, including Forex market, stocks, and cryptocurrencies.
Steps to Implement the ICT Weekly Range Expansion Model
The weekly range expansion model in the ICT methodology is based on understanding price behavior at the beginning of the week and the way liquidity is distributed in the following days within the framework of ict expansion.
This model seeks to identify the appropriate timing and direction of entry in alignment with the weekly market structure by separating the range formation phase from the expansion phase, which defines the logic of range expansion trading.
To apply this model and execute a position, follow three main steps:
#1 Determine Weekly Direction
To determine the weekly market direction, first analyze the weekly chart. This step includes checking for market movements to fill Fair Value Gaps or gather liquidity from specific pools.
If the market moves towards higher highs and the structure is bullish, your weekly bias will be bullish. Conversely, the bias is bearish if the price moves towards lower lows.
#2 Identify the Range Expansion Setup
Once the direction is determined, identify the price range expansion. Typically, early in the week (Monday), the price establishes a specific range.
In fact, the range expansion occurs from Tuesday to Thursday. Analyzing lower timeframes (such as the daily chart) helps confirm this expansion.
Within this period, the high and low of the initial weekly range are considered reference points for price behavior throughout the week, and the market’s reaction to these levels carries particular importance in defining the weekly bias.
Observing a valid breakout or a price reversal from this range on lower timeframes can signal the start of the expansion phase and the alignment of market movement with the weekly bias, forming the foundation of a structured weekly trading strategy.
#3 Execute the Trade
Based on the weekly bias and range expansion setup, execute your trades:
- If the bias is bullish, enter a buy trade on Tuesday at 4:00 AM (New York time) when the candle opens;
- If the bias is bearish, execute a sell trade at the same time.
In the educational article on the weekly expansion model published on the Writo-Finance website, this ICT-style concept is explained in a comprehensive manner.
Internal and External Range Liquidity in Identifying Weekly Direction
In weekly analysis, one of the most important factors that increases accuracy in identifying the weekly direction is the distinction between Internal Range Liquidity and External Range Liquidity within the weekly profile of the market.
External liquidity is located at significant weekly highs or lows and is usually the first target that price gravitates toward to initiate a larger move, forming the basis of forex expansion and broader price expansion.
In contrast, internal liquidity is more commonly found within mid term structures such as midweek highs and lows, and its role is primarily to provide fuel for the continuation of the move.
When price collects external liquidity on the weekly timeframe and then enters the Discount or Premium zone, the path of the weekly bias becomes much clearer within the ict weekly framework.
This behavior aligns with smart money logic, as the market typically targets external liquidity pools before a weekly expansion in order to generate the necessary volatility for sustained price expansion.
Premium and Discount Range Matrix in Entry Zone Selection
In the weekly range expansion model, selecting an entry zone is not limited to observing a single PD Array. What defines a low risk entry is the position of the PD Array within the Premium and Discount matrix as mapped inside the weekly profile.
This matrix shows which category of PD Arrays has the highest compatibility with liquidity flow under a specific directional bias during phases of forex expansion.
PDR Matrix Table:
Price Zone | Suitable Premium and Discount Range | Role in Entry | Potential Target in Continuation |
Discount | Fair Value Gap (Fair Value Gap) | Buy order formation zone after liquidity collection | Move toward Buy Side Liquidity |
Discount | Old Lows | Price reaction area for initiating bullish price expansion | Reaching Premium PD Array zones |
Discount | Sell Side Liquidity Pool | Source of weekly low formation in a bullish scenario | Start of weekly expansion after liquidity collection |
Premium | Old Highs | Ideal zone for placing sell orders in a bearish direction | Move toward Sell Side Liquidity |
Premium | Unfilled Fair Value Gap (FVG) | Reversal zone and start of bearish price expansion | Move toward Discount PD Array zones |
Premium | Buy Side Liquidity Pool | Area for forming the weekly high | Start of bearish expansion through Tuesday to Thursday |
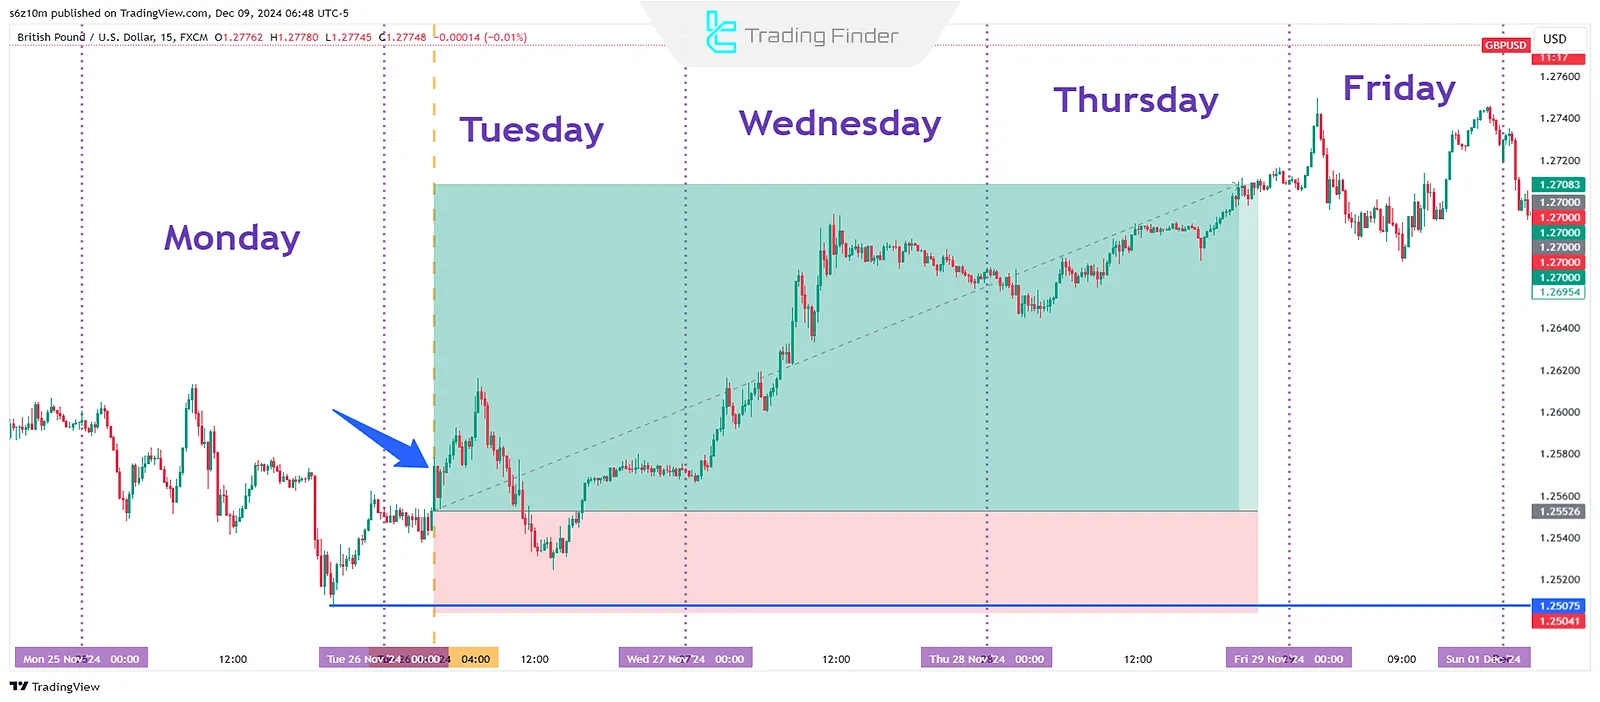
How to Trade a Bullish Weekly Expansion?
To trade a bullish weekly expansion, follow these steps:
- Confirm Weekly Bullish Bias: Check for sell-side liquidity being taken or price reaching the discount zone;
- Target Price: Price typically moves toward buy-side liquidity or premium zones;
- Confirm Structure: Look for a market structure shift (MSS) towards bullish on the daily timeframe;
- Execution Timing: Enter buy trades from Tuesday and hold until Thursday.
For example, the following image illustrates a real-world execution of this model:
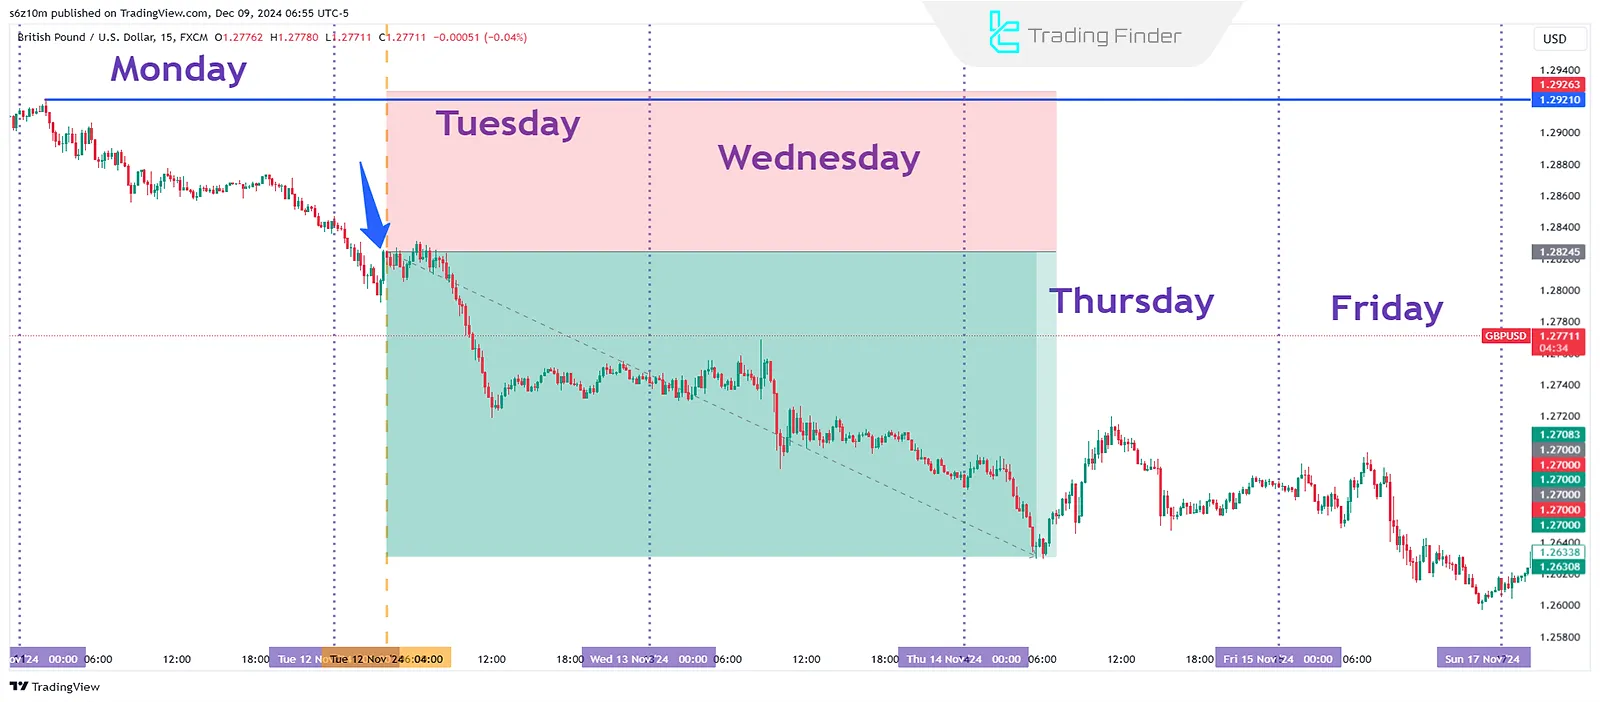
How to Trade a Bearish Weekly Expansion?
For bearish trades, follow the same steps but with a bearish confirmation:
- Confirm Weekly Bearish Bias: Look for buy-side liquidity being taken or price reaching the premium zone;
- Target Price: Price generally moves towards sell-side liquidity or discount zones;
- Confirm Structure: Ensure a market structure shift (MSS) towards bearish on the daily timeframe;
- Execution Timing: Enter sell trades on Tuesday and hold until Thursday.
On the AM Trades YouTube channel, a trading example using the weekly range has been presented in video format, illustrating concepts related to expansion forex and expansion trading:
The Role of the New York 04:00 AM Candle in Entry Confirmation
The New York 04:00 AM candle (New York 04:00 AM Candle) is the point at which bank liquidity flows into the market and many pending orders become active, marking a critical moment in expansion in forex.
For this reason, ICT defines this candle as the moment when expansion begins within the framework of expansion of ICT.
In bullish weeks, if this candle opens below Tuesday’s open and then breaks structure to the upside, the probability of expansion starting increases significantly, aligning with classic expansion trading behavior.
In bearish weeks, the exact opposite behavior is expected; meaning the candle first collects buy side liquidity and then initiates a bearish move.
The objective of this stage is to identify the moment when the market reveals its primary decision after liquidity collection during expansion in forex. If the 04:00 AM candle moves without collecting liquidity or without breaking structure, the entry carries no value.
The Role of Liquidity Voids and Imbalances in the Start of Weekly Expansion
In many weeks, the beginning of price range expansion is accompanied by the filling of a Liquidity Void or the mitigation of a price Imbalance, which are common features of expansion forex conditions.
These areas represent zones that the market previously moved through rapidly, leaving no opportunity for trading activity.
The market revisits these zones to complete price data and establish a logical distribution of orders, and this return often serves as the precondition for the start of weekly expansion within expansion of ICT.
Observing the full mitigation of an imbalance on the weekly or daily timeframe is an important signal that the weekly bias is being confirmed and that price is preparing to move toward the target PD Array during expansion trading.
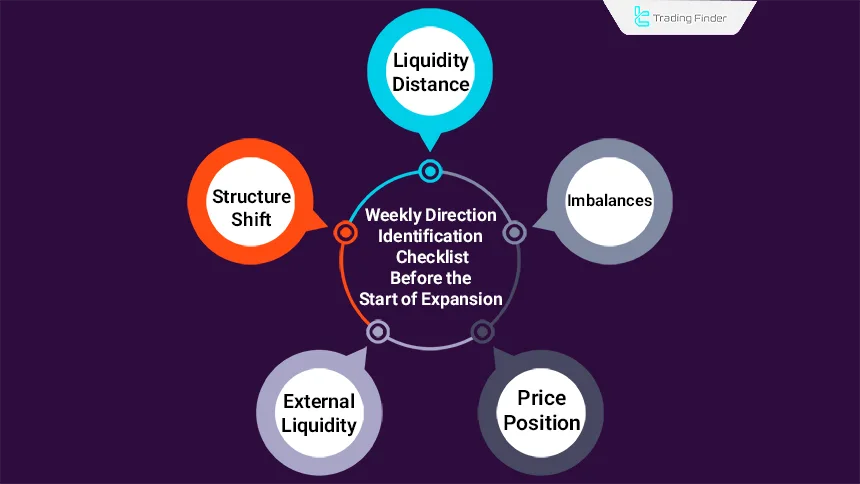
Checklist for Identifying Weekly Direction Before the Start of Expansion
Before the market enters the range expansion phase, the weekly direction must be identified with high precision, especially in expansion in forex scenarios.
Determining the weekly bias without a structured checklist exposes the trader to premature entries or entries against the liquidity flow. To define the weekly bias, review the following criteria:
- External liquidity: Evaluating the path of external range liquidity, including untouched weekly highs and lows and active liquidity targets;
- Price location: Analyzing price position relative to the Discount or Premium zone on the weekly timeframe;
- Imbalances: Assessing the presence of a Fair Value Gap or an active imbalance along the price path;
- Structure shift: Reviewing market structure shifts on the daily timeframe and their alignment with the weekly bias (Market Structure Shift);
- Liquidity distance: Measuring the distance between price and the primary Liquidity Pool and the probable directional draw toward it.
Key Considerations in Applying the ICT Weekly Range Expansion Model
Applying the ICT weekly range expansion model without attention to structural market details can lead to incorrect interpretations of price behavior during expansion forex phases.
Within this model, precision in identifying the dominant direction, aligning multiple timeframes, and selecting the appropriate entry timing plays a decisive role in the validity of the analysis and the overall trade quality in expansion in forex environments.
Key Considerations in Using the ICT Weekly Range Expansion Model
To correctly implement the concept of Weekly Range Expansion in the ICT style, consider the points below:
This framework requires precise alignment between higher-timeframe bias, liquidity conditions, and market structure, and its effectiveness depends on objective validation of price behavior rather than subjective pattern recognition.
Determine Weekly Bias Accurately
Reviewing the weekly timeframe is essential to identify the primary price direction. For example, if the market took out sell-side liquidity last week and the price is in a discount PD Array, a bullish move in the upcoming week is likely.
In such conditions, paying close attention to price reactions around key weekly zones becomes increasingly important within the context of the ict opening range and the midnight opening range ict.
because the market’s entry into a Discount PD Array after sell side liquidity has been taken often indicates a reduction in selling pressure and the market becoming prepared for a corrective move or a sustained bullish continuation in weekly trading.
This confluence allows the trader to assess the weekly direction not solely based on structure, but rather through liquidity logic and the position of price within the distribution and accumulation cycle, which is essential for disciplined weekly trading.
Align Timeframes
It is critical to use the daily timeframe to confirm the weekly bias. For instance, a bullish market structure shift (MSS) in the daily timeframe confirms a bullish weekly bias.
In this situation, the daily timeframe acts as a connecting bridge between the weekly structure and trade execution within ict weekly templates and ict weekly range profiles.
Observing an MSS on the daily timeframe indicates that order flow on a shorter scale has also aligned with the weekly direction, increasing the probability of continuation during the expansion phase and broader expansion in trading.
This alignment prevents premature entries and trades taken against the primary trend.
Entry Timing
The best entry point is usually on Tuesday, as the range expansion phase begins around this time.
This timing is important because after forming the initial range on Monday, the market enters the decision-making phase on Tuesday and reveals the true direction of its movement.
Entering at this stage allows alignment with the primary flow of range expansion and prevents getting caught in the neutral fluctuations that typically occur at the beginning of the week.
Logical Stop-Loss Placement
This model typically employs tight stop losses, which helps to manage risk effectively. The small stop loss in this structure is the result of entering near the boundaries of the weekly range, not from unrealistic stop compression.
This leads to a natural improvement in the risk to reward ratio, while the entry logic remains aligned with the overall market structure and direction.
Application of the Weekly Expansion Model Across Different Markets
The weekly range expansion model is not limited to Forex and similar behaviors can be observed in other markets as well. However, the liquidity structure of each market introduces differences that must be considered in the analysis.
- Forex market: The Monday to Thursday pattern follows a highly structured behavior, as bank liquidity volume and international flows strongly influence price action;
- Cryptocurrency market: Due to 24-hour trading, the week begins with a different structure. In many cases, buy side or sell side liquidity is collected over the weekend, and Monday does not play a standard role;
- Indices: Sharp reactions during the New York market open cause the daily timeframe and liquidity structure to play a more significant role than the weekly timeframe;
- Gold (XAUUSD): Due to high volatility, Discount and Premium ranges must be defined with greater precision, yet the weekly expansion model remains highly applicable.
As a result, the core logic of the model remains consistent, but liquidity mapping and timing must be adapted to the structural characteristics of each market.
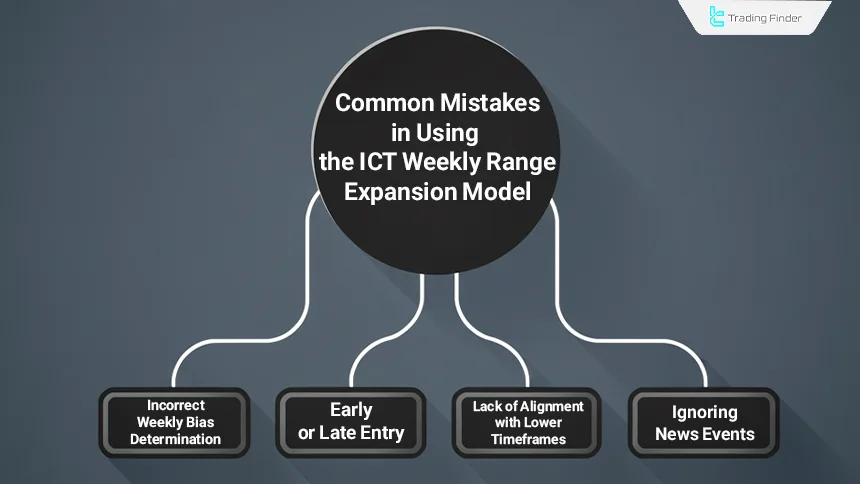
Common Mistakes When Using the ICT Weekly Range Expansion Model
A misunderstanding of the logic behind weekly range expansion often causes the trader to react to short term fluctuations instead of following the primary market flow.
These mistakes usually occur when structure analysis, liquidity assessment, and timing are not considered in an integrated manner.
- Incorrect Weekly Bias Determination: Ignoring liquidity zones, premium, and discount areas can lead to misinterpretation;
- Entering Too Early or Too Late: Trading before necessary confirmations or after the expansion phase leads to poor results;
- Ignoring Lower Timeframes: Failing to analyze market structure shifts (MSS) in lower timeframes can result in bad trades;
- Overlooking News Events: Economicreleases and macro news impact weekly trends, and failing to consider them can lead to incorrect trade timing.
Why Does Monday Often Form the Weekly High or Low?
Monday usually plays a decisive role in forming the weekly high or low because order flow at the beginning of the week has not yet fully developed, and the market tends to first test zones of liquidity pressure.
In bullish weeks, price often makes a sharp move downward to collect sell side liquidity (Sell Side Liquidity) in order to create the necessary conditions for expansion to begin.
In bearish weeks, the opposite behavior is observed, where the market takes buy side liquidity (Buy Side Liquidity) and forms the weekly high.
This behavior causes Monday to frequently define the initial structure of the weekly range, allowing the trader to execute more precise entries on Tuesday based on that structure.
Model Failure Scenarios and Weeks That Should Be Avoided
No trading model performs consistently in every week, and the weekly range expansion model is no exception. In some weeks, due to liquidity conditions or abnormal price behavior, the probability of model failure increases. The most important scenarios include:
- The presence of a very large Liquidity Void on the opposite side of the weekly bias; the market may initially move fully toward filling this void and disrupt the typical pattern;
- The formation of opening gaps at the start of the week; when the week opens with a significant gap, identifying the weekly high or low deviates from the standard behavior;
- Weeks with major macro events such as NFP releases or interest rate decisions; during these weeks, liquidity becomes excessively volatile;
- Situations where the market is trading within a compressed mid term range; weekly expansion may be very limited and not worth trading.
Identifying these weeks is an essential part of the process and ensures that the trader only enters positions when the probability of model success is high.
FVG Indicator and Price Voids (FVG+Void)
The Fair Value Gap and Price Voids indicator (FVG+Void) is a specialized tool for traders who operate using the ICT approach and Smart Money flow and require precise identification of imbalance zones.
Using a structured algorithm, this indicator identifies areas that were formed rapidly and where price retracement can be expected, marking them directly on the chart. In its structure, bullish FVGs are plotted in green and bearish FVGs in brown, allowing the trader to quickly identify the type of imbalance and its position within the trend.
One of the key features of this tool is displaying the degree to which each FVG has been consumed after price returns to it.
When the market enters an imbalance zone, the consumed portion is shown in gray, and its exact amount is displayed as a percentage within the zone.
This capability provides a precise view of the strength or weakness of the area and determines whether remaining orders still have the capacity to sustain the move.
In bullish scenarios, the indicator marks the upward FVG as soon as it forms and, during price retracement, displays the stages of order filling and consumption step by step.
In bearish trends, the same logic applies, and each downward FVG is shown along with its consumption rate, which is critical for identifying corrective behavior and assessing the probability of reversal or continuation.
The settings section of this tool includes options for managing the display of FVGs, defining validation or invalidation conditions for zones, selecting different FVG types from aggressive to defensive modes, and adjusting how consumption percentages are displayed.
This flexible structure allows the indicator to be used across different trading styles, from scalping to intraday trading and mid term analysis.
Ultimately, the FVG+Void indicator provides a clear visual framework for how imbalance zones form, are consumed, and are completed, enabling the trader to evaluate price behavior around FVGs with greater confidence and make more targeted trading decisions.
- FVG and Price Voids Indicator (FVG+Void) for MetaTrader 5
- FVG and Price Voids Indicator (FVG+Void) for MetaTrader 4
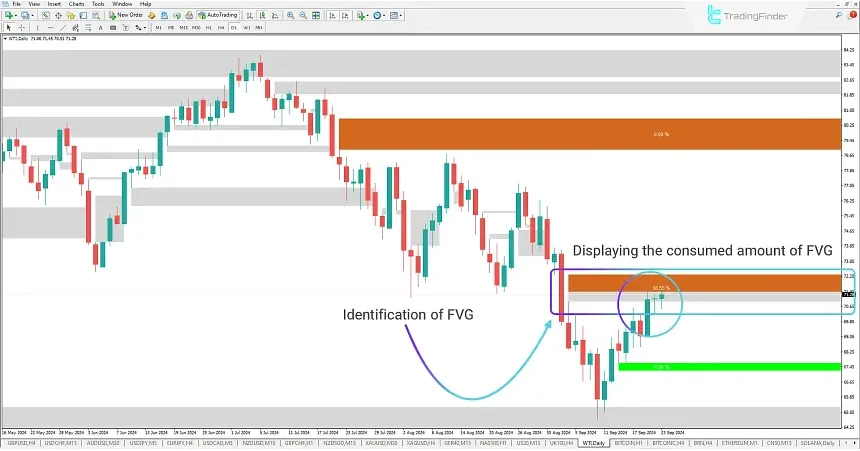
Example of Identifying a Liquidity Void and Analyzing FVG Using the Liquidity Void Indicator
In this example, the Fair Value Gap and Price Voids indicator (FVG+Void) first identifies the imbalance zone and then displays the degree to which this zone is consumed upon price retracement.
The portion of the FVG that has been filled by orders is shown in a different color, and the consumed percentage is displayed inside the box, allowing the trader to evaluate the remaining strength of the zone.
Price returning to the FVG and its initial reaction indicate that the market is completing the imbalance and restoring order flow structure, behavior that is expected within the ICT and Smart Money framework.
This step-by-step visualization helps the trader determine whether the zone still has the capacity to generate a reaction or whether most of it has already been consumed.
Differences in Liquidity Characteristics Between the Daily and Weekly Timeframes
Liquidity structure on the weekly timeframe differs significantly from that of the daily timeframe.
On the weekly timeframe, external liquidity and primary targets dominate, while on the daily timeframe, smaller structures and Internal Range Liquidity shape the path toward weekly objectives.
Comparison Table of Liquidity Characteristics on the Daily and Weekly Timeframes:
Comparison Criteria | Weekly Timeframe | Daily Timeframe |
Dominant liquidity type | External Liquidity | Internal Range Liquidity |
Role in analysis | Defining primary targets and macro market direction | Shaping the price path toward weekly targets |
Structural scale | Large and long term structures | Smaller and mid term structures |
Importance in the weekly expansion model | Defining bias and expansion range | Confirming or weakening expansion probability |
Liquidity behavior | Focus on primary liquidity grabs | Corrective reactions and internal liquidity collection |
Key signals | Weekly highs and lows, liquidity targets | Daily MSS and reactions to zones |
Impact on entry timing | Defining the overall entry framework | Increasing or decreasing Tuesday entry risk |
Result of misalignment | Reduced analysis validity and expansion strength | Increased volatility and aimless price movement |
Weekly Bias Shift and Signs of Bias Reversal
In some weeks, the initial market bias may not remain valid and can change as the week progresses. To identify such changes, a chain of market behavioral signals must be evaluated together.
- A Market Structure Shift (MSS) on the daily timeframe against the initial bias;
- Liquidity collection occurring on the side that was expected to be the weekly target, meaning the market takes that side before reaching the target;
- A break of the Discount or Premium zone without an acceptable reaction at that level;
- The formation of a new Imbalance in the direction opposite to the initial expansion.
When two or three of these signals occur simultaneously, the probability of a bias shift increases and new entries should be paused.
Conclusion
The ICT Weekly Range Expansion Model is a powerful tool for traders looking to refine their trading precision and efficiency. By combining market structure analysis, liquidity identification, and proper timing, this model helps traders capitalize on price movements.
The application of this model is most effective when the trader follows it as a step by step process and avoids impulsive interpretations.
Focusing on the alignment between the weekly and daily direction, along with correctly identifying the range formation phase, ensures that entries are based on liquidity logic and market structure.
This approach prevents involvement in the random fluctuations that are typical of the early part of the week.


