


- TradingFinder
- Education
- Forex Education
- Indicators Education
Indicators Education
Indicators use price data, volume, and mathematical calculations to provide insights into market trends, momentum, and overbought or oversold conditions. However, improper use can lead to false signals and poor trading decisions. While some traders rely heavily on indicators, others consider them lagging tools. A moving average or divergence in the relative strength index (RSI) alone cannot generate a definitive buy or sell signal. However, combining indicators strategically with other analytical tools provides deeper market insights. On TradingFinder, advanced custom indicators are available for MetaTrader 4 & 5 (MT4 & MT5) and TradingView. Additionally, traders can access detailed tutorials on how to use trend indicators like moving averages and Ichimoku Cloud, apply oscillators such as RSI and MACD, and interpret volume indicators to gauge market strength.
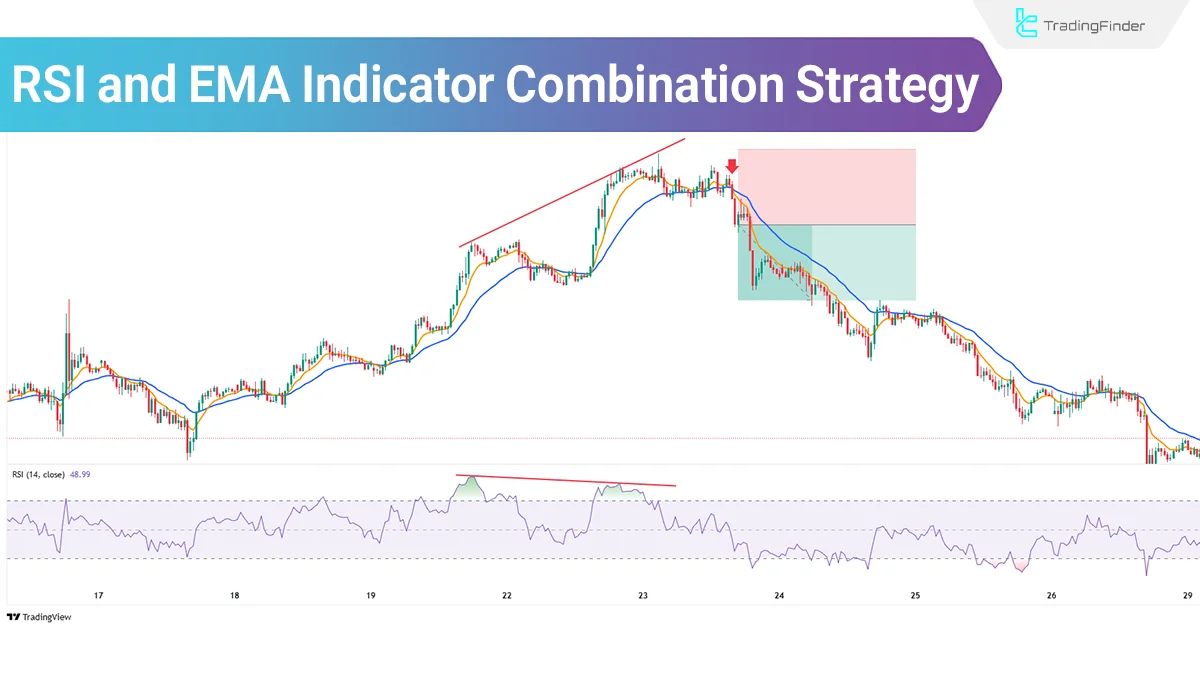
RSI and EMA Strategy: A Trend-Confirmed Momentum Setup
In the strategy combining RSI and EMA, the RSI indicator, by displaying overbought and oversold zones, and the EMA indicator, by...
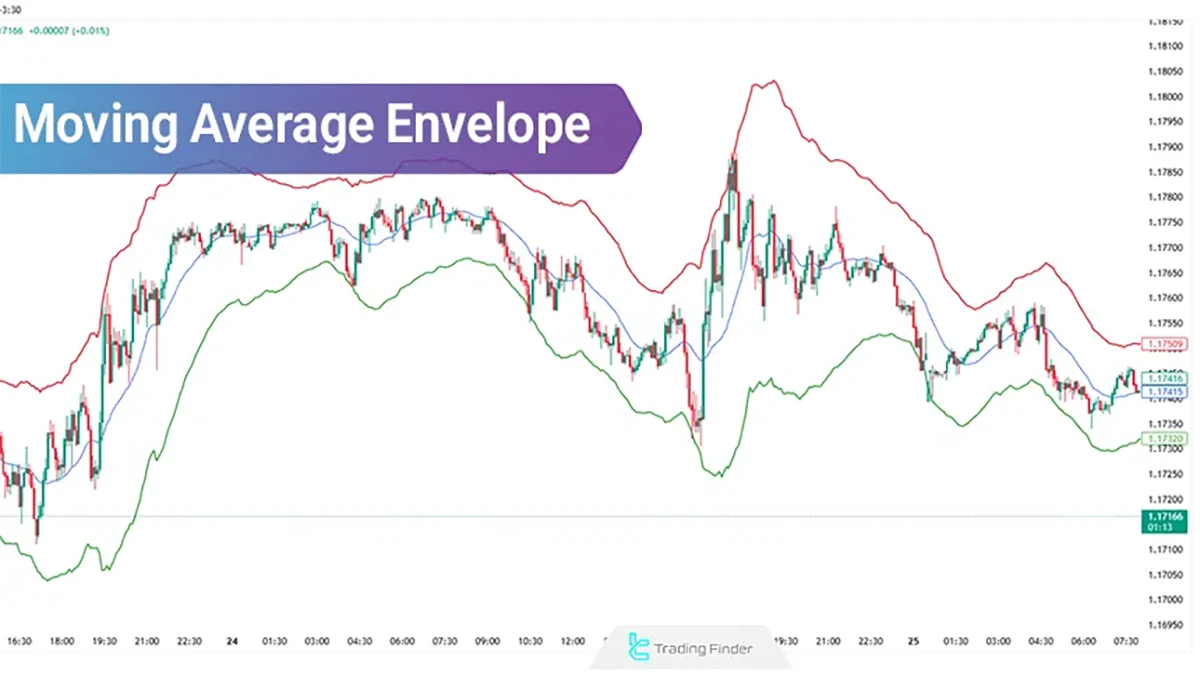
Moving Average Envelopes; Trading with Envelope Moving Averages
In technical analysis, moving averages are suitable tools for identifying trends, but on their own, they do not offer sufficient...
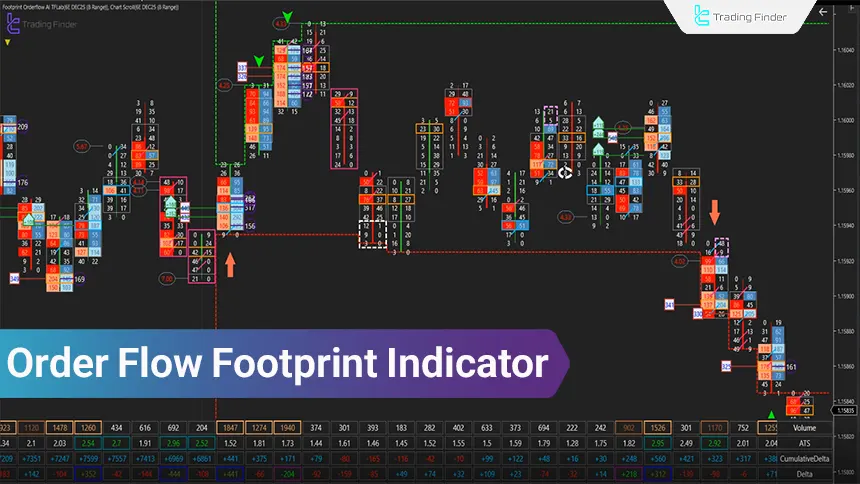
Footprint Order Flow Indicator Tutorial in NinjaTrader; Bid/Ask Analysis
In short-term trading, seeing the “battle between buyer and seller” inside each candle can make the difference between a precise...
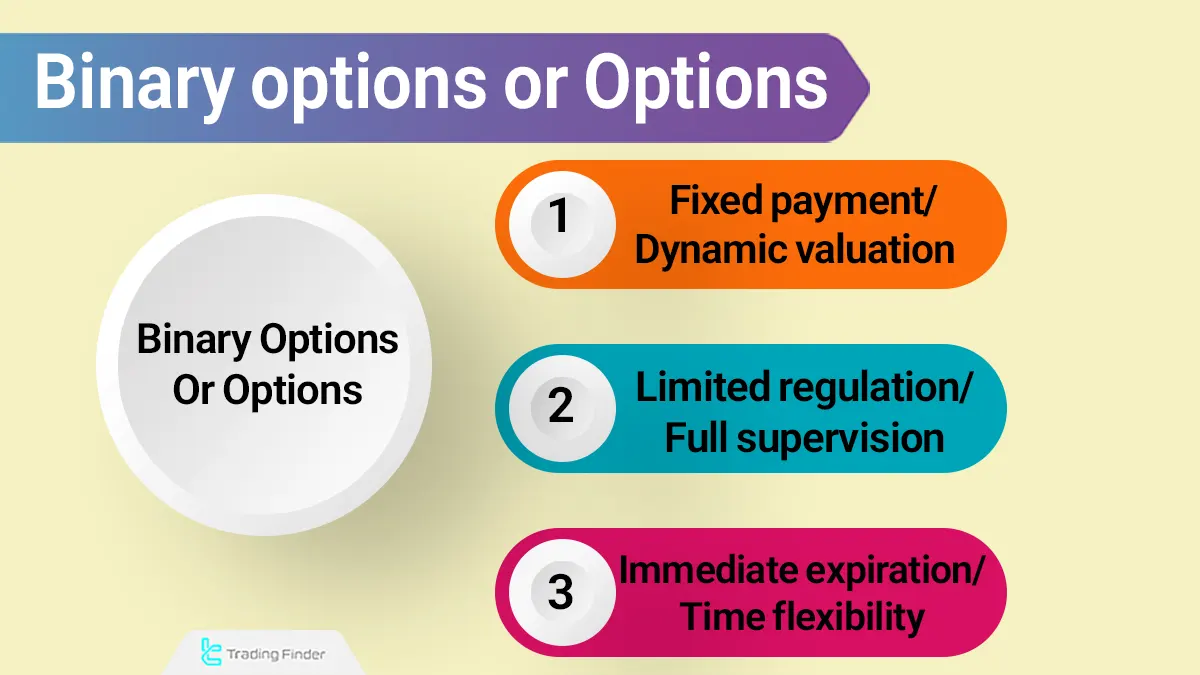
Binary Options vs Options - Which Market is Better?
Distinguishing between binary options and traditional options is not merely a comparison of two derivative instruments, it is an...
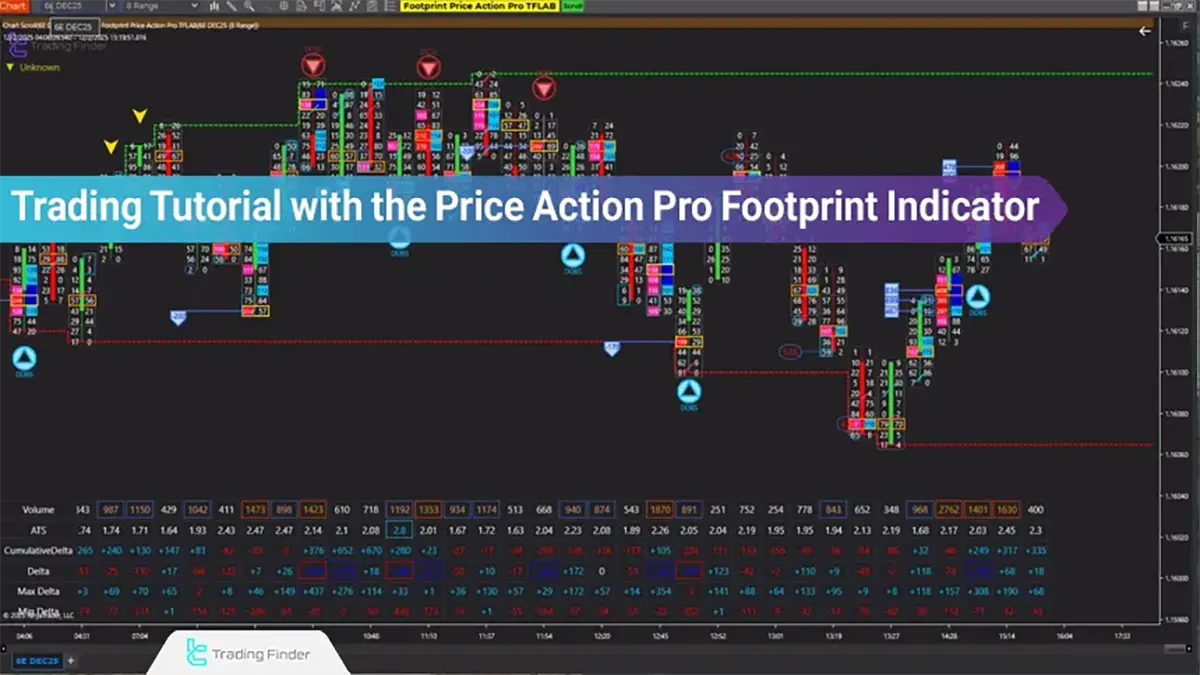
Footprint Price Action Pro Indicator Tutorial in NinjaTrader
The Footprint Price Action Pro indicator is an advanced tool for microstructure market analysis used within the NinjaTrader...
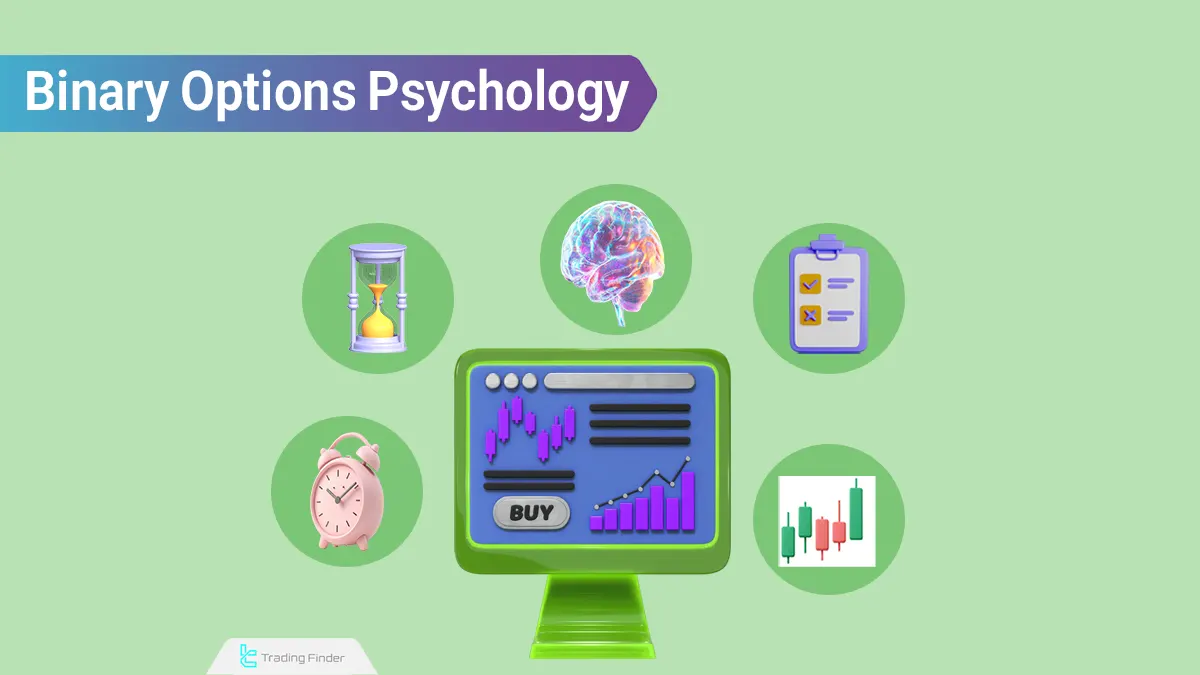
Trading Psychology in Binary Options: Mastering Emotions in Trading
Trading psychology in binary options forms the mental pillar of decision-making and determines the quality of a trader’s reaction...
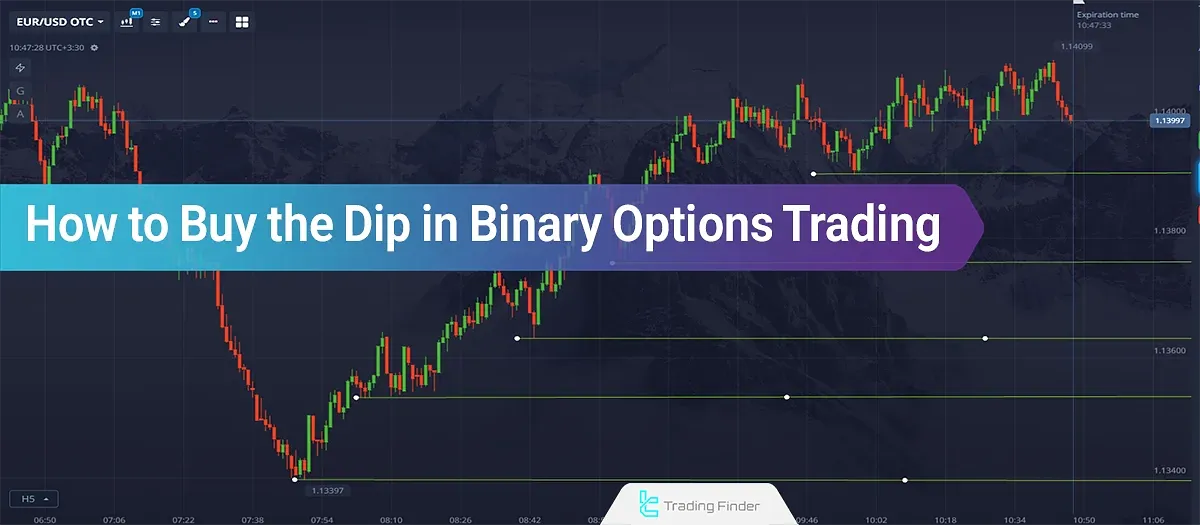
How to Buy the Dip in Binary Options Trading – Dip Buying Strategy
Analyzing price corrections in binary options begins with identifying the market trend and interpreting price behavior within its...
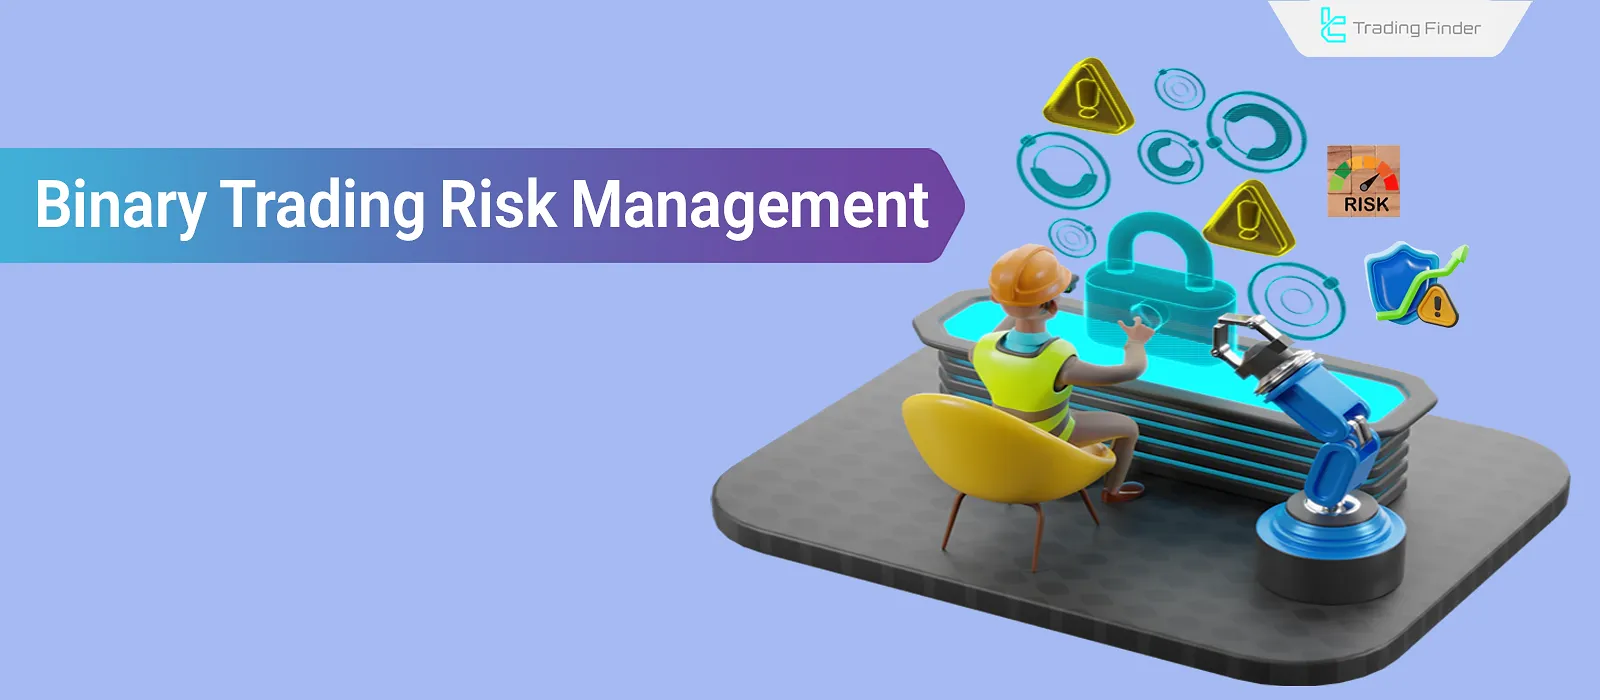
Risk Management in Binary Options; Training in Risk Management Binary Options
Risk Management in binary options means designing a set of rules and methods to control potential losses and protect capital. In...
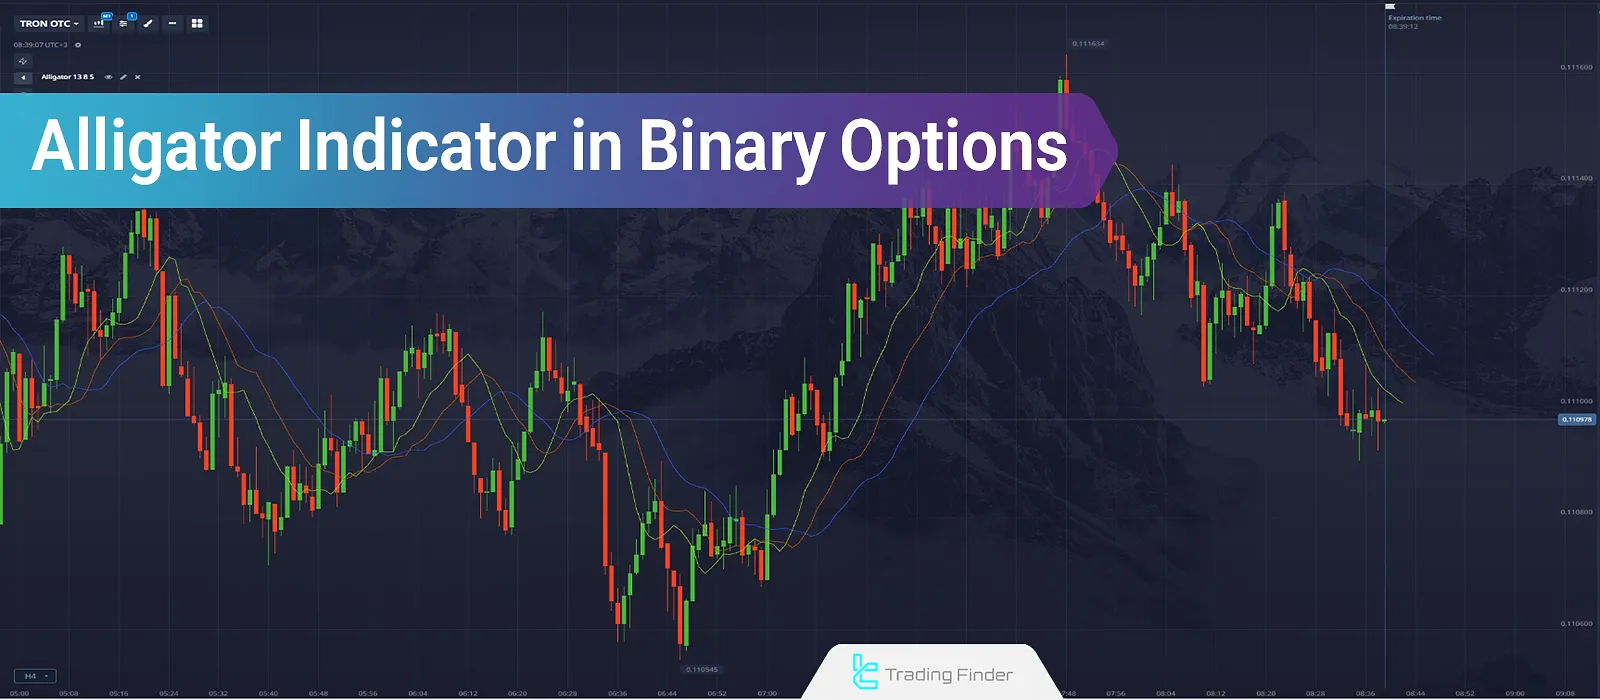
Alligator Indicator in Binary Options; Alligator Indicator Training
The Alligator Indicator in Binary Options is one of the well-known tools in technical analysis, specifically used to identify...
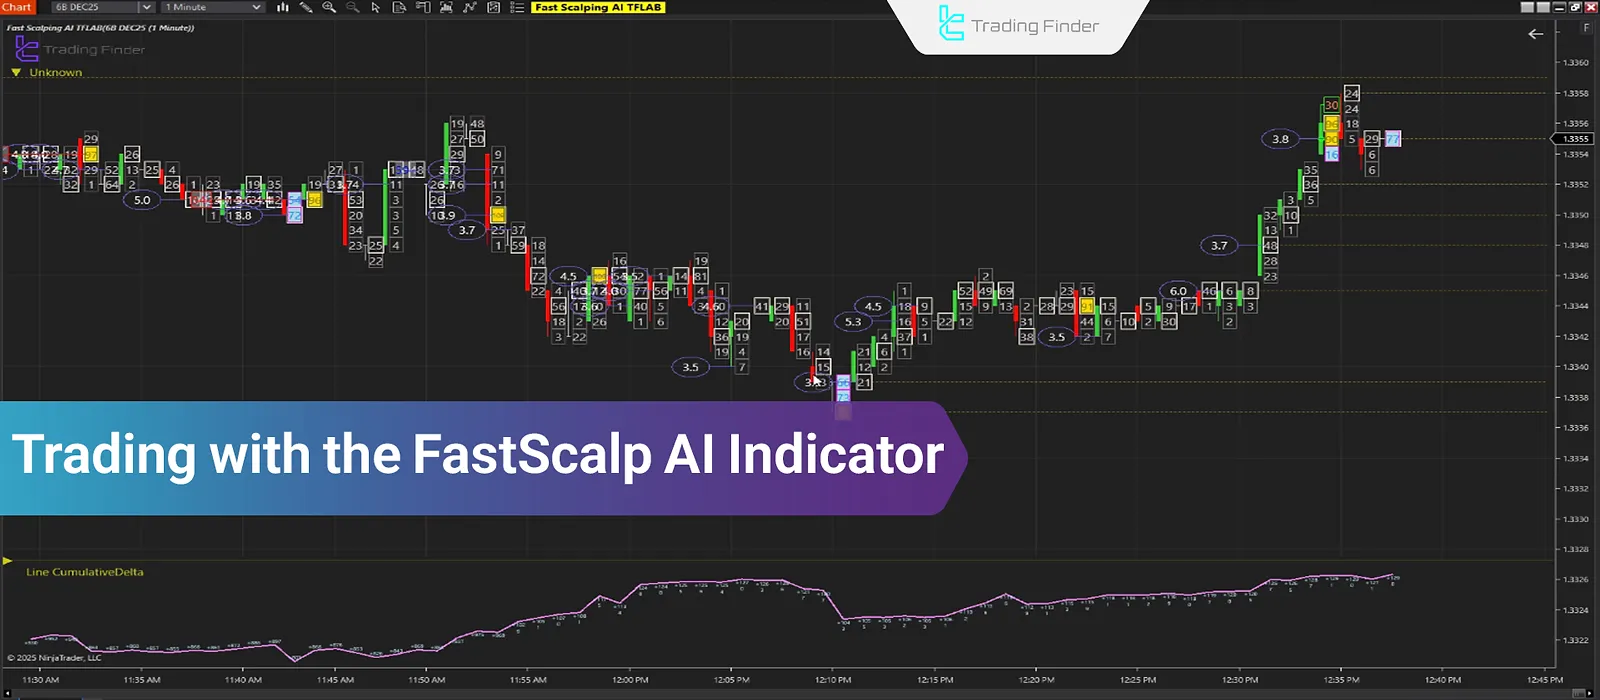
Fast Scalping AI Indicator; Trading with Order Flow Analysis in NinjaTrader
In scalping, any delay in detecting momentum shifts can lead to missed profitable opportunities. The Fast Scalping Indicator for...
![Download and Install NinjaTrader [Windows, Mac, Android, and iOS] - Free Guide](https://cdn.tradingfinder.com/image/615975/7-169-en-download-and-instal-ninja-trader-01.webp)
Download and Install NinjaTrader [Windows, Mac, Android, and iOS] - Free Guide
NinjaTrader is one of the professional trading platforms in financial markets that provides users with advanced technical analysis,...
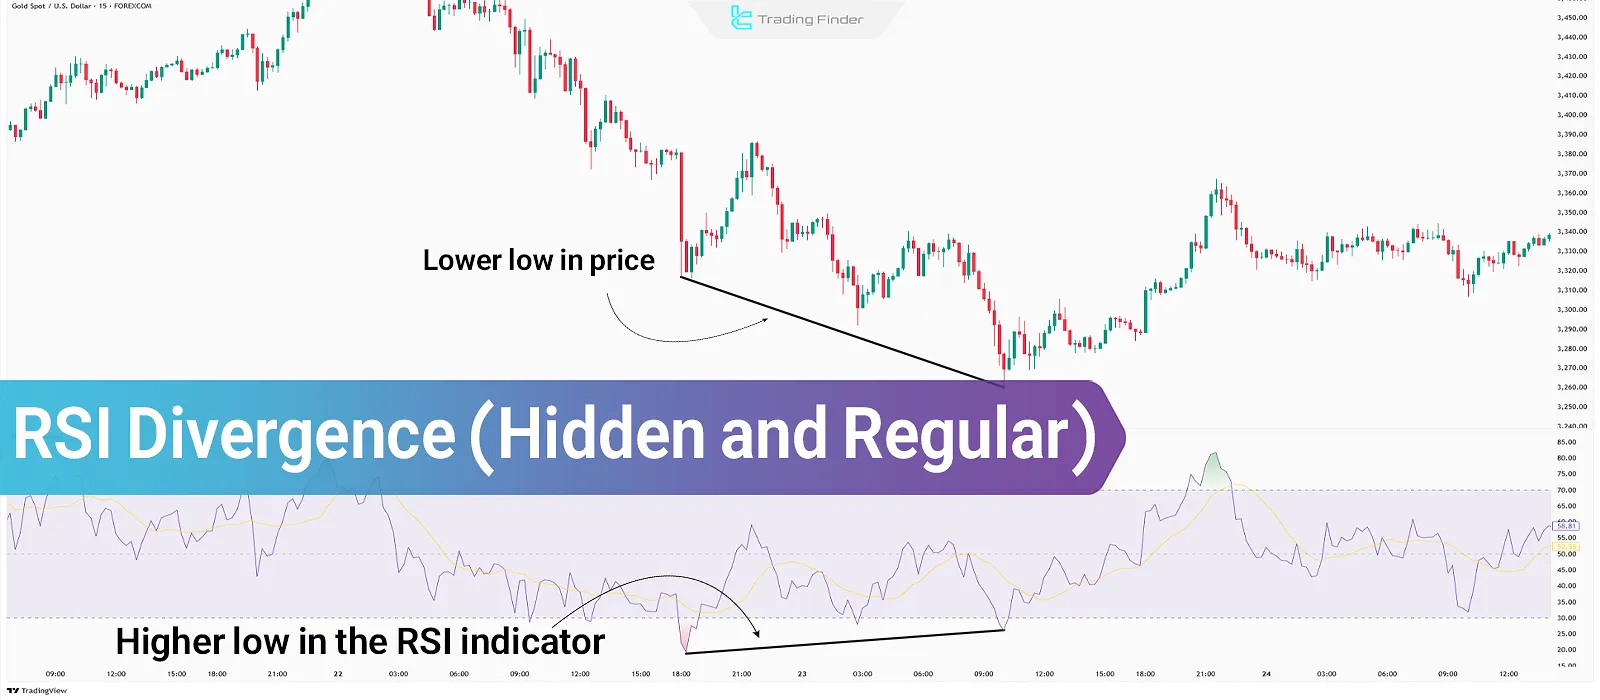
Learn RSI Divergence: Hidden & Regular Divergence
RSI Divergence is a tool for identifying potential price reversal points in the market. Detecting RSI Divergence is one of the...


