


Lower Lows (LL) and Lower Highs (LH) are basic concepts in technical analysis used to identify bearish market trends. These structures reflect the dominance of sellers in the market and the price's tendency to decline further.
Mastering these concepts is essential for finding suitable entry points for sell trades and improving risk management.
Identifying these patterns requires a precise understanding of Smart Money concepts like Break of Structure (BOS), Change of Character (CHOCH), and Inducement.
What Are Lower Lows and Lower Highs?
During a bearish trend, the price movement structure is typically formed around two main patterns: lower lows and lower highs.
These two components form the foundation of bearish market behavior and indicate that selling pressure has outweighed buying strength, with the dominant price direction remaining to the downside.
Lower low (LL)
A lower low forms when price, within its downward movement, creates a new low that is positioned below the previous low. This structure indicates that selling pressure has overcome buying strength and that the market maintains its tendency to continue declining.
The formation of a lower low is considered one of the clearest signs of strengthening bearish flow and the continuation of dominant seller behavior.
Lower high (LH)
A lower high forms when a new high is positioned below the previous high. Such an occurrence indicates that buyers have failed to push price above the prior high and that the bearish trend remains valid.
Together, these two concepts form a bearish structure that reflects weakness in buying power and the dominance of sellers.
How to Identify Lower Lows in a Bearish Trend?
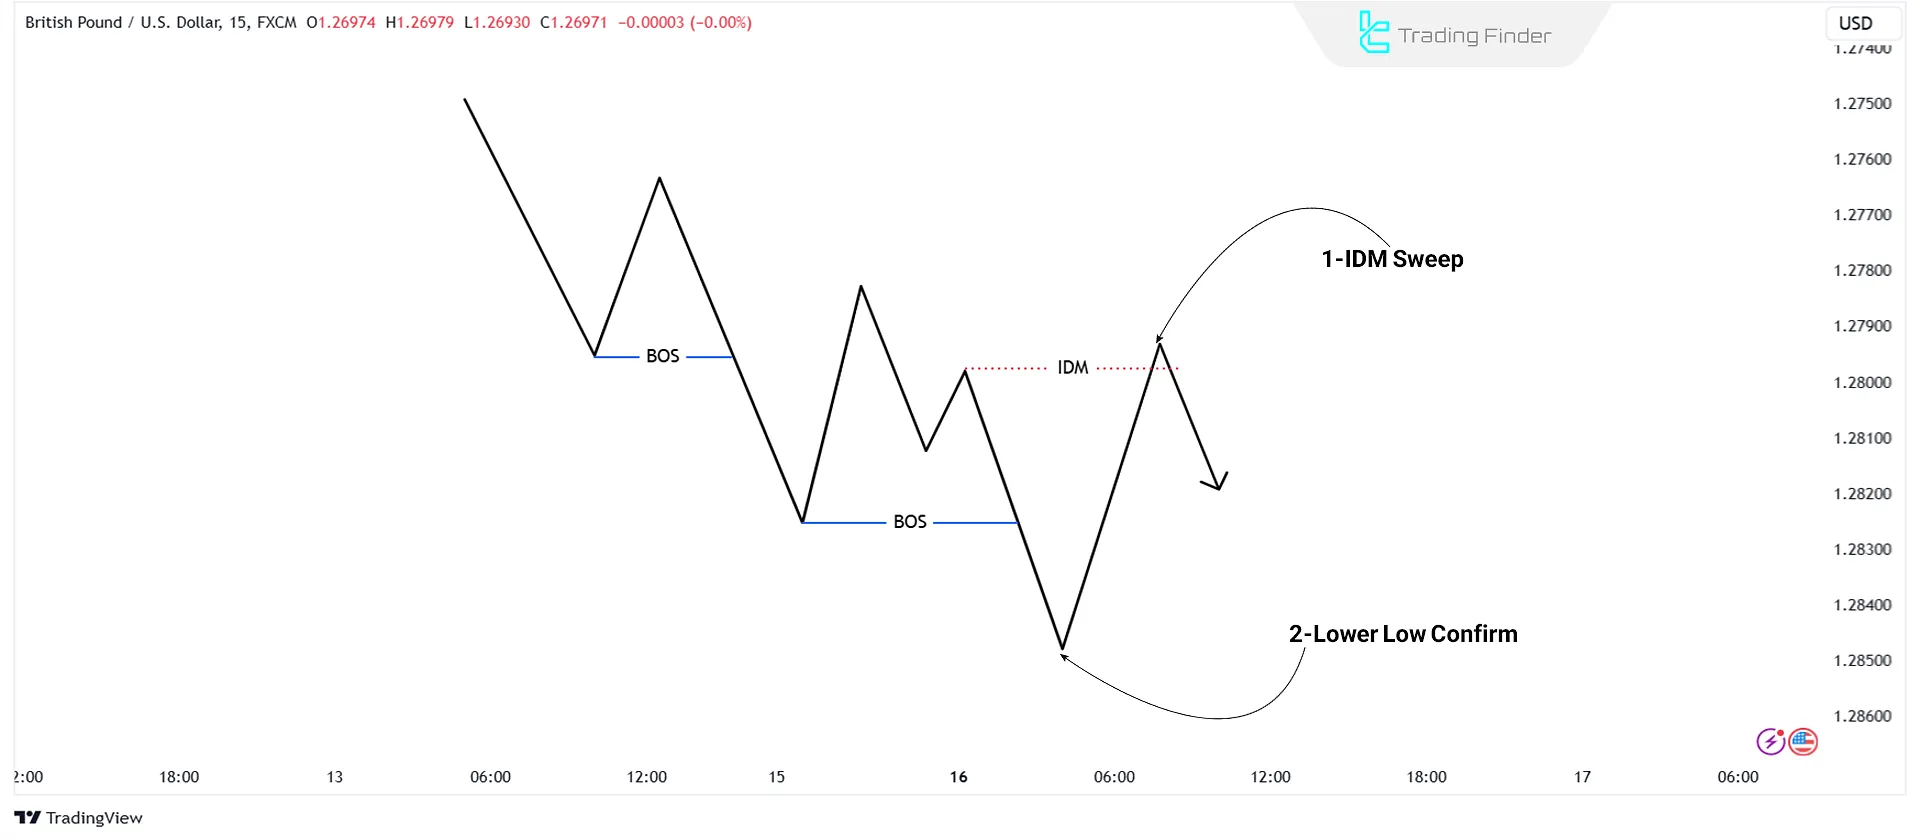
Although the price creates Lower Lows (LL) in a bearish trend, not every low is a valid structural low. To identify a valid Lower Low in a bearish trend, follow these steps:
- Identify Inducement (IDM): Start by locating liquidity zones, typically above recent swing highs;
- Formation of Swing Low: After a downward move and break of structure (BOS), the price typically retraces upward, forming a temporary Swing Low (lowest low in the downward move);
- Confirmation of Lower Low: As the price sweeps liquidity Inducement in pullback, the temporary Swing Low is confirmed as a valid Lower Low (Structural Swing Low).
When the price breaks a Lower Low, this is called a valid Break of Structure (BOS). With every downward Break of Structure, follow Inducement sweeps to locate the Lower Low.
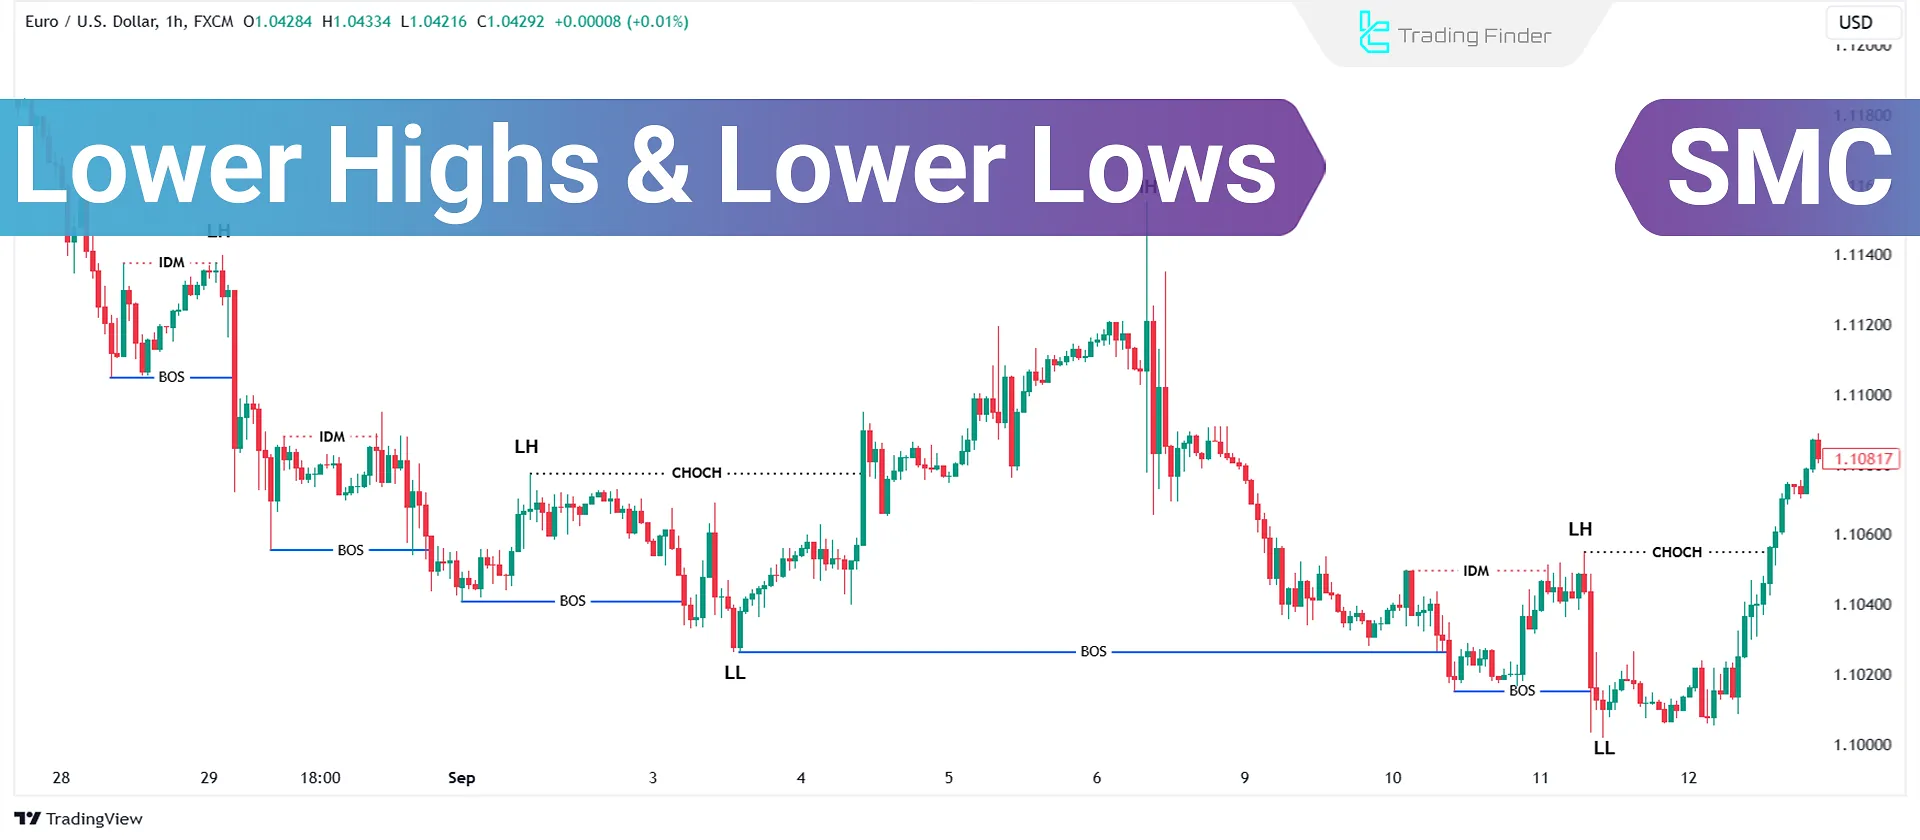
Example of Identifying LH and LL in a Bearish Trend
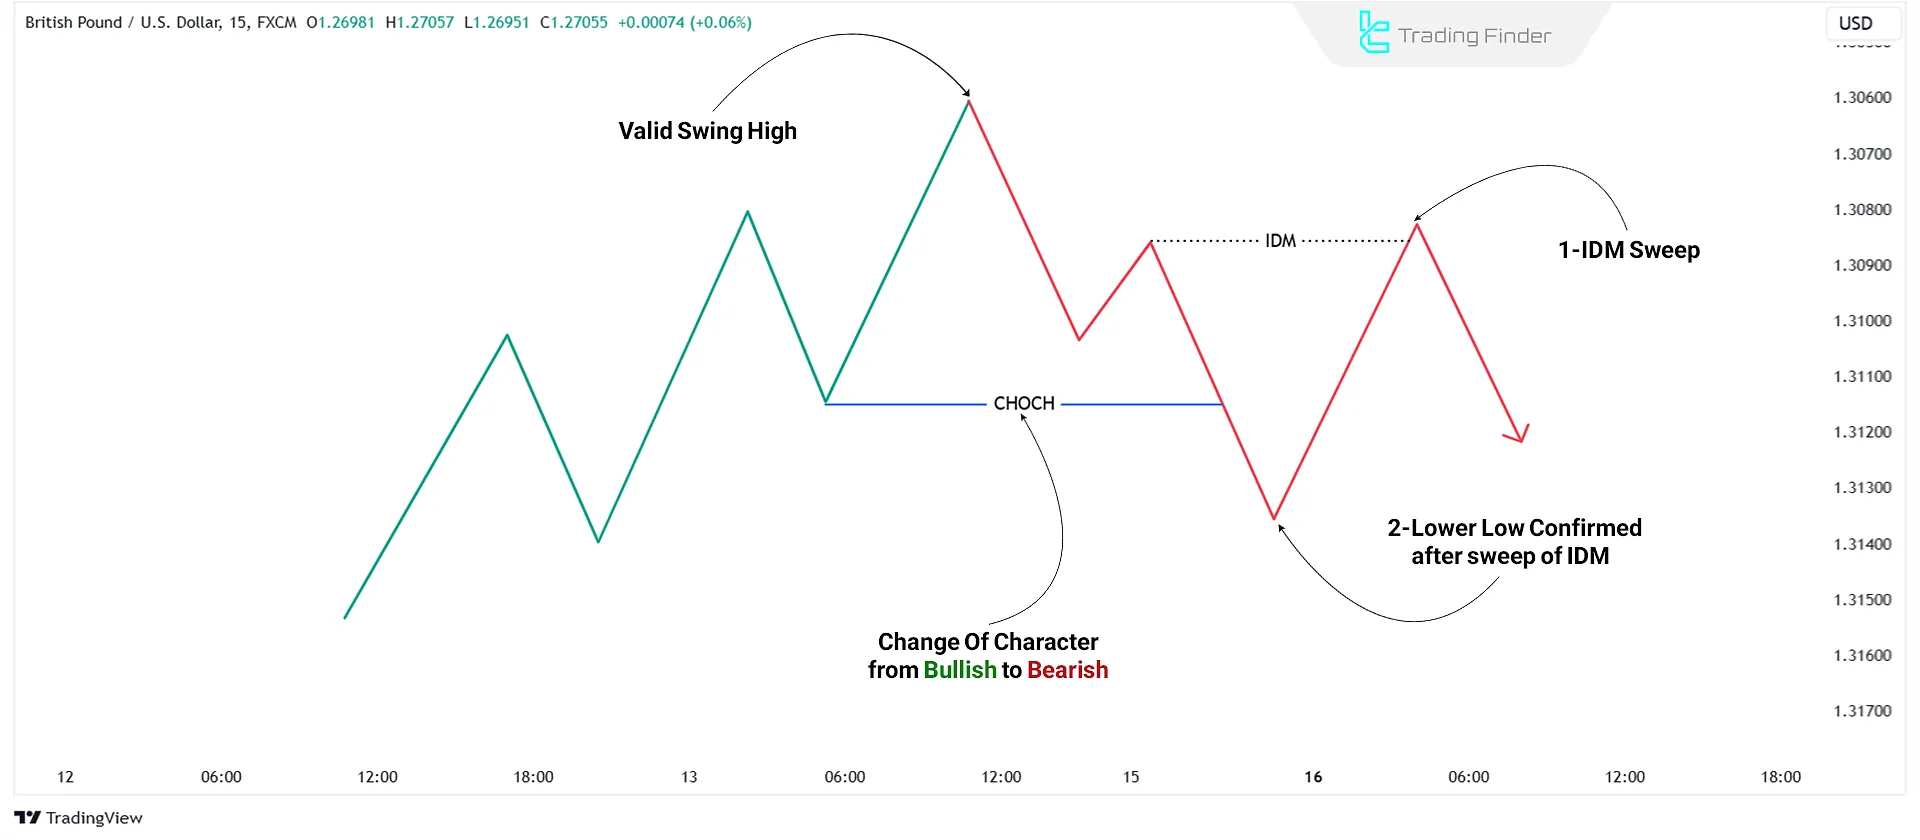
In a downtrend, the market first records a lower low (LL). It then enters a retracement but does not break the previous high, and a lower high (LH) is formed. However, the validity of each LH is confirmed only when several consecutive conditions can be observed on the chart.
To confirm an LH, liquidity is first collected in the form of inducement (IDM) in the upper area, followed by the formation of a swing high.
After the swing high forms and IDM is confirmed, price declines and breaks the previous low. With the occurrence of a break of structure (BOS), that swing high is recognized as a valid LH, and the continuation of the bearish trend is confirmed.
In the next retracement, a new LH is formed, and the same steps may be repeated: first IDM, then a swing high, and finally a BOS as price breaks the prior low. After these conditions are met, the market records another LL and the downtrend continues.
How to Identify Lower Highs in a Bearish Trend?
Prices create Lower Highs in a bearish trend, but not every high is a valid Lower High. To confirm a valid Lower High, follow these steps:
- Wait for a Price Pullback: After a downward move and break of structure (BOS), the price typically retraces upward, forming a temporary Lower High;
- Liquidity Zones: Examine liquidity collection above price highs;
- Confirmation of Lower High: If the price resumes its downward move after the pullback and breaks the previous valid structural low, the temporary high (highest high in pullback) is confirmed as a valid Lower High.
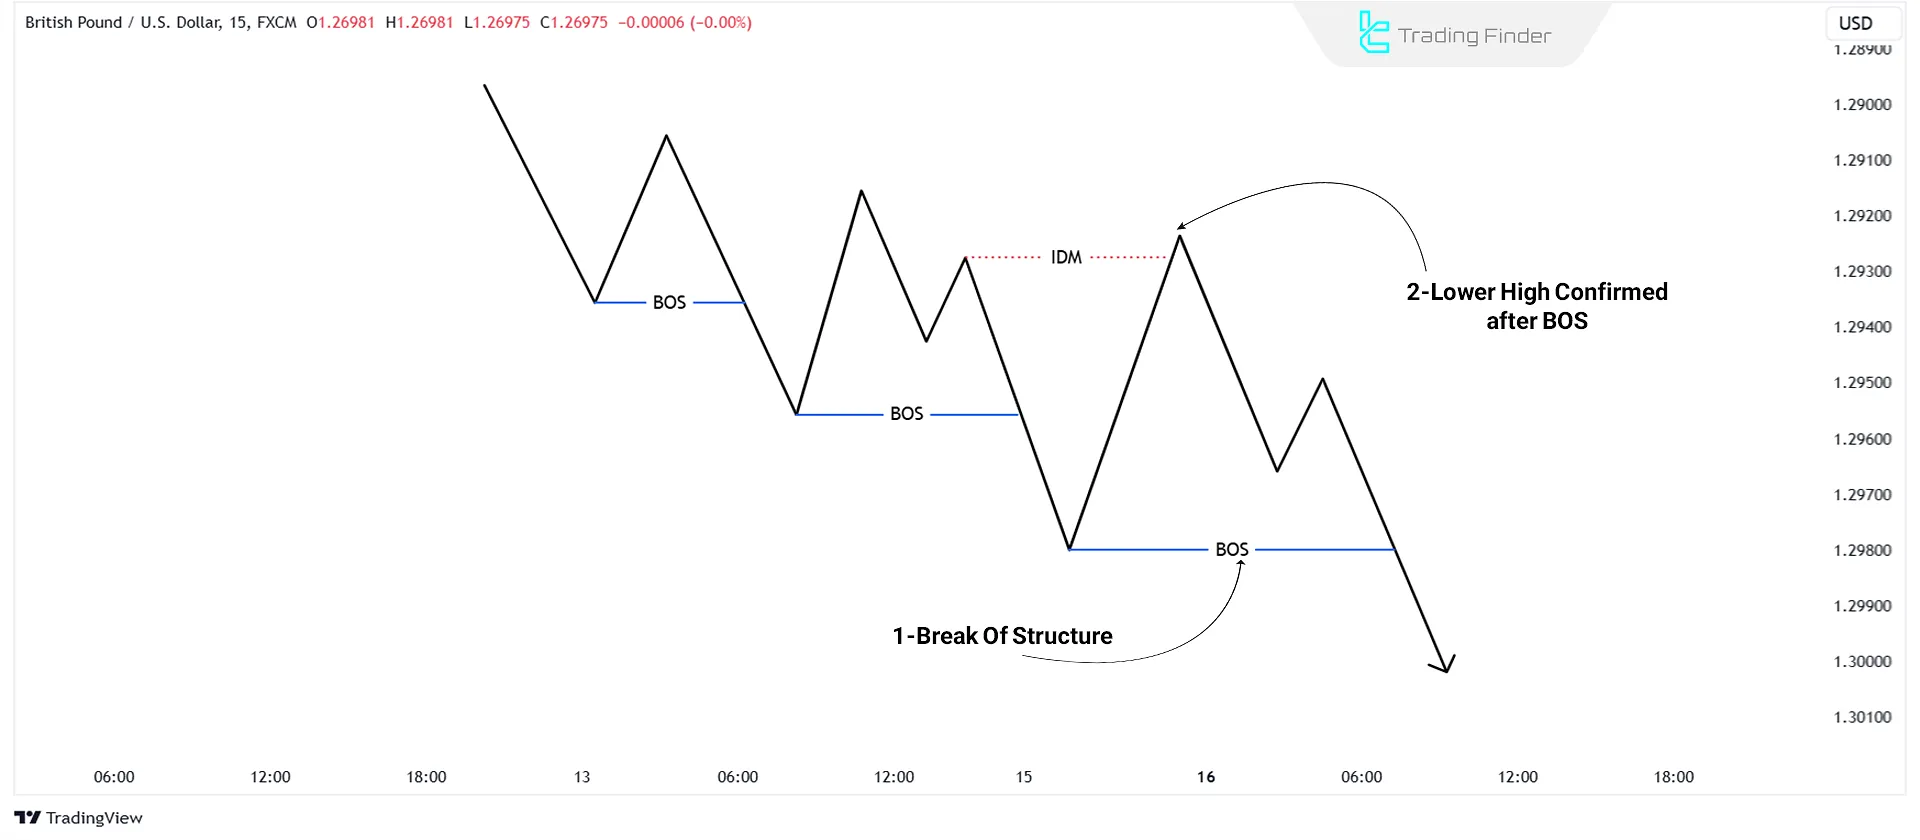
With every downward Break of Structure, watch for liquidity sweeps and the next structural break to confirm the Lower High.
Tip: Lower Highs are often the best points for entering sell trades, as the risk-to-reward ratio at these points is optimal.
The educational video on the TTrades channel provides specialized explanations about market structure and methods for identifying lower highs and lower lows on the chart, and interested viewers can make use of it.
Identifying reversal structures (LL and LH in an Uptrend)
At times, lower lows (LL) and lower highs (LH) can even be observed within an uptrend and act as early signs of trend weakness:
- The formation of an LH within a bullish structure points to a reduction in buying strength;
- The formation of an LL during an upward move indicates seller presence and the potential emergence of a Change of Character (CHOCH).
If, after these points, a Break of Structure (BOS) is triggered in the opposite direction, the trader should seriously consider the possibility of a trend reversal.
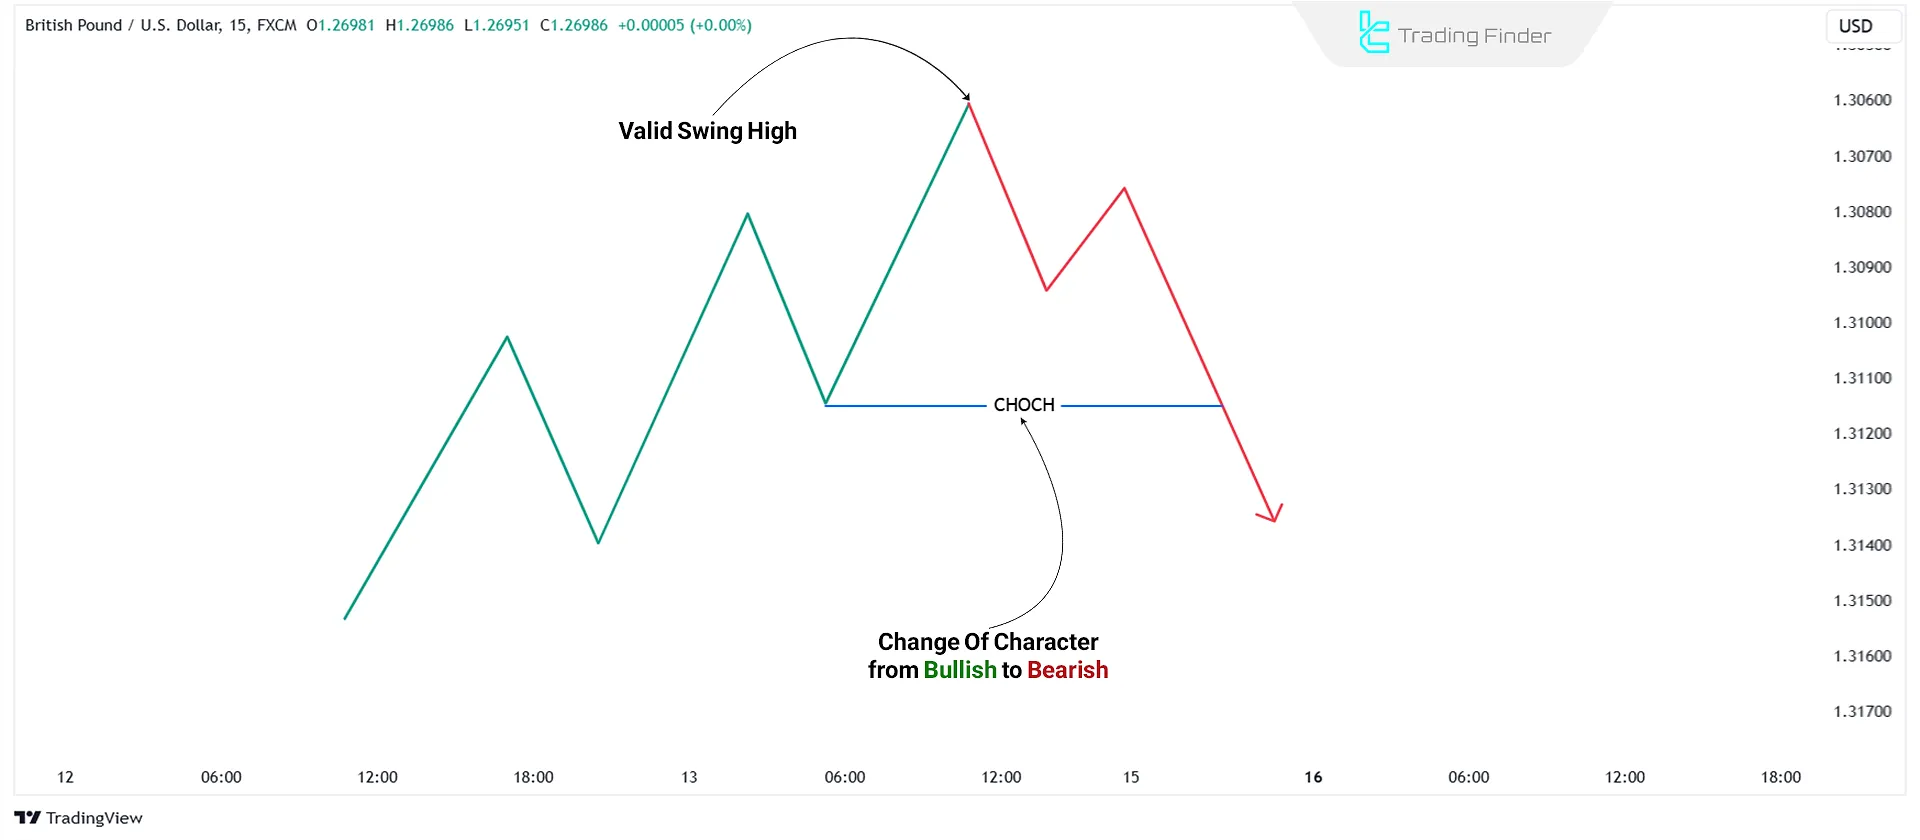
How to Identify Structural Highs After a Bearish CHOCH?
To identify a structural high after a bearish Change of Character (CHOCH):
- Mark the last Higher High before the CHOCH;
- When the market transitions from bullish to bearish, the last Higher High of the bullish trend is marked as the structural high, as the bearish trend begins from there.
After every Break of Structure, follow Inducement sweeps and the downward BOS to confirm the Lower High.
How to Identify Structural Lows After a Bearish CHOCH?
CHOCH means Change of Character; therefore, when the market shifts its trend from bullish to bearish, a lower low should be marked.
To identify a structural low after a bearish CHOCH, first identify inducement (IDM) and wait for a swing low to form. After the swing low forms and inducement has occurred, the most recent swing low is marked as a valid structural low.
As the bearish trend continues, the price is likely to decline, breaking the previous low and creating a new low.
After every Break of Structure (BOS), look for Inducement sweeps to confirm the Lower Low.
When does a Bearish Trend Structure Change and Break Down?
A bearish trend remains valid as long as price movement can consistently maintain the sequence of lower highs and lower lows; that is, the cycle of LH followed by LL and again LH and LL continues in an orderly manner.
However, this structural pattern is not permanent and may lose its stability due to changes in price behavior or a reduction in selling pressure, causing the trend to weaken or move toward a reversal. A bearish trend becomes disrupted when:
- Price fails to form a new and lower low;
- A new high forms above the previous high (the first Higher High).
If the first sign of structural weakness appears and, after the formation of an HH, price retraces but forms a Higher Low, the trend structure is completely broken and the probability of a directional change becomes significant.
This concept is particularly important for traders who base their analysis on market structure, as it prevents them from entering sell trades in areas where the likelihood of price reversal and increased risk exists.
In addition, understanding this structural behavior helps traders identify early signs of CHOCH or a reverse BOS sooner and recognize a potential trend change in a timely manner.
In the article on teaching the structure of a bearish market trend on the website writofinance.com, further explanations are provided regarding the structure of a downtrend and the formation of lower highs and lower lows, which interested readers can refer to.
Key Points for Using Lower Lows and Lower Highs
Before proceeding to use lower highs and lower lows, it is necessary to pay attention to the following points:
- Focus on Liquidity: Price sweeping liquidity is one of the most reliable signs to confirm bearish lows and highs;
- Risk Management: When entering sell trades near Lower Highs, place stop losses above these highs;
- Appropriate Time Frame: Use mid and long time frames for more accurate structure identification.
Common Mistakes in Identifying lower Highs and Lower Lows
When identifying a bearish trend based on LH and LL, many traders make similar mistakes. The most important of these errors are listed below:
Common mistakes | Description |
Ignoring the higher timeframe | Lack of alignment between the bearish structure on the lower timeframe and the dominant direction of the higher timeframe |
Late trade entry | Entering after the formation of an LL and positioning at the end of the wave instead of focusing on the LH or a pullback after a BOS |
Trading in neutral ranges | Relying on LH/LL structure in range-bound markets, leading to reduced analytical accuracy |
Marking false swings | Interpreting minor price fluctuations as market structure without valid BOS or CHOCH confirmation |
Ignoring trading volume | Formation of an LL accompanied by decreasing volume, signaling weakness in selling pressure |
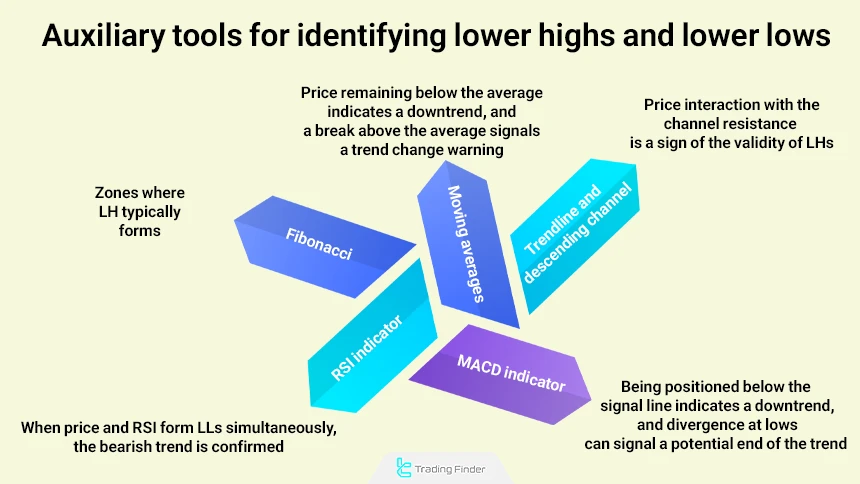
Auxiliary Tools for Identifying LH and LL
Although identifying LH and LL is more accurate through price action, some tools can be used as confirmations of a bearish trend:
- Moving averages: Price trading below the averages indicates seller dominance and the formation of valid LH/LL. Repeated breaks of the averages to the upside can be an early sign of an increased probability of forming HH and the end of the bearish trend;
- Trendlines and descending channels: Repeated price reactions at the channel resistance line indicate the formation of valid LHs and confirm the persistence of the bearish structure;
- Fibonacci retracement: In many markets, LHs often form at one of these retracement zones and act as common areas where sellers re-enter;
- RSI indicator: The formation of an LL in price accompanied by an LL in RSI indicates a healthy and continuing bearish trend. However, an LL in price combined with an LH or HH in RSI signals divergence and serves as a warning of weakening bearish momentum;
- MACD indicator: MACD positioned below the signal line is considered confirmation of a bearish trend. Observing MACD divergence at lows can also be a sign of CHOCH or a potential end to the bearish structure.
Previous Highs and Lows Indicator for MetaTrader
The Previous Highs and Lows indicator on the MetaTrader platform analyzes raw price data and extracts the most important historical High and Low levels, displaying them as horizontal lines on the chart.
These static or dynamic lines act as sensitive support and resistance zones and hold a key role in interpreting price behavior.
This indicator falls within the category of support and resistance tools, trading tools, and technical levels, and is suitable for traders with an intermediate skill level. Due to its structural nature, it is also classified under reversal tools and price breakout identification tools.
It can be applied across all tradable markets available on MetaTrader, including Forex, the stock market, and cryptocurrency, and offers specialized functionality in day trading styles as well as multi-timeframe analysis (Multi-Timeframe Analysis).
In bullish conditions, price breaking above a previous high signals increasing buying strength. For example, on the 1-hour timeframe of a currency pair, breaking a prior High confirms the start of a new phase of price growth and defines a suitable zone for entering buy trades.
In bearish conditions, breaking a previous low on the 5-minute timeframe indicates strengthening selling pressure. A price retracement back to the broken level and its conversion into resistance is commonly considered a low-risk entry opportunity for sell positions.
This indicator features a relatively comprehensive settings panel. Options such as displaying pivot levels, ZigZag-related settings including “PERIOD” and “BACKSTEP,” enabling or disabling ZigZag lines, defining the colors of High and Low lines, and adjusting line thickness are available.
In addition, defining the historical lookback range (HISTORY LIMIT) allows traders to customize the indicator’s display according to their analytical style.
Overall, the Previous Highs and Lows indicator accurately extracts historical high and low points—levels where price typically reacts. Based on these zones, traders can more precisely identify entry, exit, breakout, or reversal areas and develop a more coherent analytical structure.
YouTube:
Conclusion
Lower Highs (LH) and Lower Lows (LL) indicate market weakness and the tendency to continue the bearish trend. To identify valid Lower Highs and Lower Lows, focus on key concepts like Break of Structure (BOS), Change of Character (CHOCH), and Inducement (IDM).
In this structure, confirmation of bearish trend strength increases when breaks are accompanied by adequate momentum and acceptable volume, and price fails to reclaim the previous high after a pullback.
Additionally, analyzing price reactions at supply zones and its behavior after liquidity collection can help filter out weak signals and improve analytical accuracy.


