ABCD and Three-Drive; Harmonic Patterns in technical analysis & Fibonacci ratios

Rajesh  Sharma

Reviewer:

Rajesh Sharma
Eda Kaya

Fact checker:

Eda Kaya
Modified:
Comments:0
Views:118
5 Min

Harmonic patterns, based on Fibonacci ratios, are among the tools used in technical analysis. The ABCD pattern and the Three-Drive pattern are two harmonic patterns that can be used to identify reversal points and trend continuation signals.

ABCD and Three Drive Patterns
ABCD and Three Drive in Harmonic Patterns

What is the ABCD Pattern?

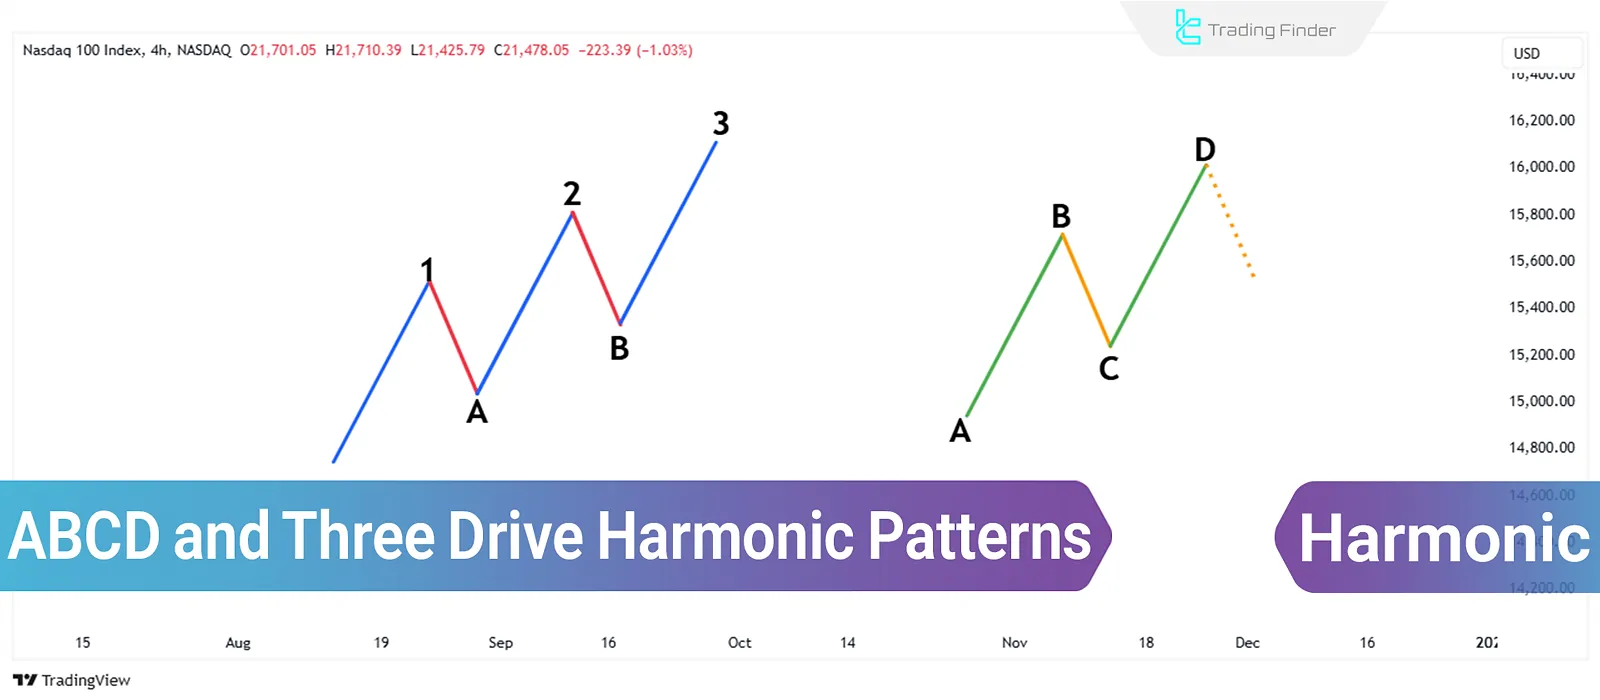
The ABCD pattern is one of the most basic harmonic patterns. It consists of four main points:

  • Two price movements (AB and CD)
  • One corrective wave (BC)

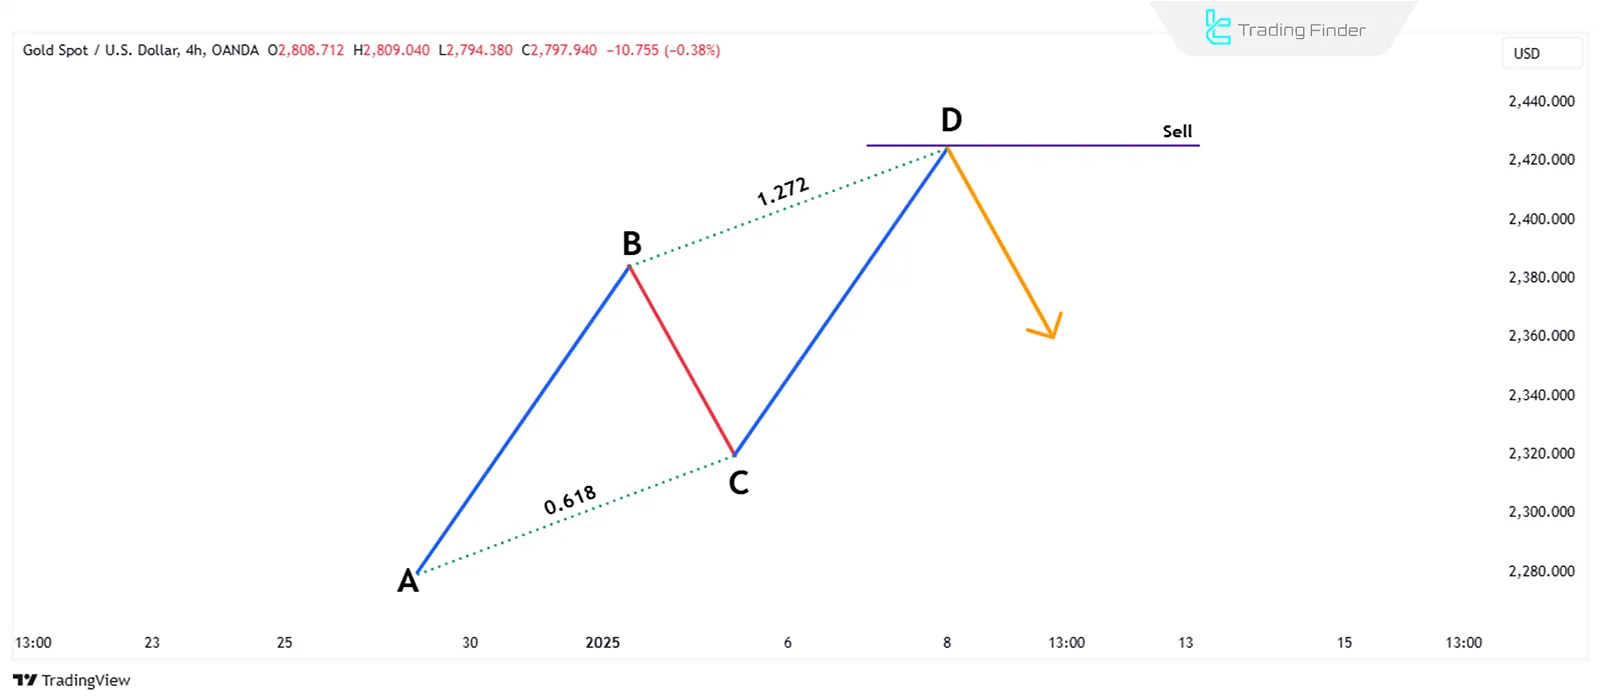
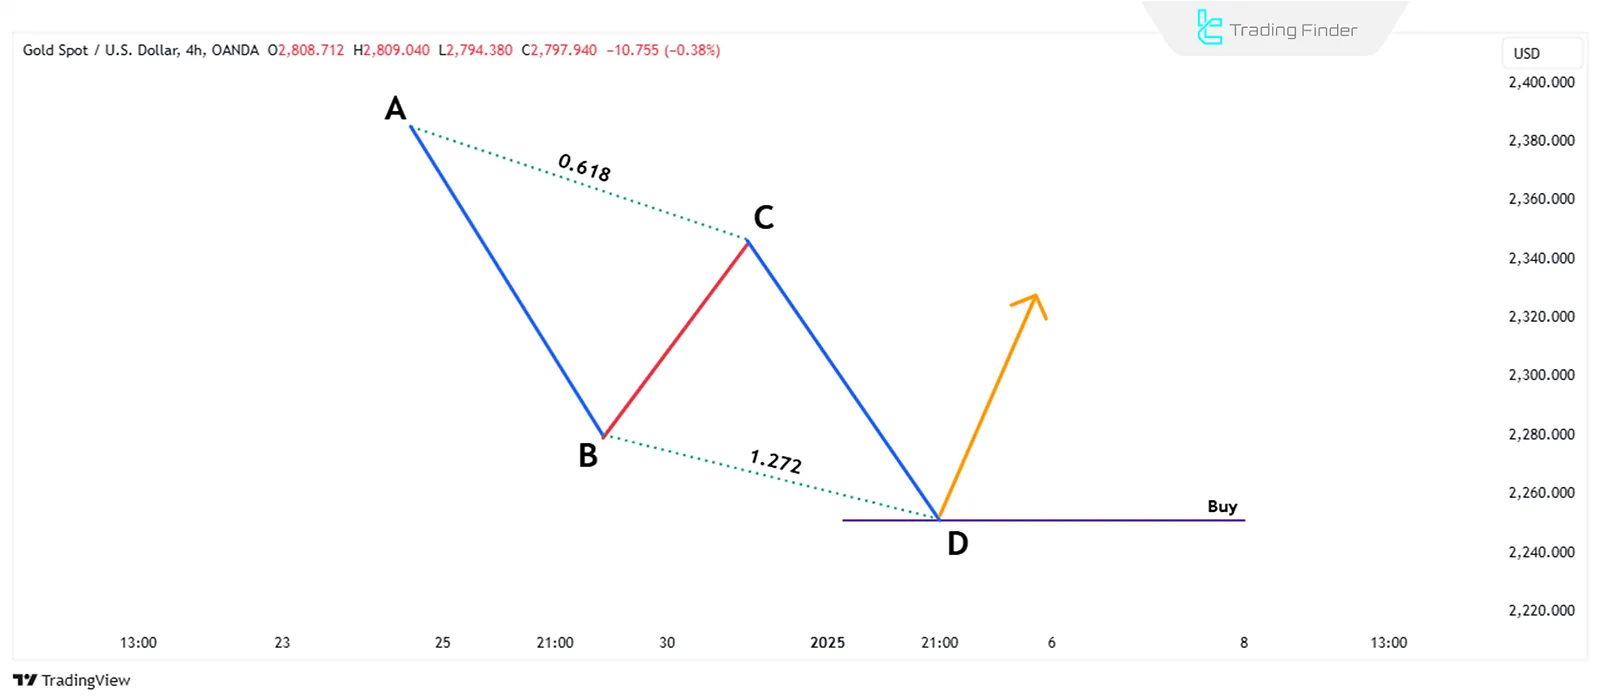
Using Fibonacci tools is essential to detect this pattern. In this pattern, the BC correction should extend to the 0.618 level of the AB wave, and the CD wave should continue to the 1.272 Fibonacci extension of the BC correction.

You can use Trading Finder's indicators to make working with the ABCD pattern easier:

ABCD Harmonic Bearish Pattern
Schematic of the ABCD Harmonic pattern in a bearish market where the entry point after the pattern completion is visible

When does the ABCD pattern form?

The ABCD Harmonic pattern is valid when the following conditions are met:

  • The length of the AB wave should be equal to the length of the CD wave;
  • The time taken for price movement from A to B should be equal to the time taken for price movement from C to D;
  • The entry point into the trade is determined after the pattern is completed and the price reaches point D.

    To simplify the use of the Three Drives pattern, you can use the indicators provided by the Trading Finder collection:

ABCD Harmonic Bullish Pattern
Schematic of the ABCD Harmonic pattern in a bullish market where the entry point after the pattern completion is visible

What is the Three-Drive Pattern?

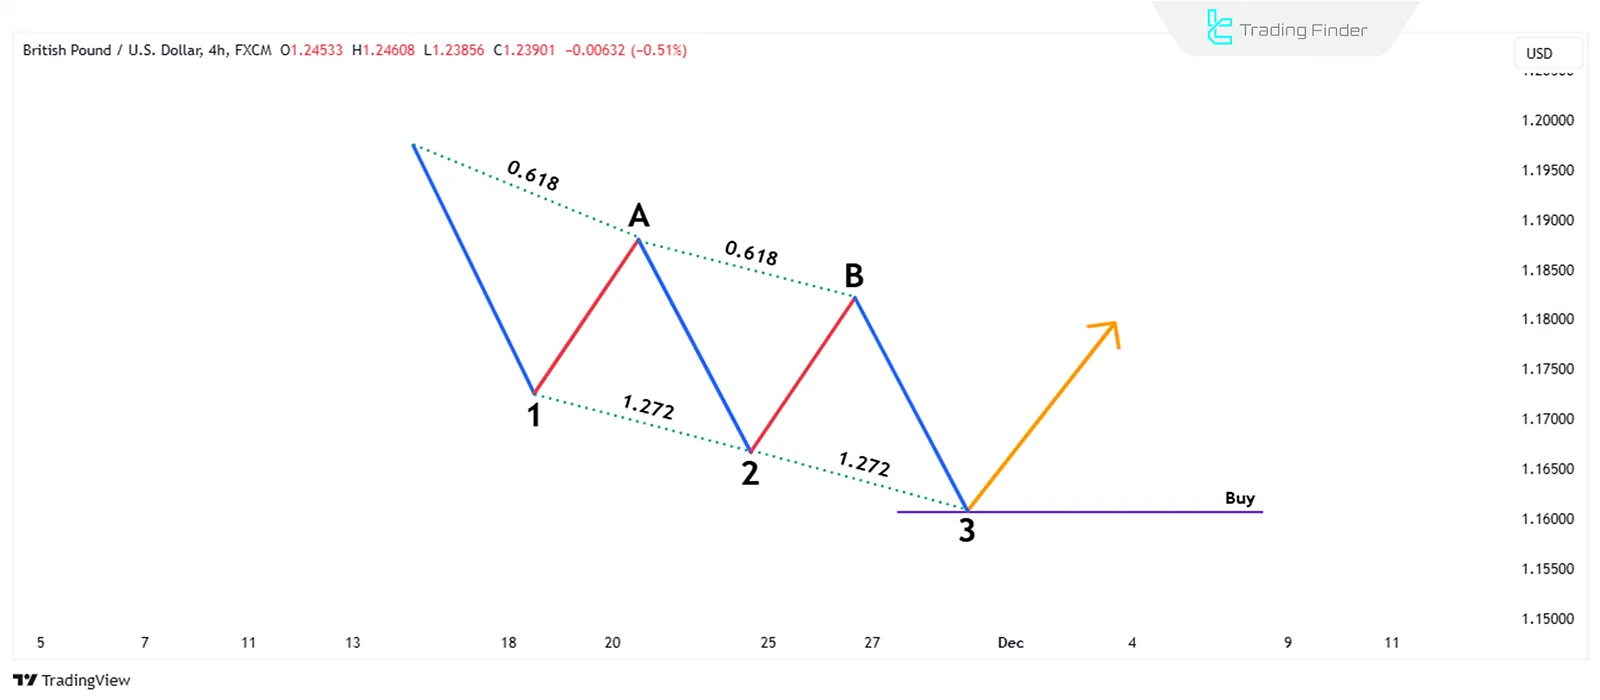
Although the Three-Drive pattern shares many similarities with the ABCD pattern, it has three price movements (Drive 1, Drive 2, and Drive 3) in alignment, with two corrective waves, A and B, formed between them.

This pattern resembles the Elliott Wave's five-wave structure and can predict future price movements.

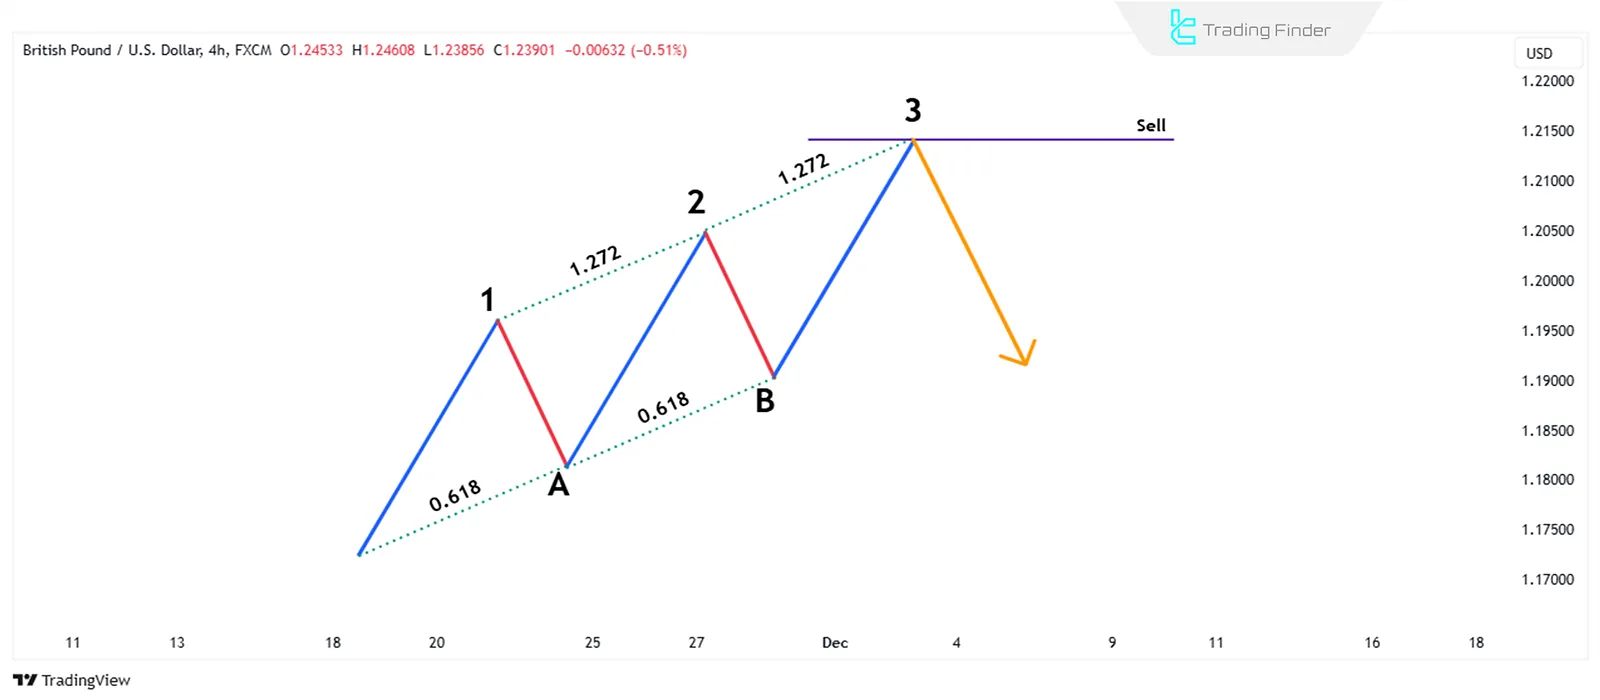
In this pattern, point A must be at the 0.618 corrective level of the first wave, and point B should be at the 0.618 corrective level of the second wave.

The second wave must extend to the 127.2% Fibonacci extension of the A correctio; The third wave should extend to the 127.2% Fibonacci extension of the B correction.

Three-Drive Harmonic Bearish Pattern
Schematic of the Three-Drive Harmonic pattern in a bearish market, where the entry point after the pattern completion is visible

When does the Three-Drive pattern form?

The Three-Drive Harmonic pattern will be valid when the following conditions are met:

  • The time required to complete the second wave must equal the time required to complete the third wave;
  • The time for the A correction should be equal to the time for the B correction;
  • The entry into the trade occurs after the pattern is completed and the price reaches the final point of Drive 3.
Three-Drive Harmonic Bullish Pattern
Schematic of the Three-Drive Harmonic pattern in a bullish market, where the entry point after the pattern completion is visible

Conclusion

The ABCD and Three-Drive harmonic patterns are some of the most important harmonic patterns in technical analysis. They help identify potential price reversal points using Fibonacci ratios.

Following the necessary conditions to validate these patterns and using tools like Fibonacci levels correctly enhances their accuracy.

FAQs

How do the ABCD and Three-Drive harmonic patterns apply in technical analysis?

Identifying these patterns on price charts helps recognize potential market reversal points. Additionally, they help determine suitable entry and exit levels.

What is the difference between the ABCD and Three-Drive patterns?

While the ABCD pattern consists of two price movements and one correction, the Three-Drive pattern consists of three price movements and two corrections, structurally resembling the Elliott Wave theory.

How can the validity of the ABCD and Three-Drive patterns be confirmed?

The main criteria for confirming these patterns include matching Fibonacci ratios and ensuring the length and time of the waves meet the pattern's requirements.

What tools can be used to identify the ABCD and Three-Drive harmonic patterns?

Fibonacci retracement and extension tools are used to determine price correction and extension levels, which are key in accurately identifying these patterns.

How is the entry point into trades determined for the ABCD and Three-Drive patterns?

After the pattern is completed and the price reaches the final point D in the ABCD pattern or Drive 3 in the Three-Drive pattern, the entry into the trade can be made based on confirmation signals.

What conditions are considered for the validity of the ABCD pattern?

The primary conditions for this pattern are the equality of the AB and CD wave lengths, matching the time taken for price movements A-B and C-D, and compliance with Fibonacci ratios.

What role do Fibonacci ratios play in confirming the Three-Drive pattern?

The A and B corrective points must align with the 0.618 level of the previous waves, and the price movements of Waves 2 and 3 should extend to the 127.2% Fibonacci extension of the previous correction for the pattern to be valid.

What is the most common mistake when using the ABCD and Three-Drive harmonic patterns?

Entering the trade too early without waiting for the pattern to be fully complete and not respecting the Fibonacci ratios are common mistakes that reduce the accuracy of the analysis.

score of blog
5 From 5.0
(1)
Rate this post
0Comment