


The Gartley harmonic pattern in Forex Markets, introduced by Harold “McKinleyGartley”, identifies potential reversal points in price trends using Fibonacci ratios.
It shows traders optimal entry and exit points in the forex and other financial markets.
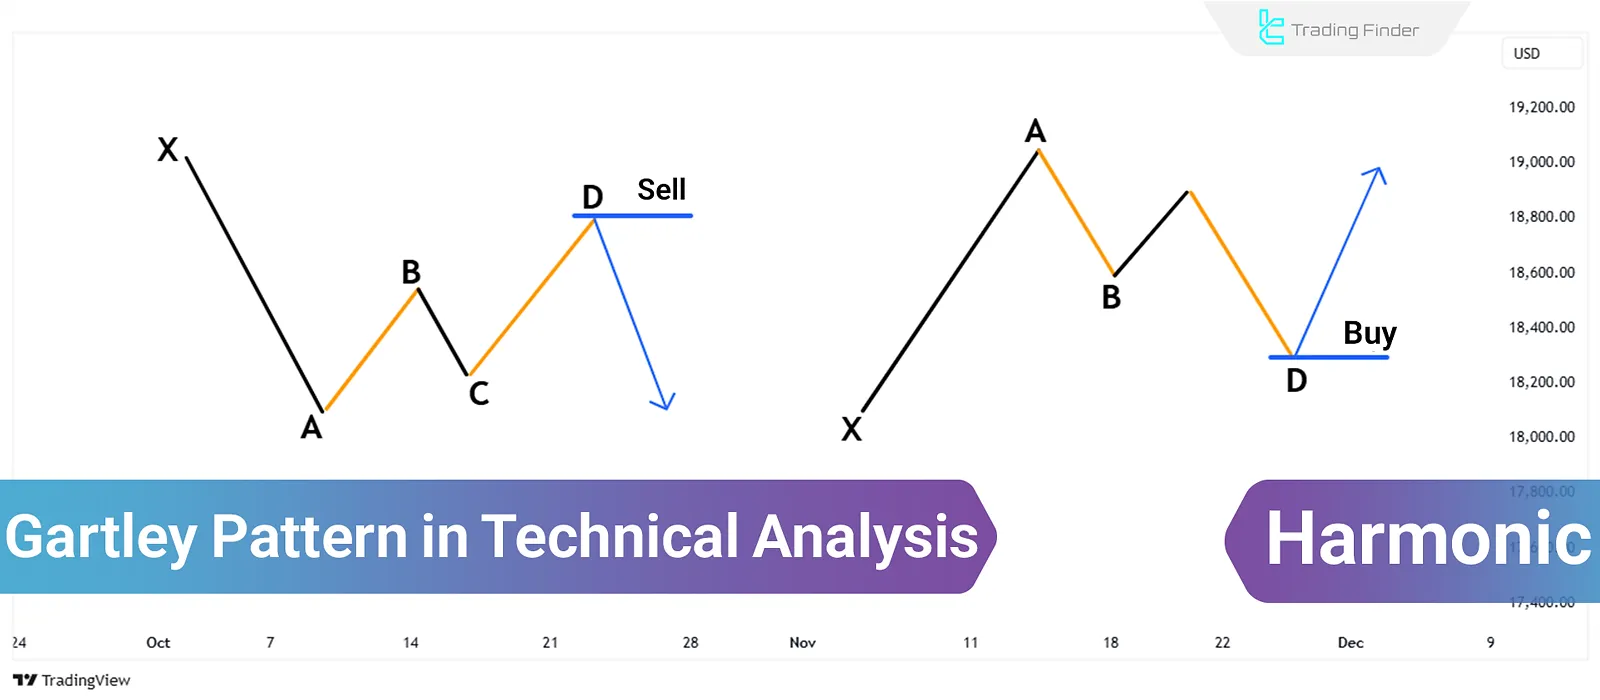
What is the Gartley Pattern?
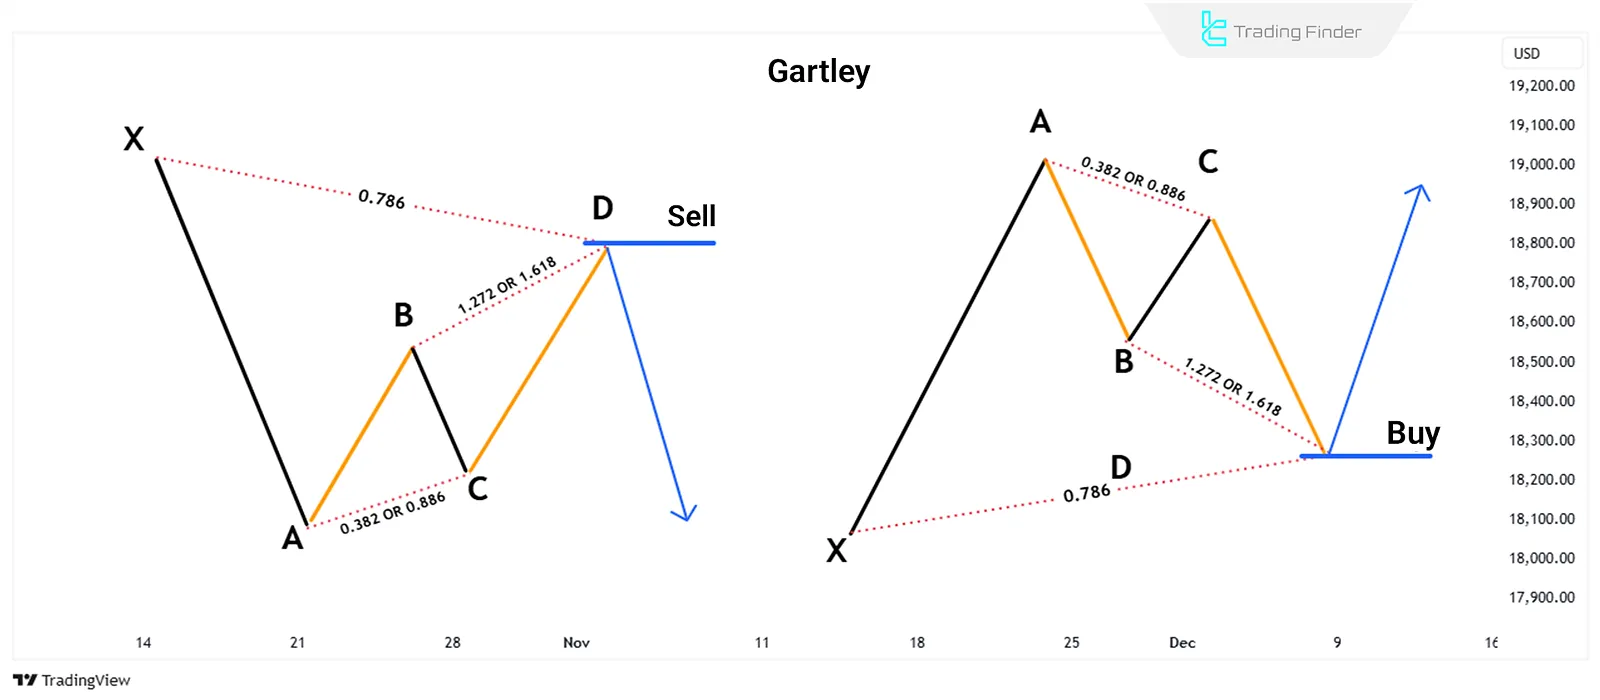
The Gartley pattern, or "222," combines the ABCD pattern with an additional point known as X.
This pattern typically forms during a trend correction and resembles the letter M in an uptrend or W in a downtrend.
The structure of this pattern includes four price movements calculated based on Fibonacci ratios:
- The AB move must be 0.618 retracement of the XA move;
- The BC move is a 0.382 or 0.886 retracement of the AB move;
- If BC is 0.382 of AB, CD should be 1.272 times BC;
- If BC is 0.886 of AB, CD will be 1.618 of BC;
- The CD move is a 0.786 retracement of the XA move.
How to Trade with the Gartley Pattern?
To trade with the Gartley pattern, the pattern needs to be fully complete. Then, Fibonacci ratios and other technical analysis tools can be used to determine the entry point, stop loss, and take profit.
Key points for using the Gartley pattern:
- Entry Point: You can enter the trade when the price reaches point D and shows signs of trendreversal;
- Stop Loss: Typically set slightly below point X for buy trades and above point X for selltrades;
- Take Profit: Based on Fibonacci ratios, the firstprice target can be point B, and the next target would be point C.
The Gartley Pattern and Other Harmonic Patterns
Modifications were made after the popularity of the Gartley pattern, and new harmonic patterns were developed based on it. Some of them include:
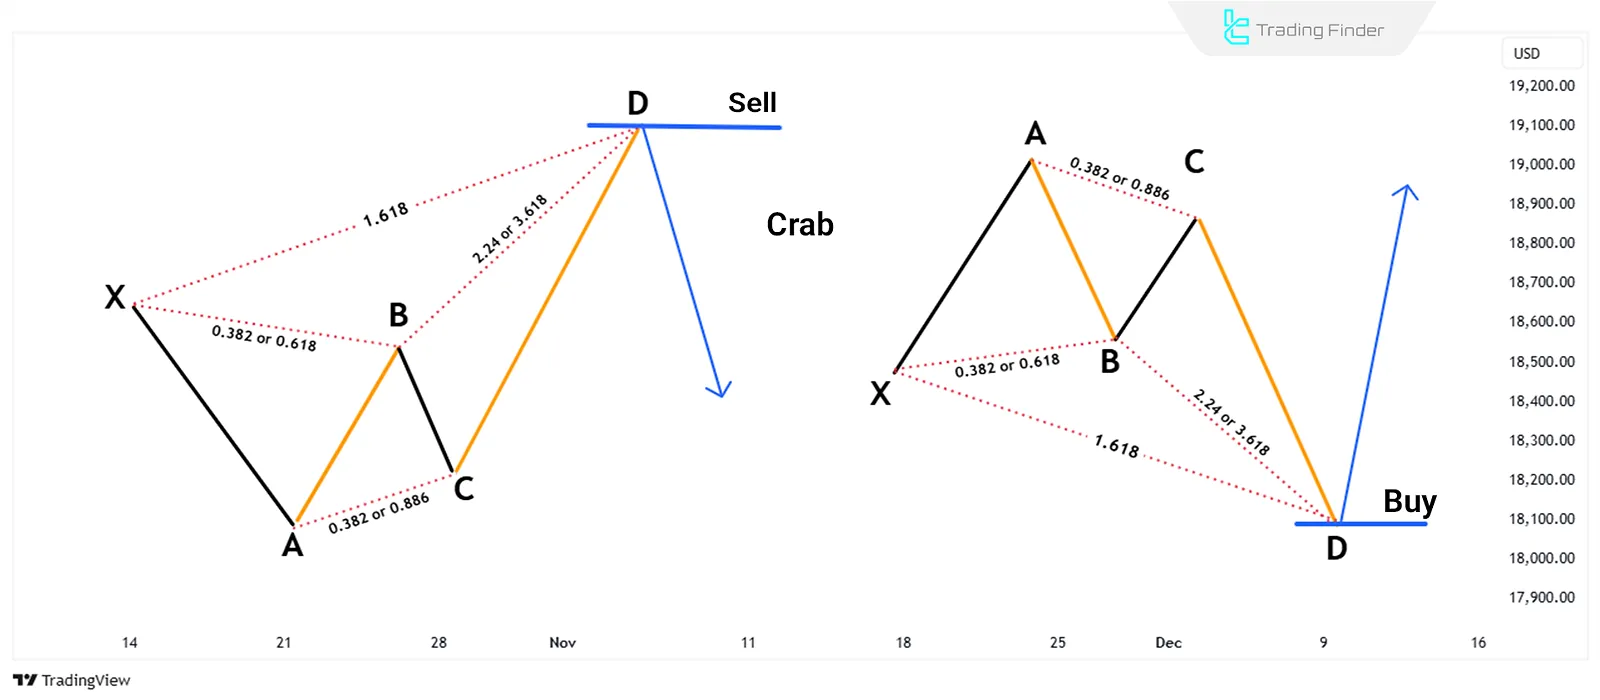
Crab Pattern
Using extended Fibonacci ratios, the Crab pattern is one of the most accurate harmonic patterns. This pattern can identify price reversal points with high accuracy.
This pattern was introduced by “Scott M. Carney” in 2000. The reversal point in the Crab pattern is further from the Gartley pattern, which increases the risk-to-reward ratio.
Features of the Crab pattern:
- AB move must be 0.382 or 0.618 of the XA move;
- BC move can be 0.382 or 0.886 of the AB move;
- If BC equals 0.382 of AB, CD must be 2.24 times BC;
- If BC equals 0.886 of AB, CD must be 3.618 of BC;
- The CD is 1.618 of the XA move.
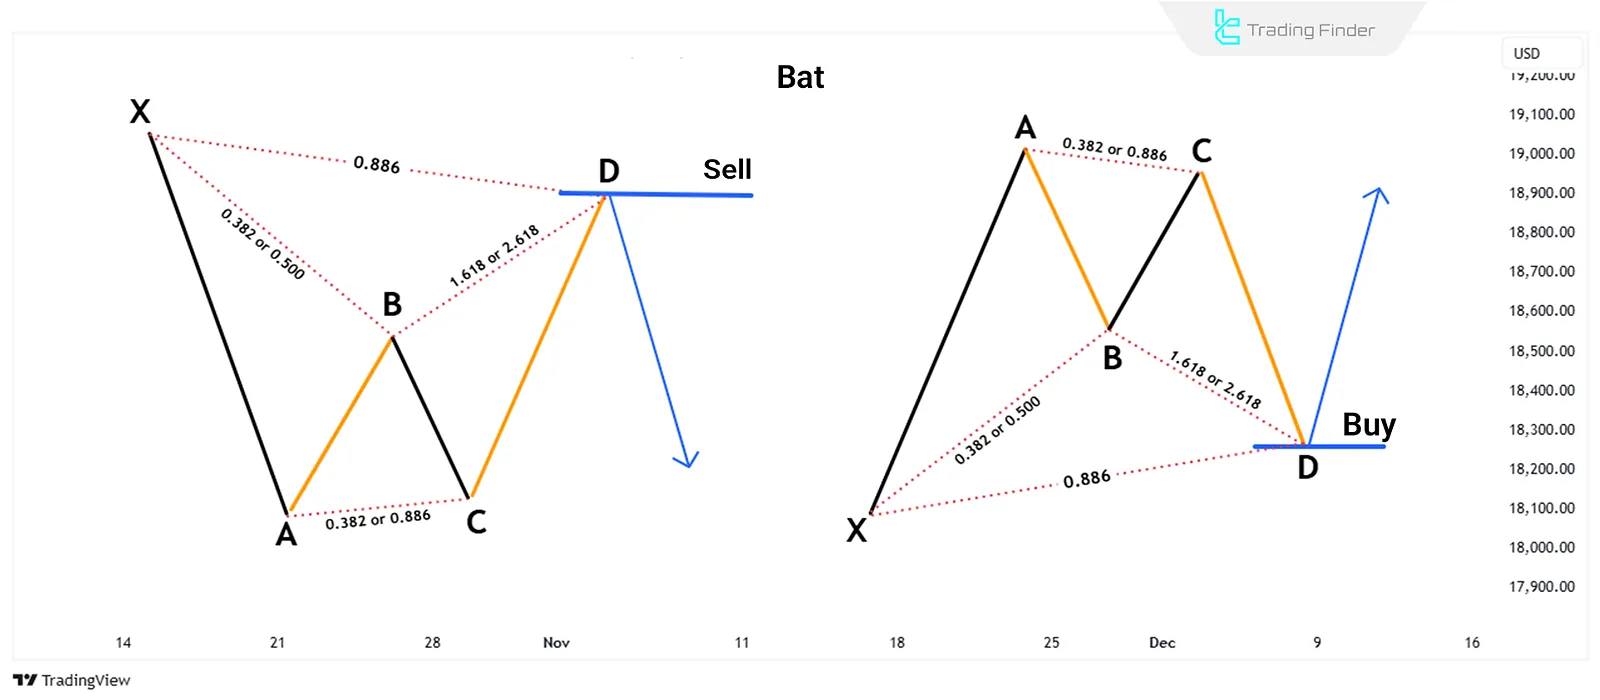
Bat Pattern
The Bat pattern is similar to the Gartley pattern but has different Fibonacci ratios, showing deeper reversal points. This pattern is especially useful in volatile markets.
In 2001, Scott Carney introduced another pattern called the "Bat". The reversal point in this pattern lies at the 0.886 level of the XA move.
Features of the Bat pattern:
- AB move must be 0.382 or 0.500 of the XA move;
- BC move can be 0.382 or 0.886 of the AB move;
- If BC equals 0.382 of AB, CD should be 1.618 of BC;
- If BC equals 0.886 of AB, CD should be 2.618 of BC;
- The CD is 0.886 of the XA move.
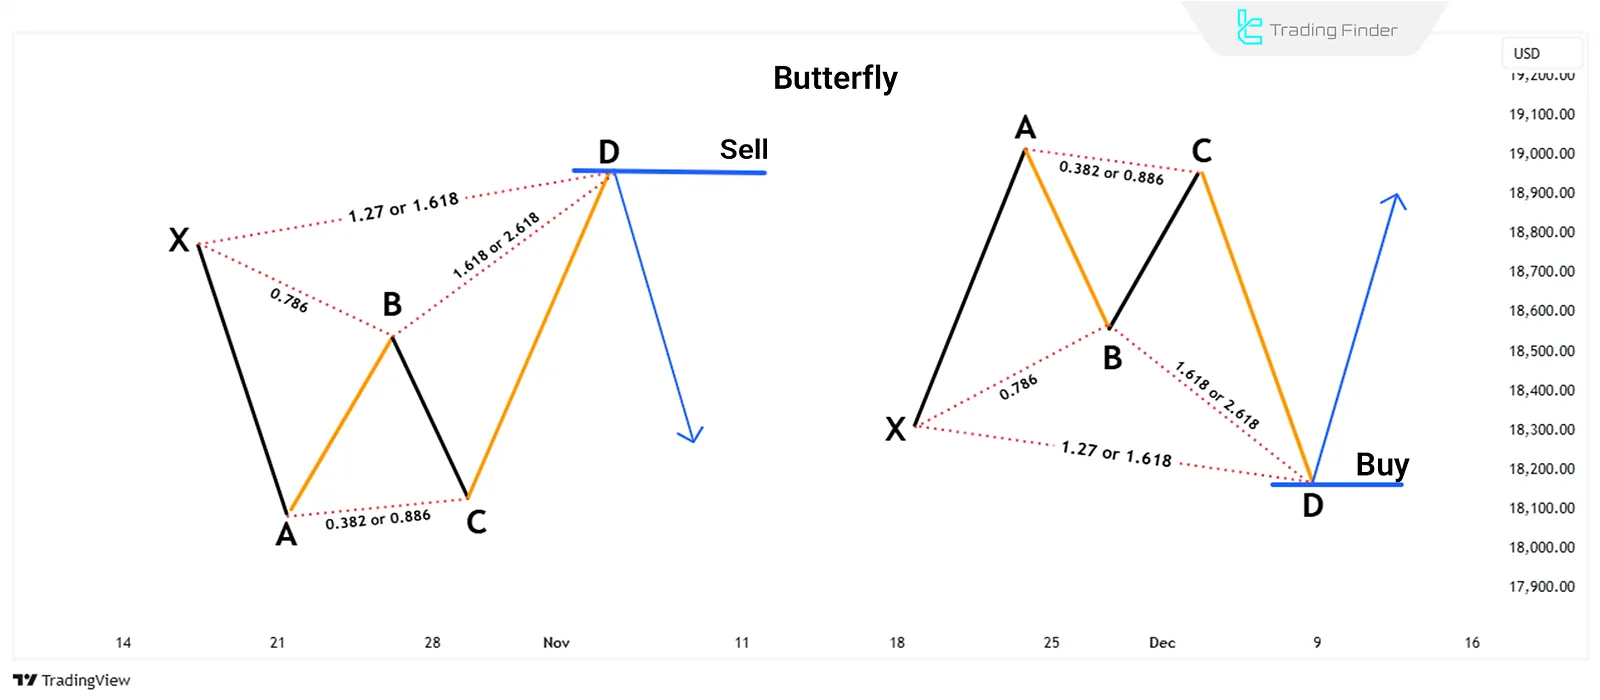
Butterfly Pattern
The Butterfly pattern has deeper reversal points compared to the Gartley pattern and uses specific Fibonacci ratios to determine entry and exit points.
The Butterfly pattern was introduced by Bryce T. Gilmore and is used to identify price reversal points when the market reaches an extended (higher) level.
Features of the Butterfly pattern:
- AB move is 0.786 of the XA move;
- BC move can be 0.382 or 0.886 of the AB move;
- If BC equals 0.382 of AB, CD should be 1.618 of BC;
- If BC equals 0.886 of AB, CD should be 2.618 of BC;
- The CD is 1.272 or 1.618 of the XA move.
Advantages and Disadvantages of Harmonic Patterns Based on the Gartley Pattern
In the table below, the advantages and disadvantages of each pattern are reviewed:
Pattern Name | Disadvantages | Advantages |
Gartley Pattern | Requires experience for accurate identification and drawing, less effective in some volatile markets | Reliable and common in the market, accurate reversal point identification, suitable risk-to-reward ratio |
Crab Pattern | Wider stop loss, higher risk due to rapid price movements | Very accurate reversal point identification, high potential profit opportunities |
Bat Pattern | More complexity in pattern identification, requires additional confirmation for entry | High success rate, smaller stop loss, suitable for volatile markets |
Butterfly Pattern | Complexity in identifying and executing correctly, variable risk-to-reward ratio | High profit potential, suitable for identifying strong reversal points |
Conclusion
The Gartley pattern in technical analysis is one of the most effective tools for identifying trend reversal points in forex and cryptocurrency markets.
To execute the Gartley pattern successfully, it requires a good understanding of Fibonacci ratios and precise identification of entry and exitpoints.


