


TradingView Tutorial helps traders in various financial markets such as crypto, Forex, stocks, symbols, etc. to get familiar with the most useful sections of this platform such as charts, indicators, drawing tools, Fibonacci, and more.

Market enthusiasts can enhance their speed and accuracy in trading with helpful features, such as back-testing, Pine Script, and Screener.
What is TradingView?
As discussed in the What is TradingView? article, TradingView is a powerful financial tool that displays real-time asset prices on charts.
Traders can analyze financial markets using various features offered by the platform.
Registration and Account Login
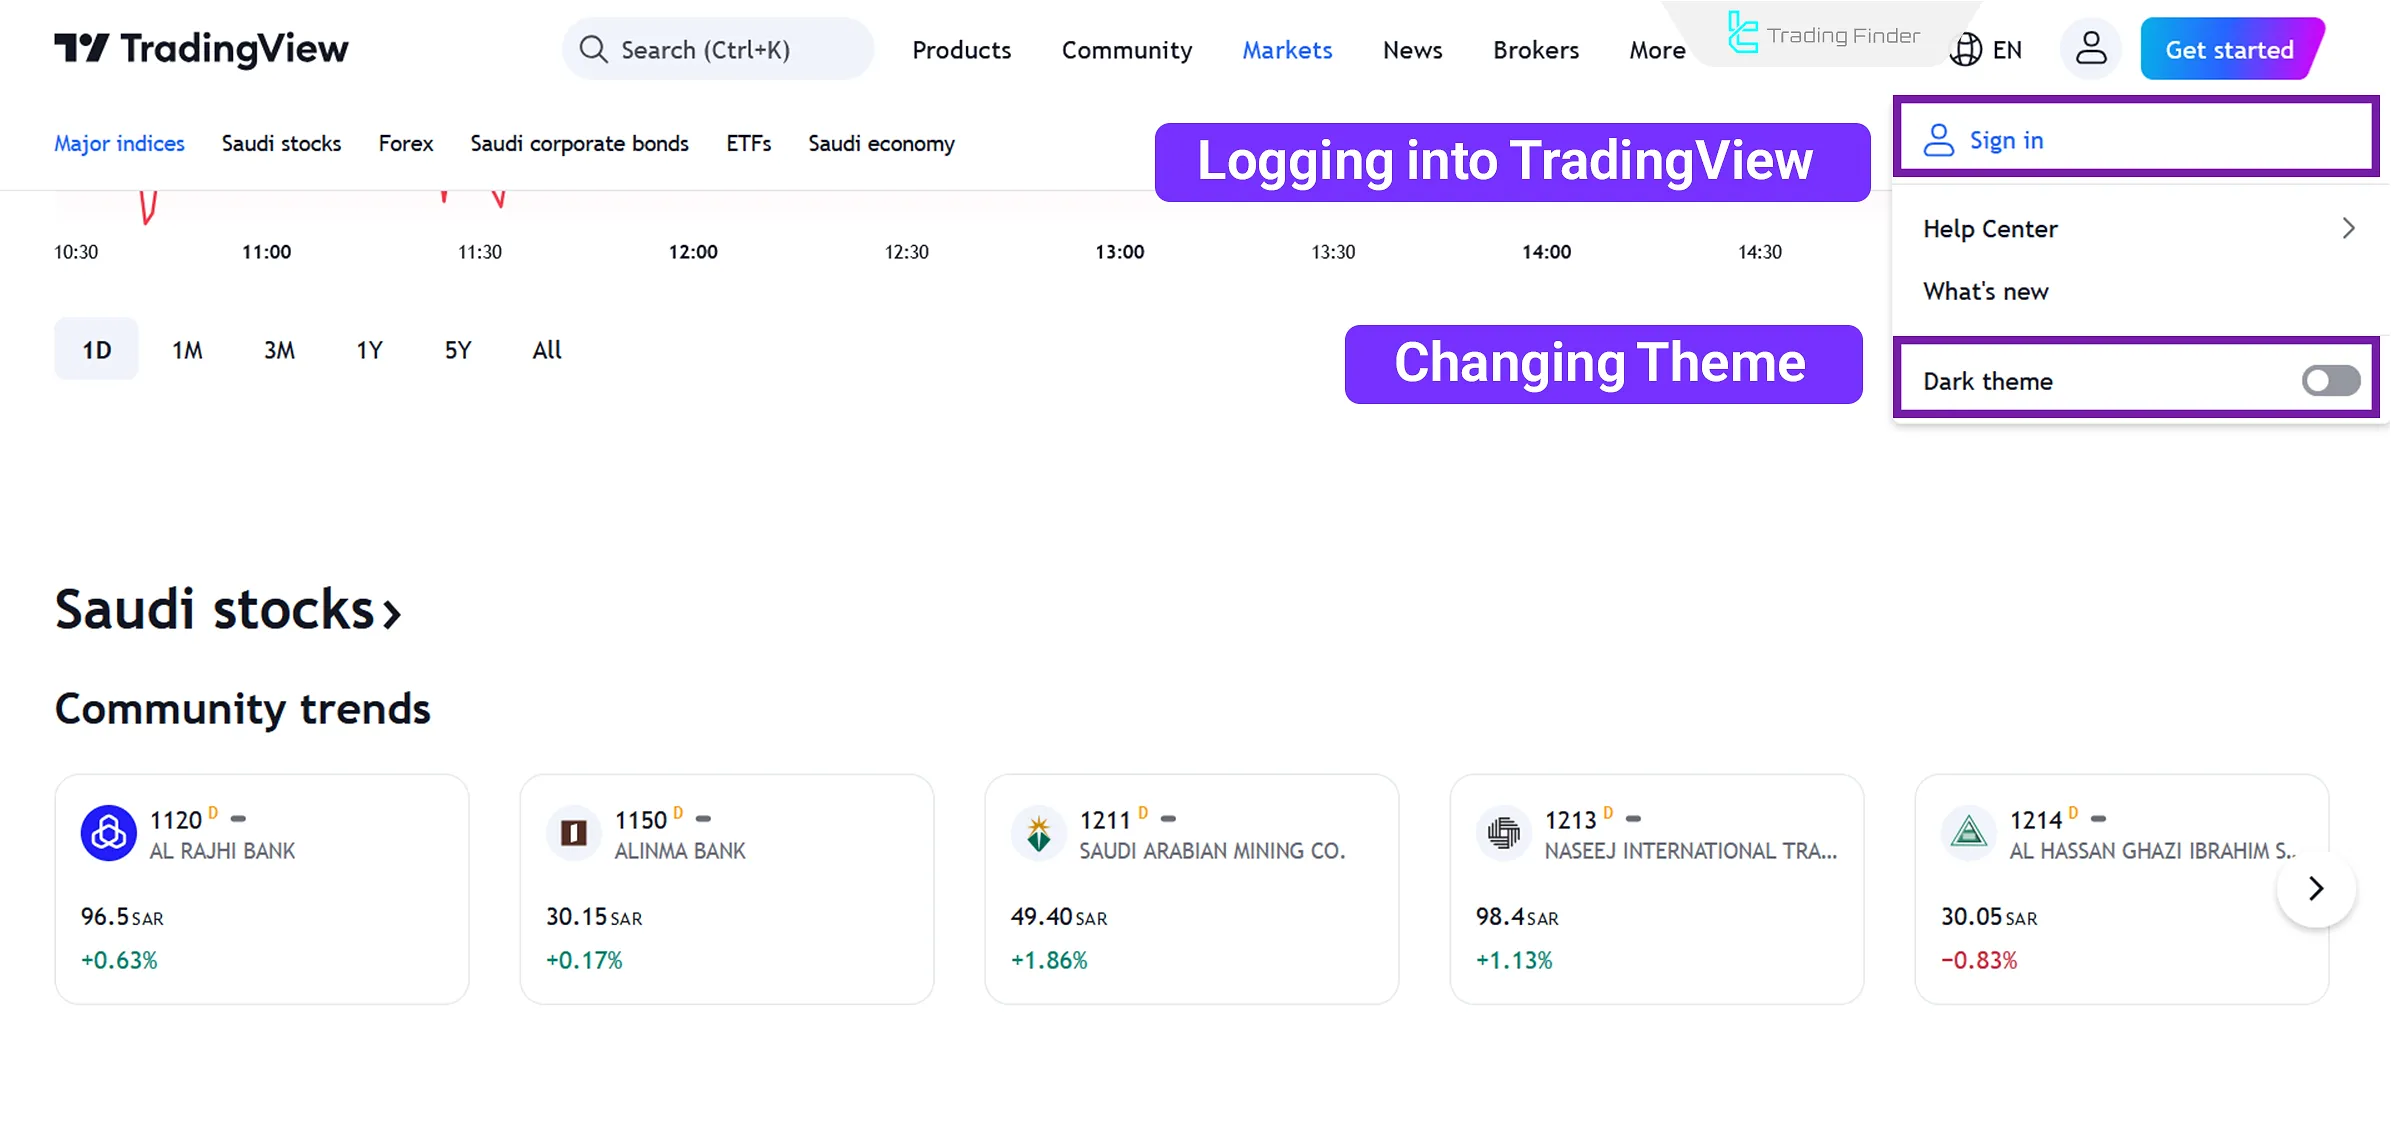
Clicking the designated icon in the top-right corner on the platform's website reveals a dropdown menu. This menu allows you to log in to your account (if you already have one).
After clicking on the "Sign In" button, a login form requires your email, username, and password. You can also log in via LinkedIn, Twitter, Facebook, and other accounts.
If you haven't created an account yet, click on the "Get Started" button to do so.

This straightforward process involves entering your email or linking your account to Google or Apple.
Once registered, you can use the platform's free version or upgrade to premium versions for additional features.
The TradingView user interface is simple and intuitive. The drawing tools for technical analysis are located on the left side, the price chart is displayed in the center, and additional services and features are available on the right side.
Working with Charts and Searching for Trading Symbols
Charts are the heart of TradingView. Below, the process of working with financial charts on this platform is explained in 3 steps:
- Search for the desired trading symbol (e.g., BTCUSD for Bitcoin, EURUSD for forex, etc.)
- Select the chart's timeframe (ranging from 1 minute to monthly)
- Set the chart style (line, candlestick, Heiken Ashi, etc.)
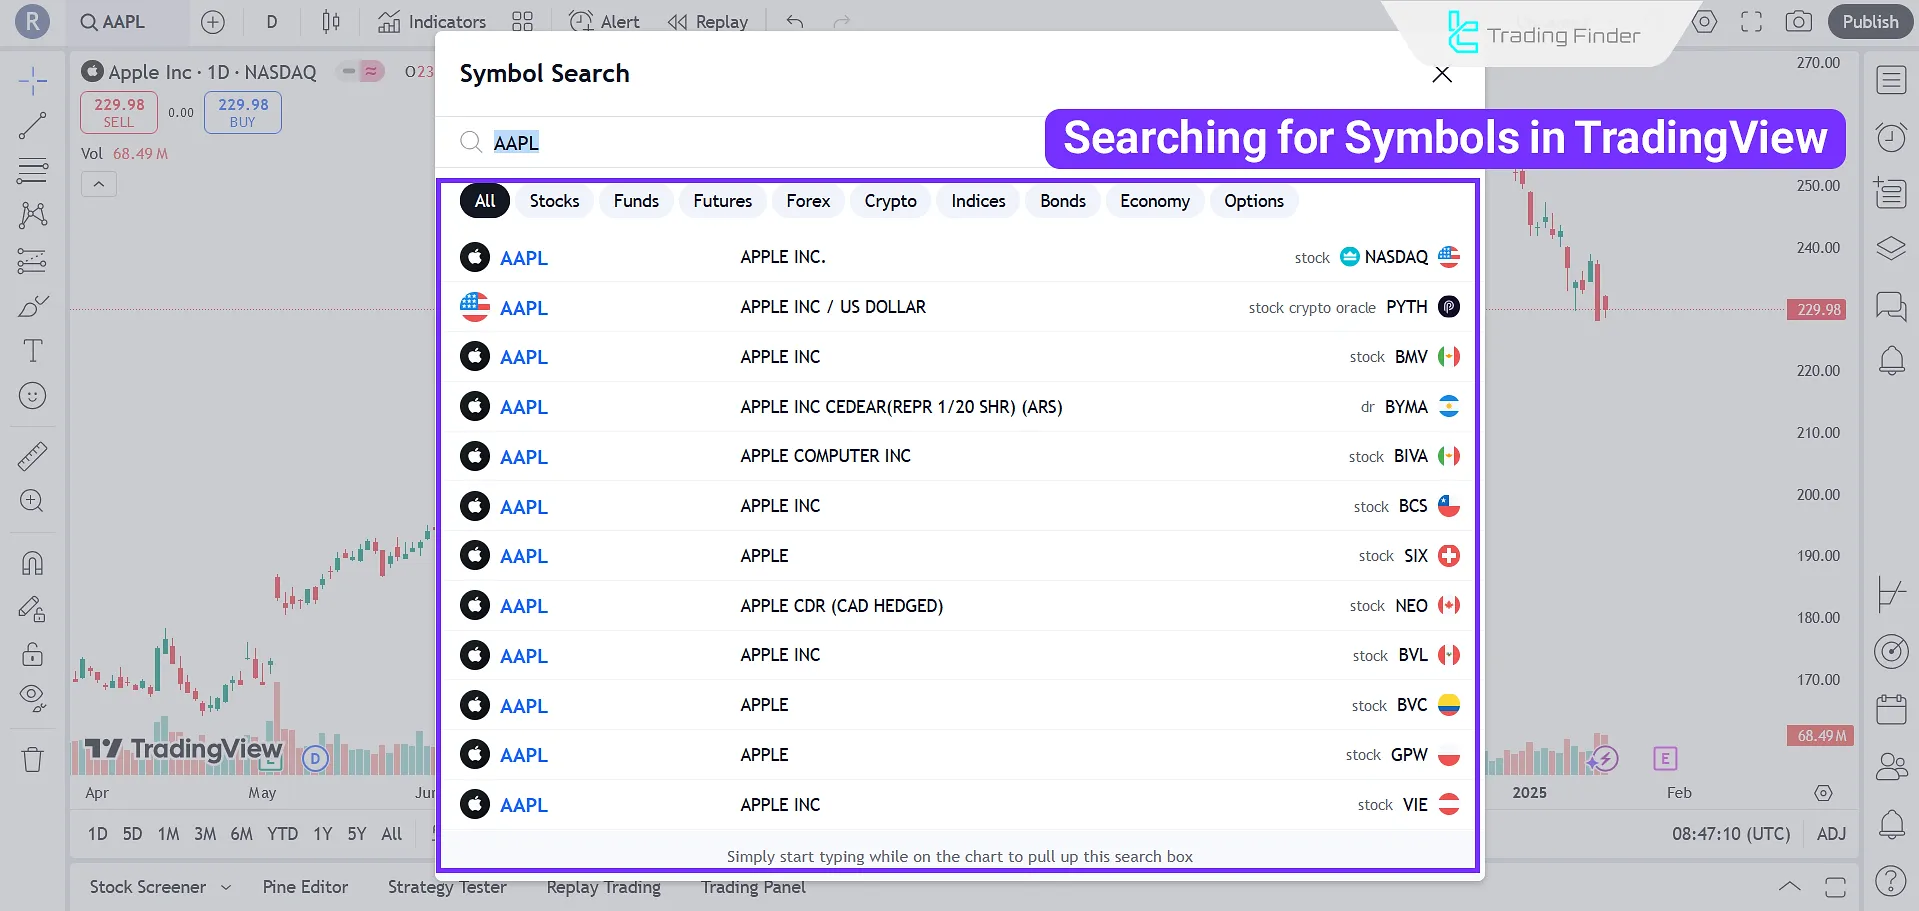
Searching for Trading Symbols
You can search and analyze assets or investments on TradingView. For instance, search for "Ethereum" or "XAU" to see various options for each asset.
This is because TradingView Platform provides price data from multiple Forex brokers and exchanges.
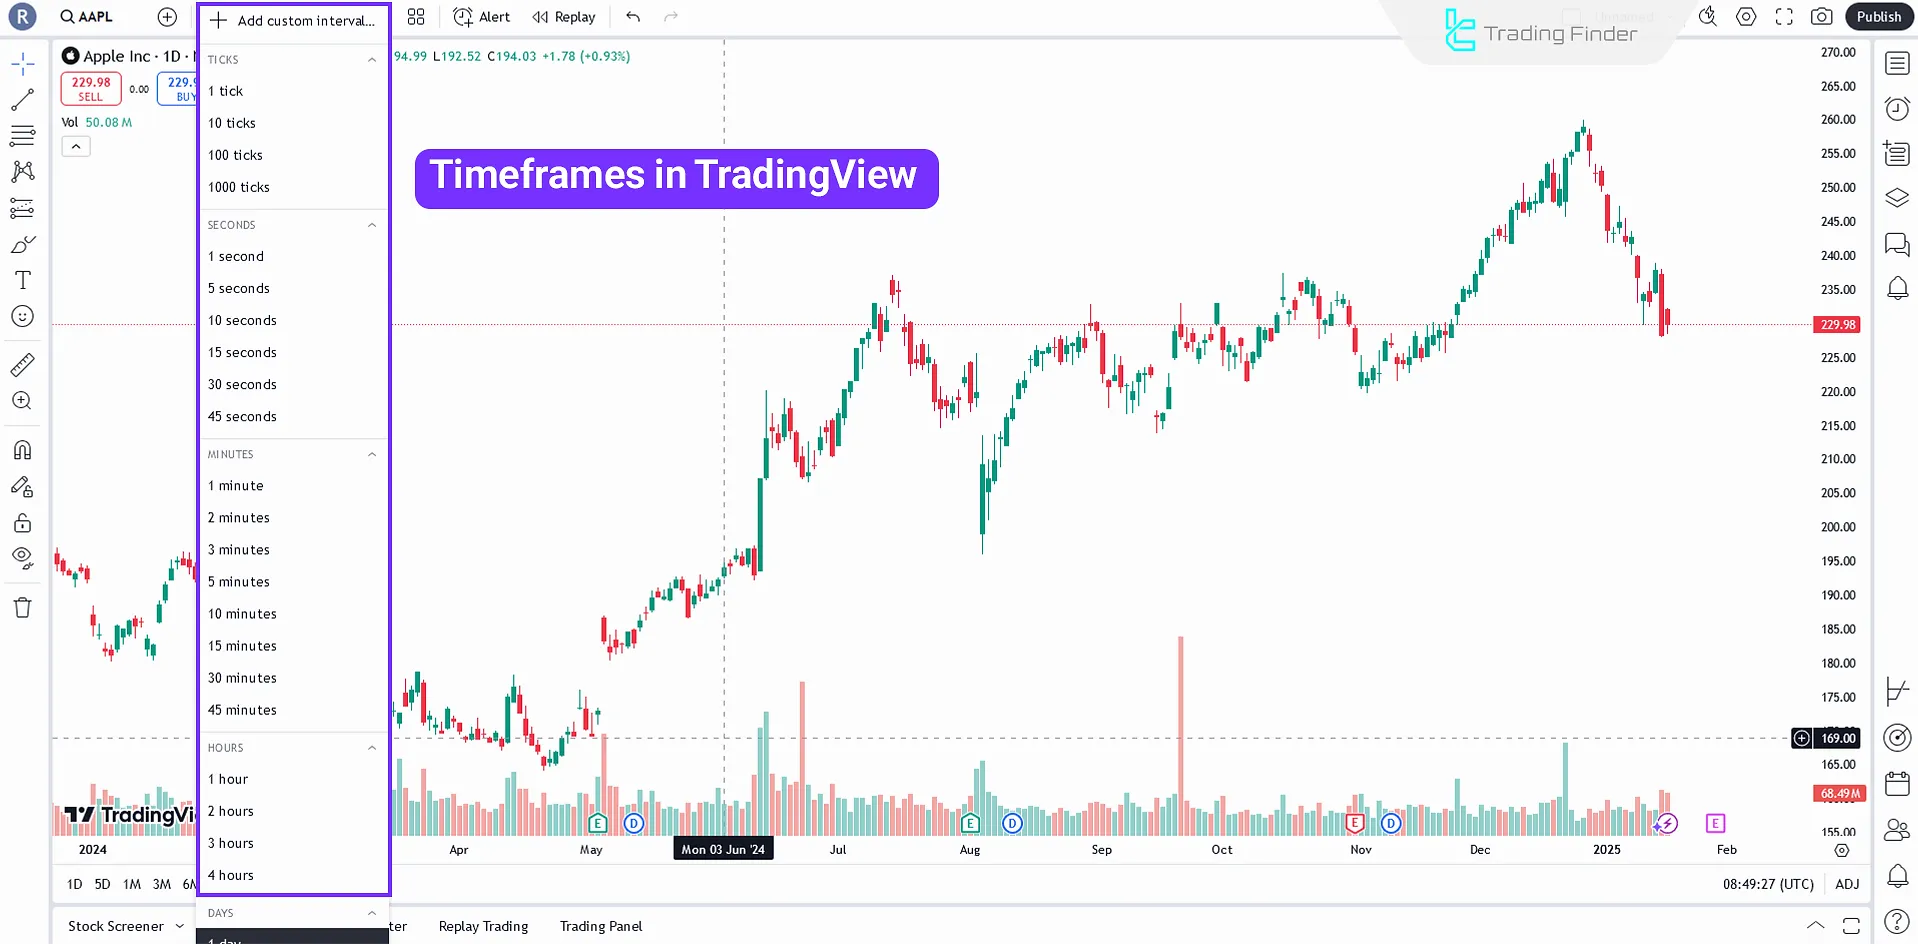
Selecting A Timeframe
The next step is selecting your desired trading timeframe in TradingView, representing the duration demonstrated by each green or red candlestick.
This choice depends on whether you are a short-term trader (hourly or minute timeframes) or a long-term investor (daily, monthly, etc.).
Setting the Chart Style
Choose the chart style that best fits your analysis. TradingView offers chart types such as line, candlestick, Heiken Ashi, and hollow candles.
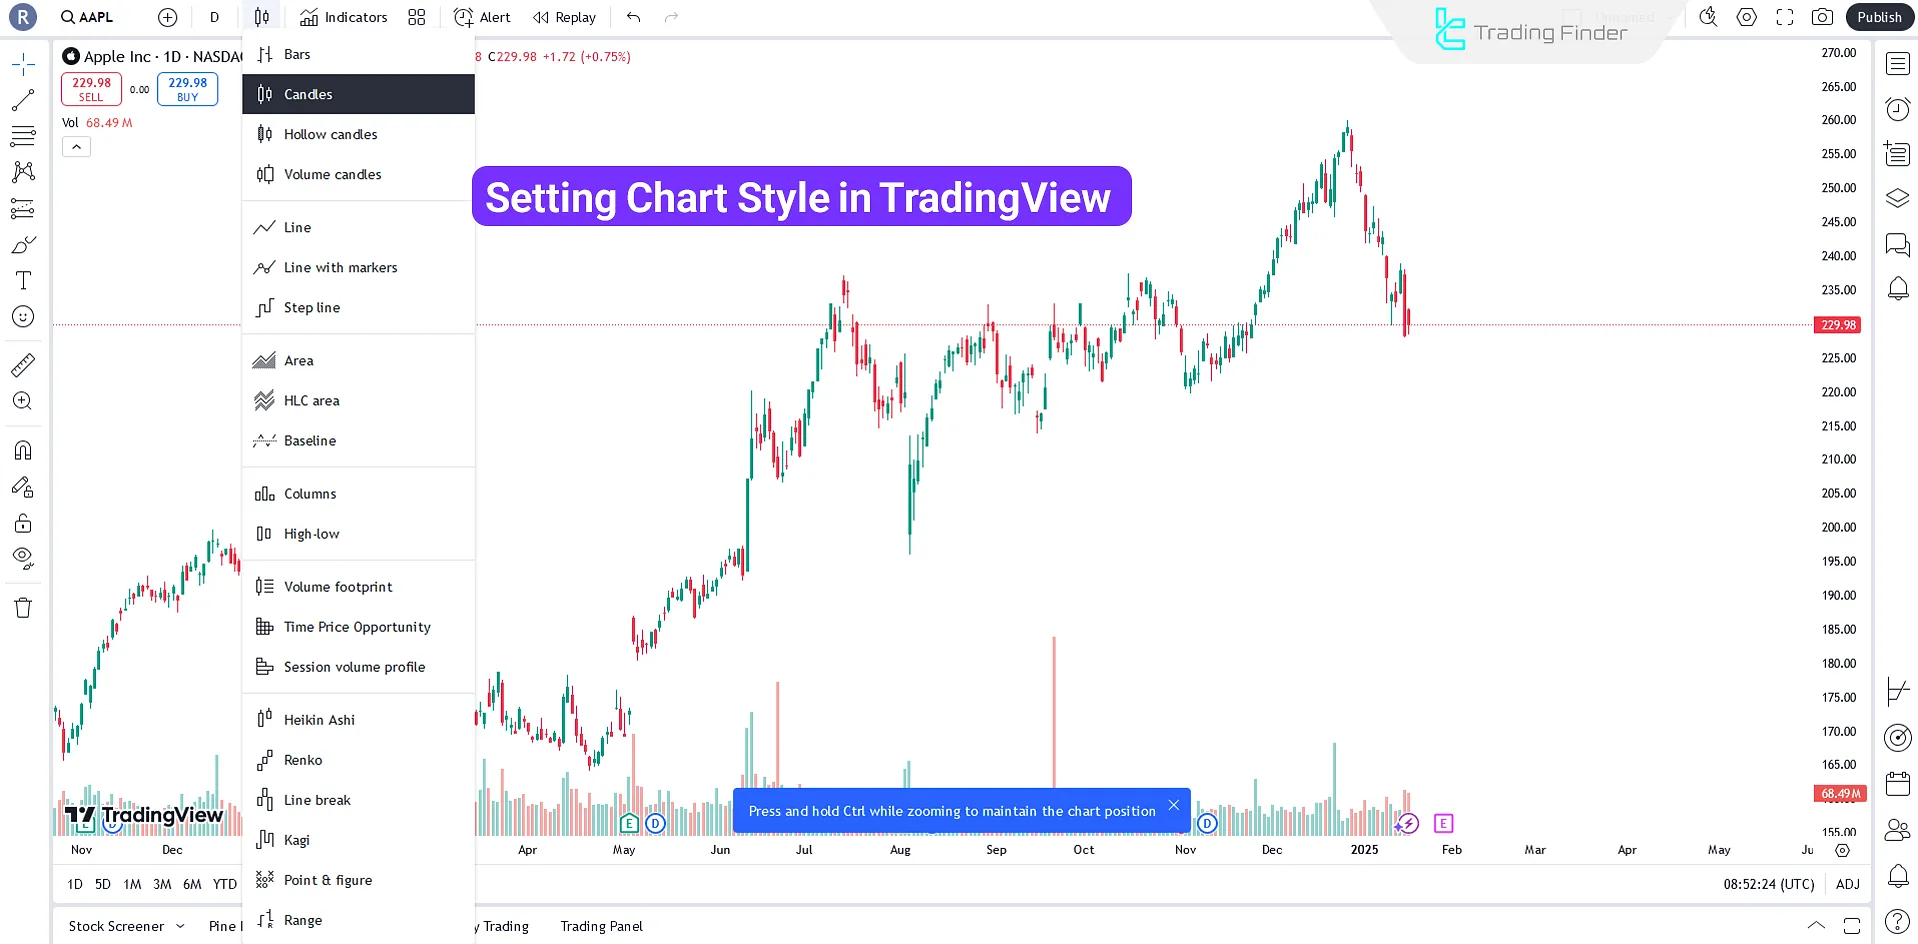
If you don't already have a preferred chart style, it is recommended to use standard candlestick charts. These charts are suitable for most trading and investment strategies.
Technical Tools Offered by TradingView
Technical tools on TradingView include trendlines, Fibonacci retracements, chart patterns, and other indicators (e.g., MACD, RSI, and Moving Averages).
These tools allow you to draw trendlines, channels, and price patterns.
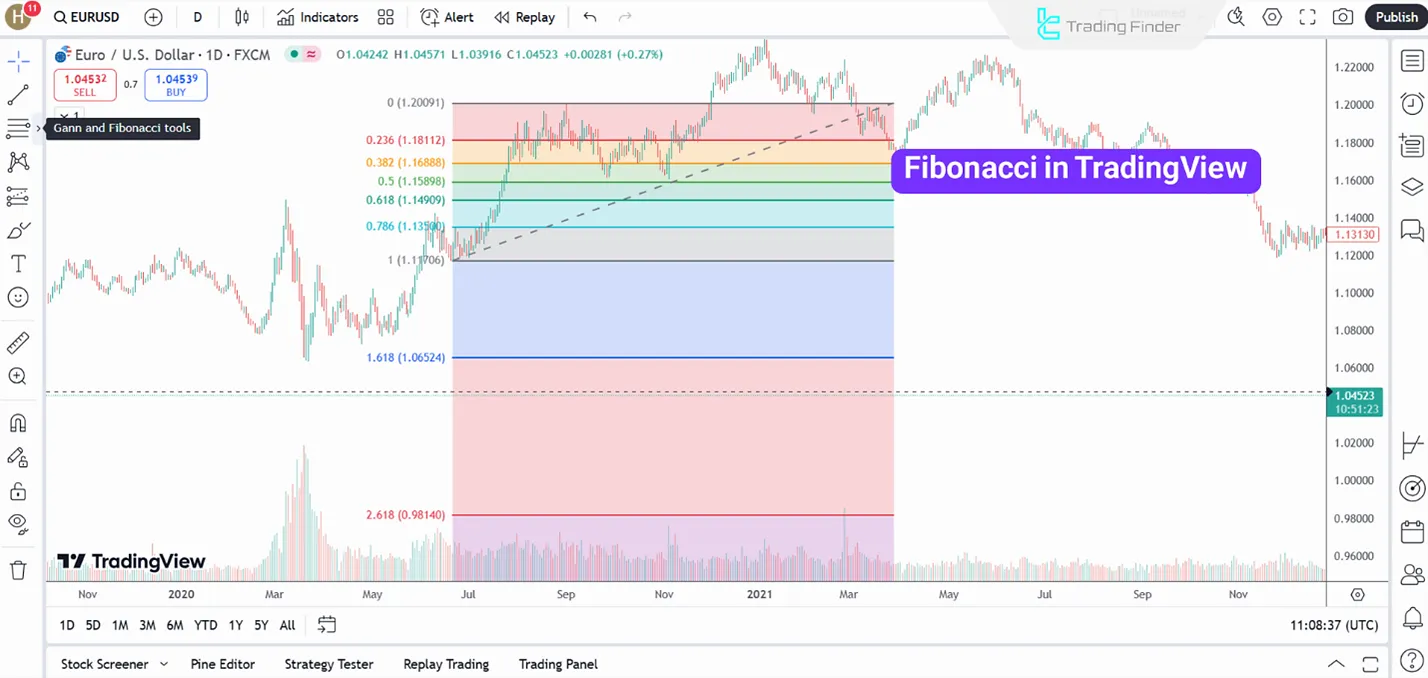
Fibonacci Tools
Fibonacci tools in TradingView help identify support and resistance levels based on the Fibonacci sequence. They are also helpful in finding premium and discount zones.
Drawing Trendlines and Support/Resistance Levels
Trendlines and support/resistance levels are fundamental components of technical analysis.
TradingView's drawing tools make it easy to add these lines and levels to your chart, and the platform offers extensive customization options for each tool.
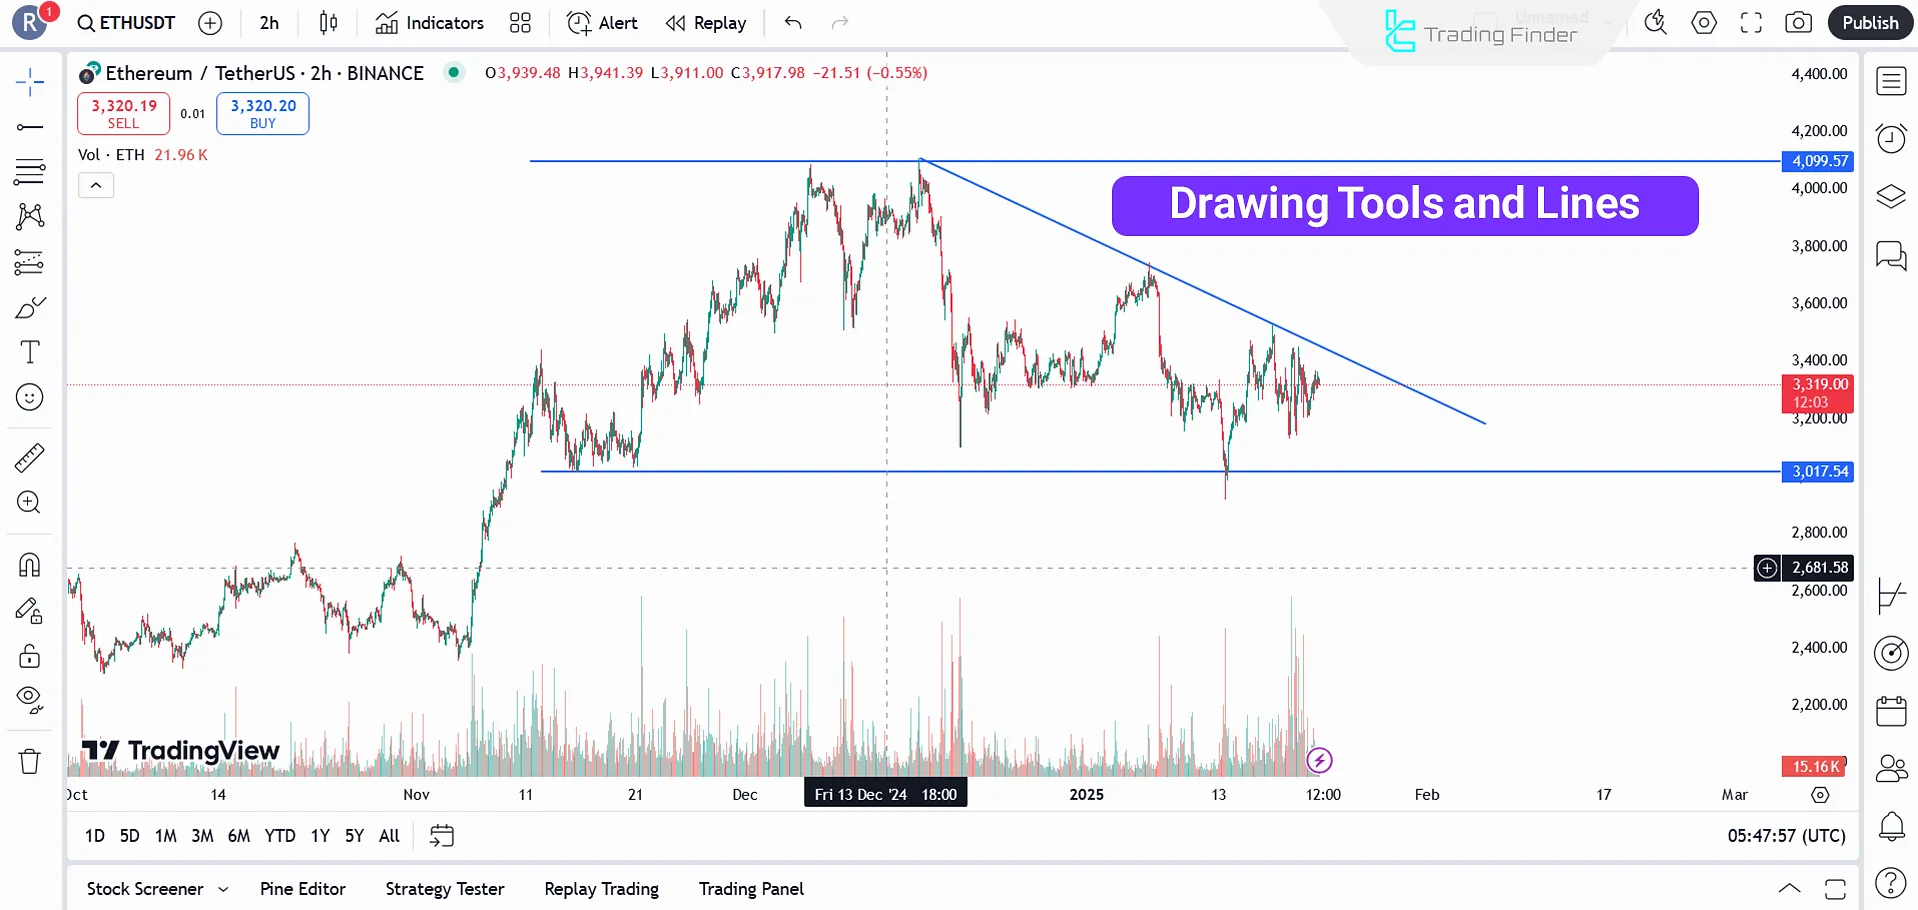
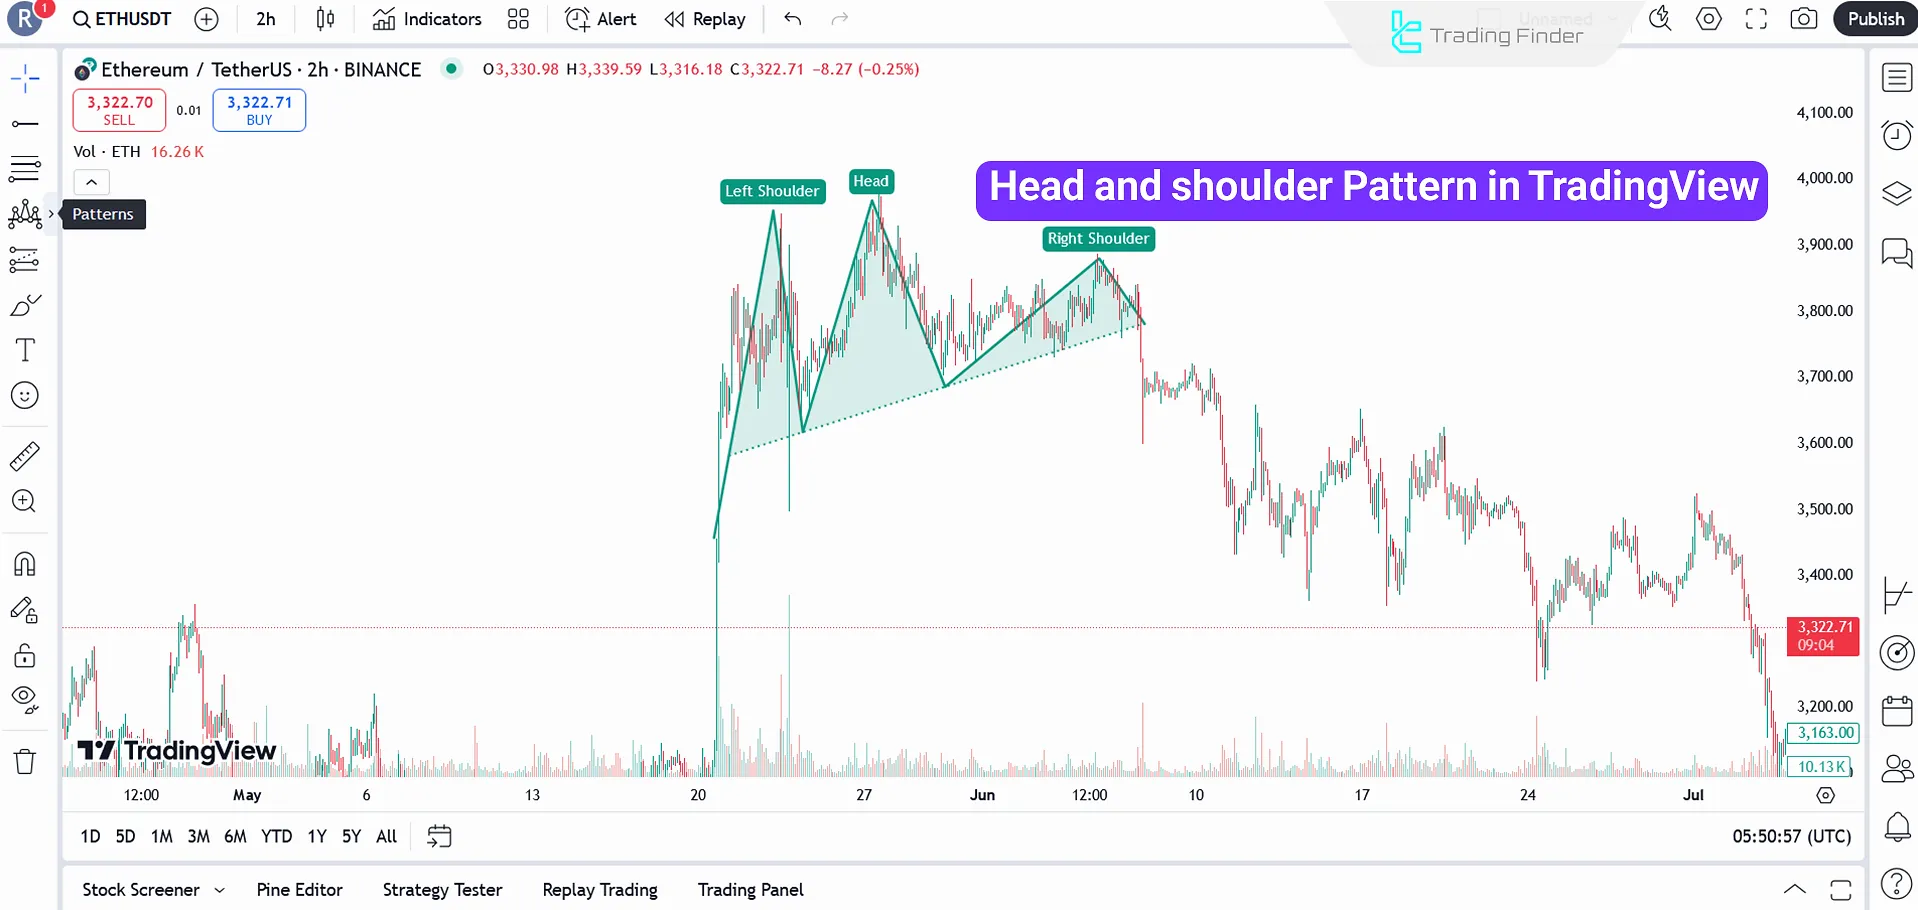
Chart Patterns
The drawing tools are recommended if you want to draw chart patterns such as head and shoulders, triangles, or double tops on your chart.
Additionally, tools for drawing harmonic patterns and Elliott waves are also available.
A Guide on Key Features and Tools of TradingView
In this section, we will go through multiple capabilities of this platform that are helpful to users, including:
- Trading Panel
- Screener
- Coding
- Backtesting
- Social trading community
Let's have an overview on each of the mentioned tools and features.
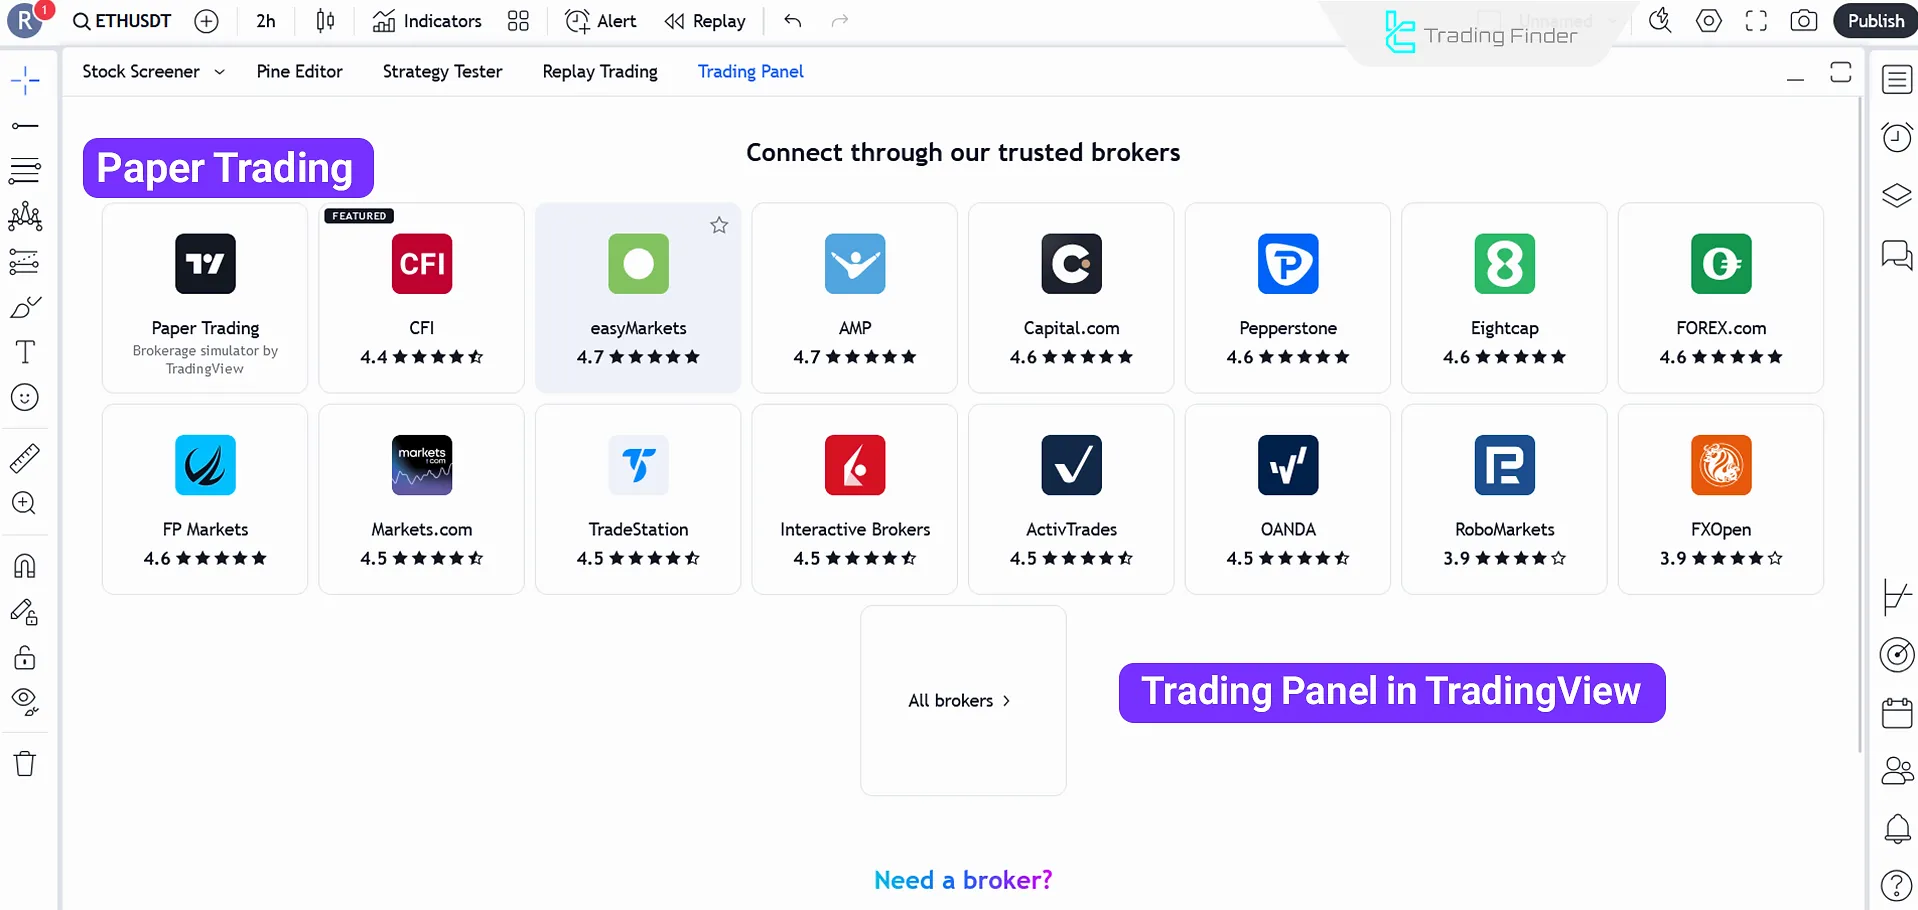
Trading Panel
The trading panel becomes available when you connect your TradingView account to your broker account. With this feature, you can trade directly through the platform.
Additionally, the Paper Trading feature supports simulated trading, which is equivalent to demo trading on MetaTrader 4 and 5.
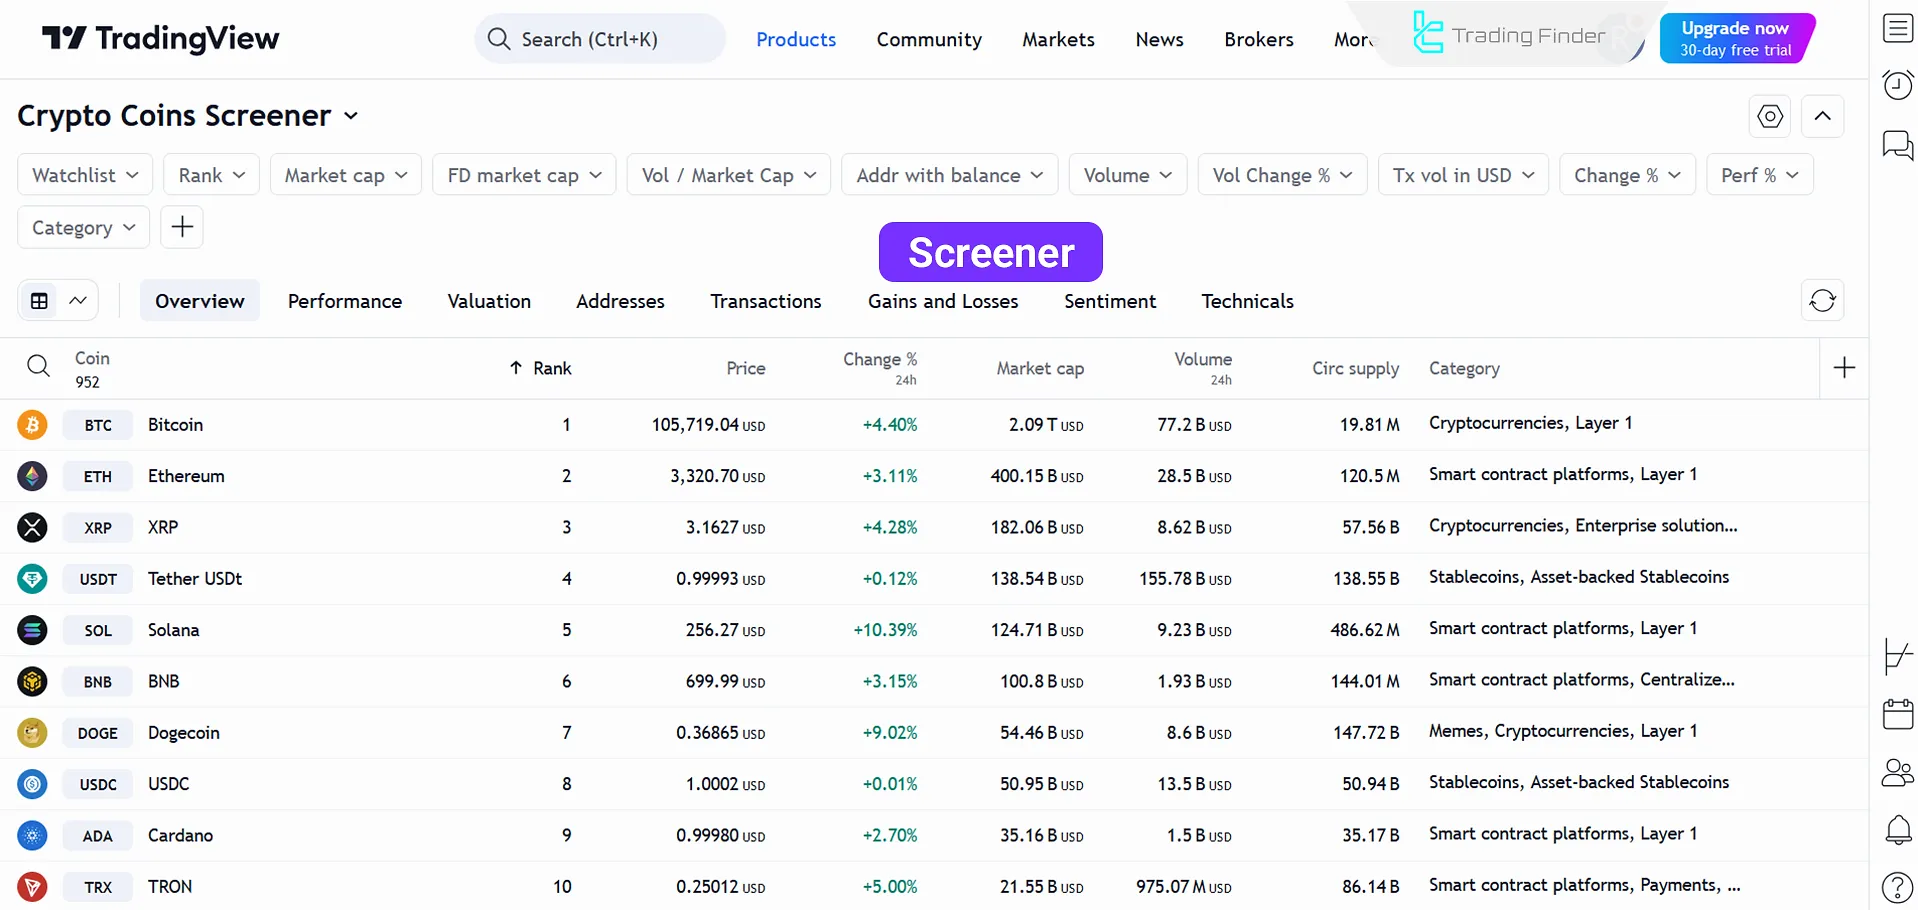
Screener for Filtering Symbols
Using the Screener feature, you can filter a list of assets based on various criteria, such as price, volume, and technical indicators.
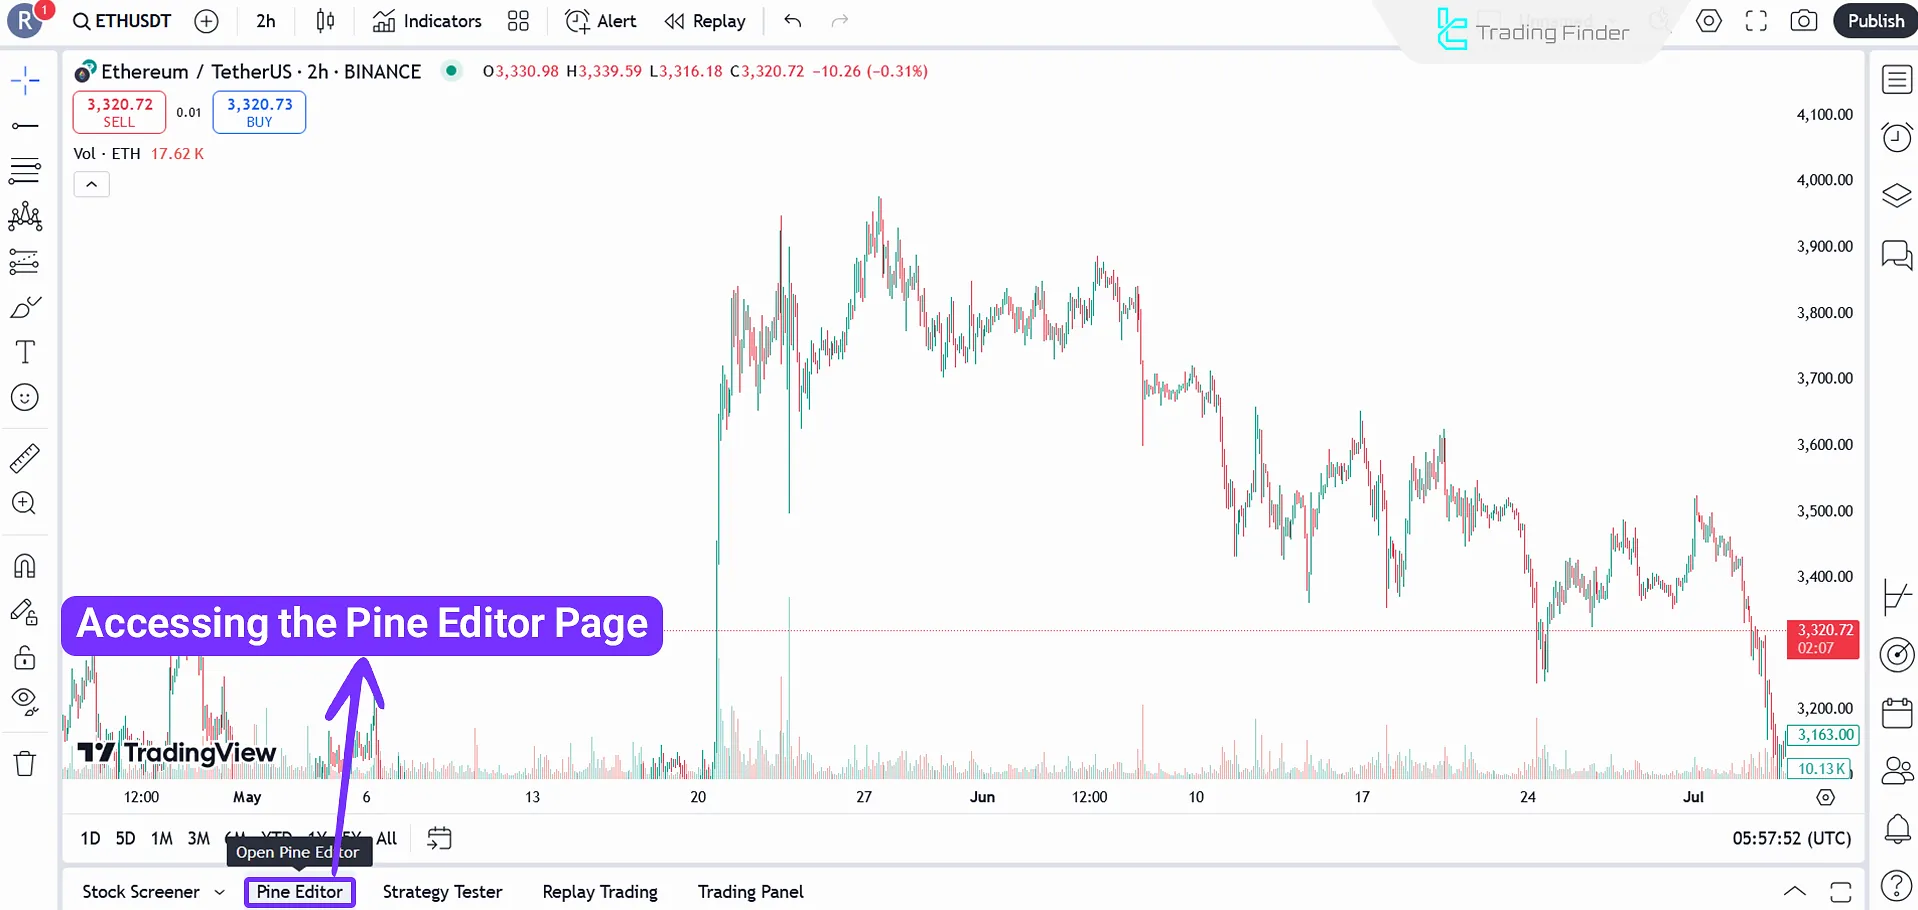
Strategy Coding with Pine Script
The Pine Script language is a simple programming tool that allows users to create indicators and trading strategies.
After writing a script, you can test it using the Backtesting tool to evaluate its performance. Below is the button to access the Pine Editor for scriptwriting.
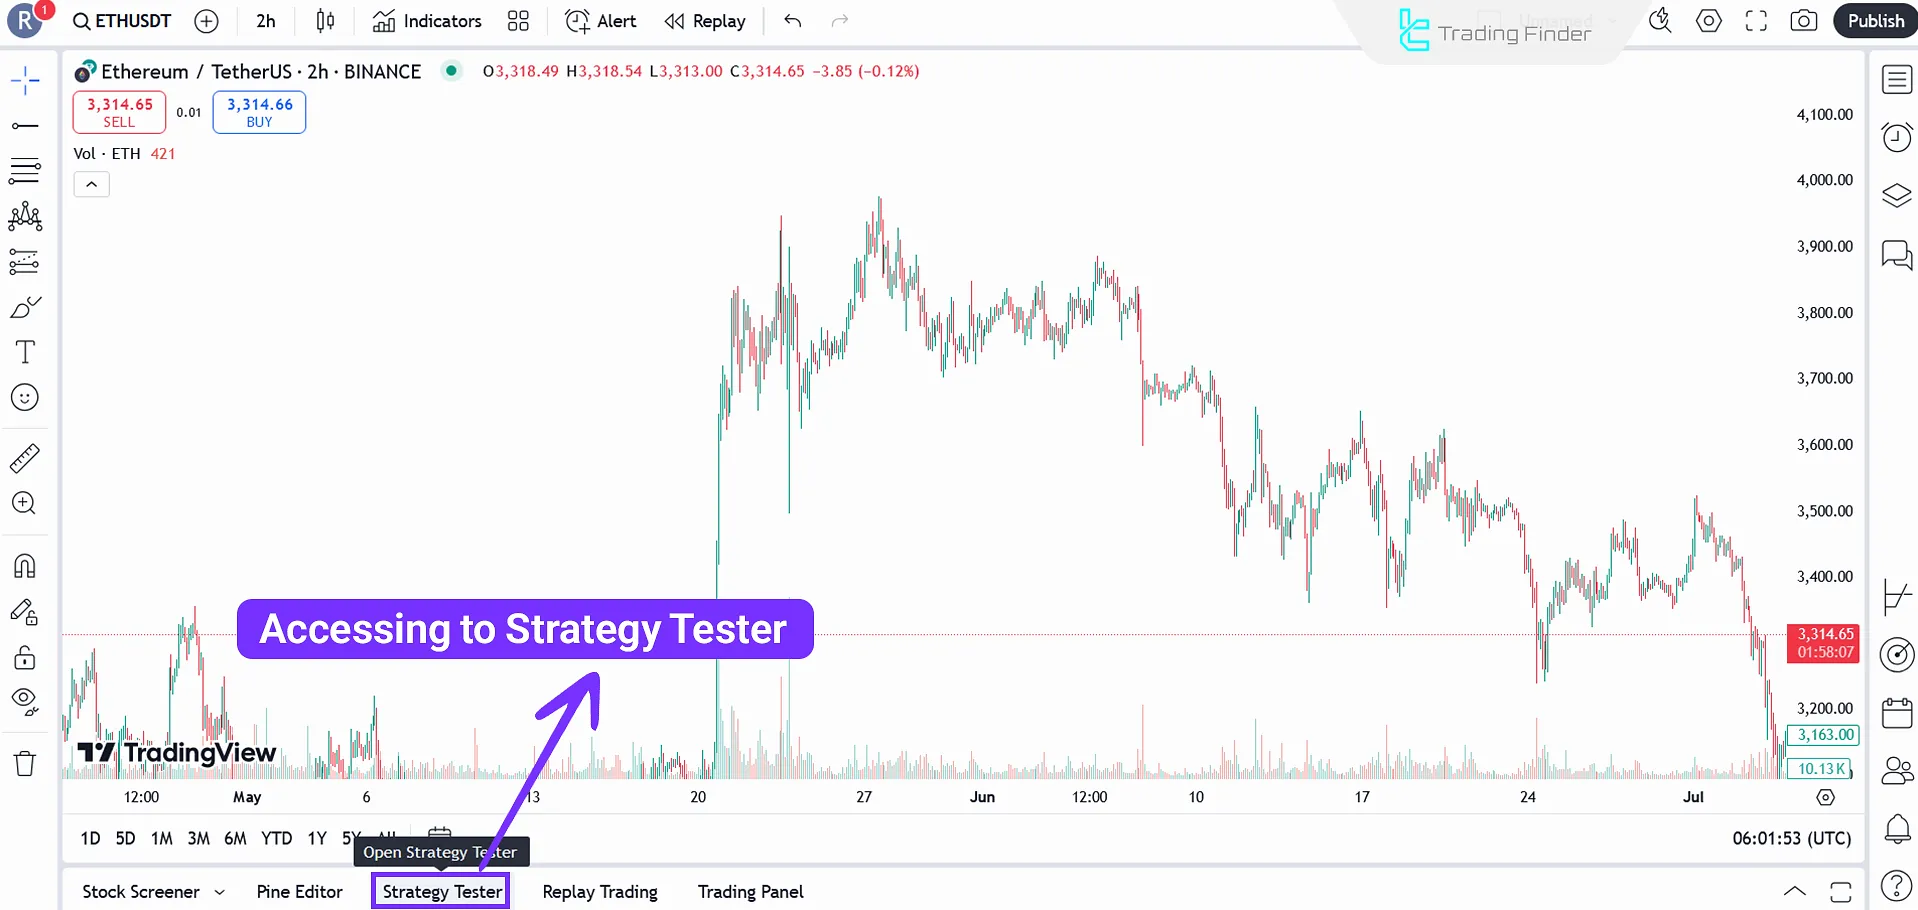
Backtesting Trading Strategies
The Strategy Tester tool on TradingView enables users to backtest their trading strategies based on historical price data.
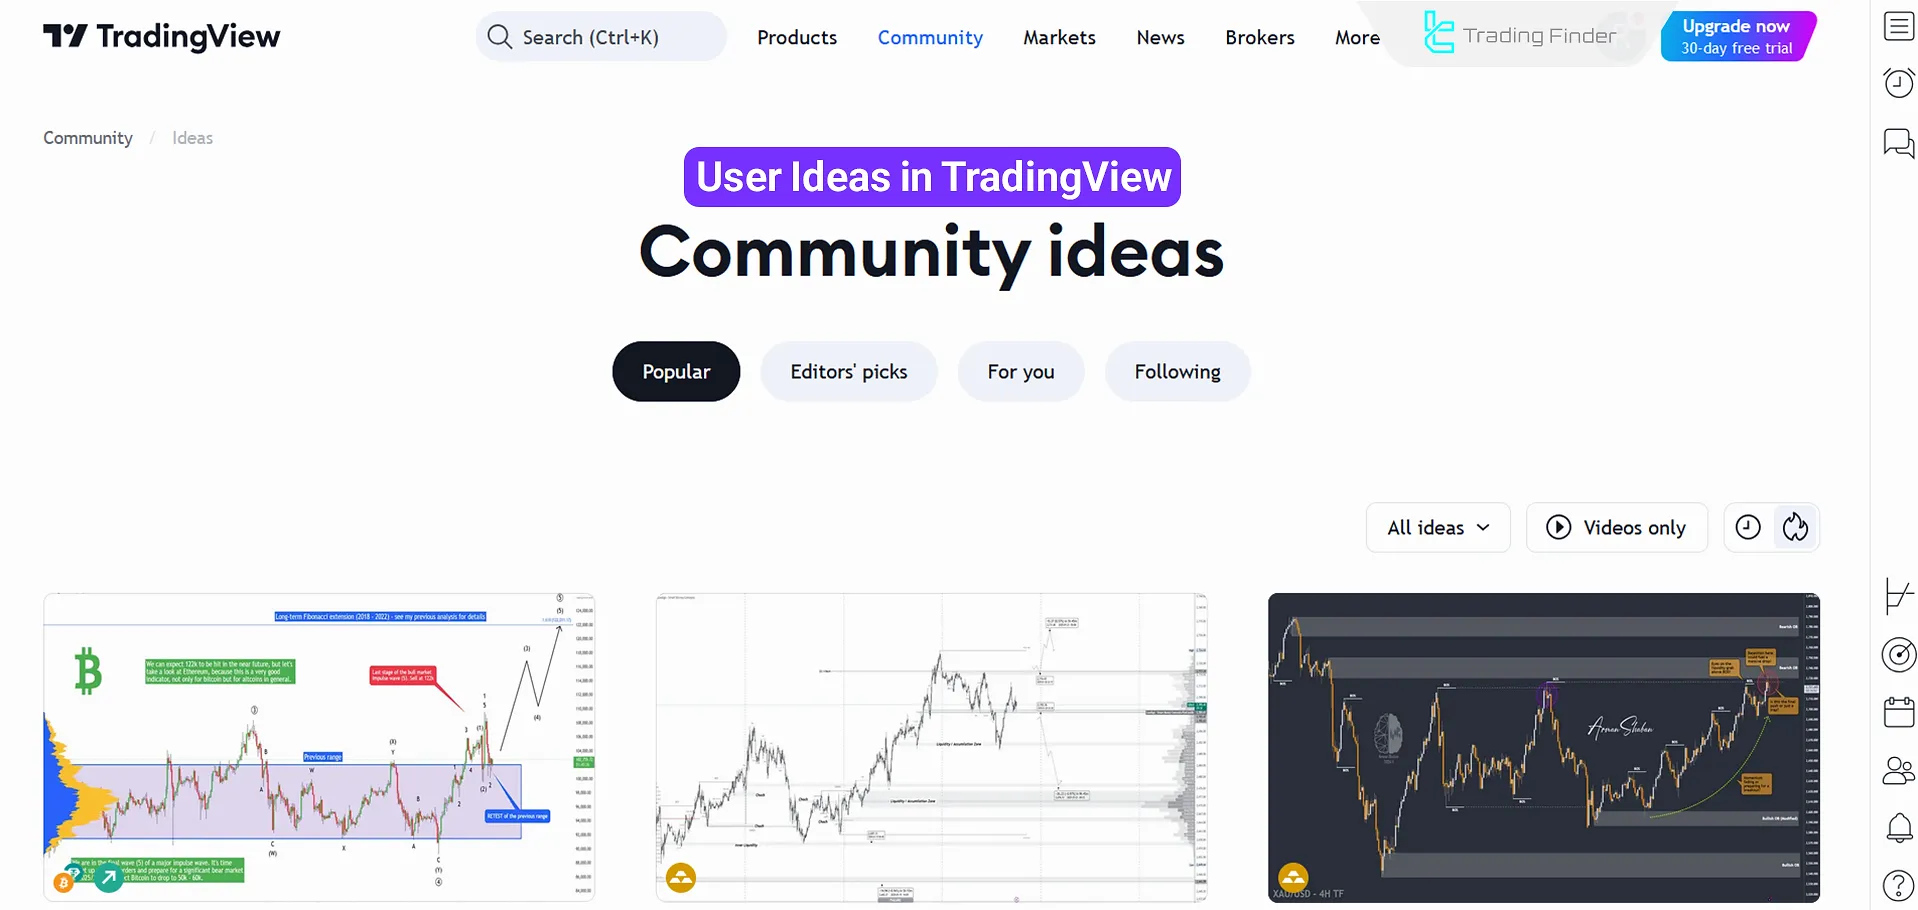
Access to the Trading Community
TradingView is not just an analytical platform; it also features an active community of traders.
In the Trading Ideas section, users can share their analyses and forecasts. You can follow them and draw inspiration from their ideas.
Additional Features of TradingView
Below are some additional noteworthy features of the platform:
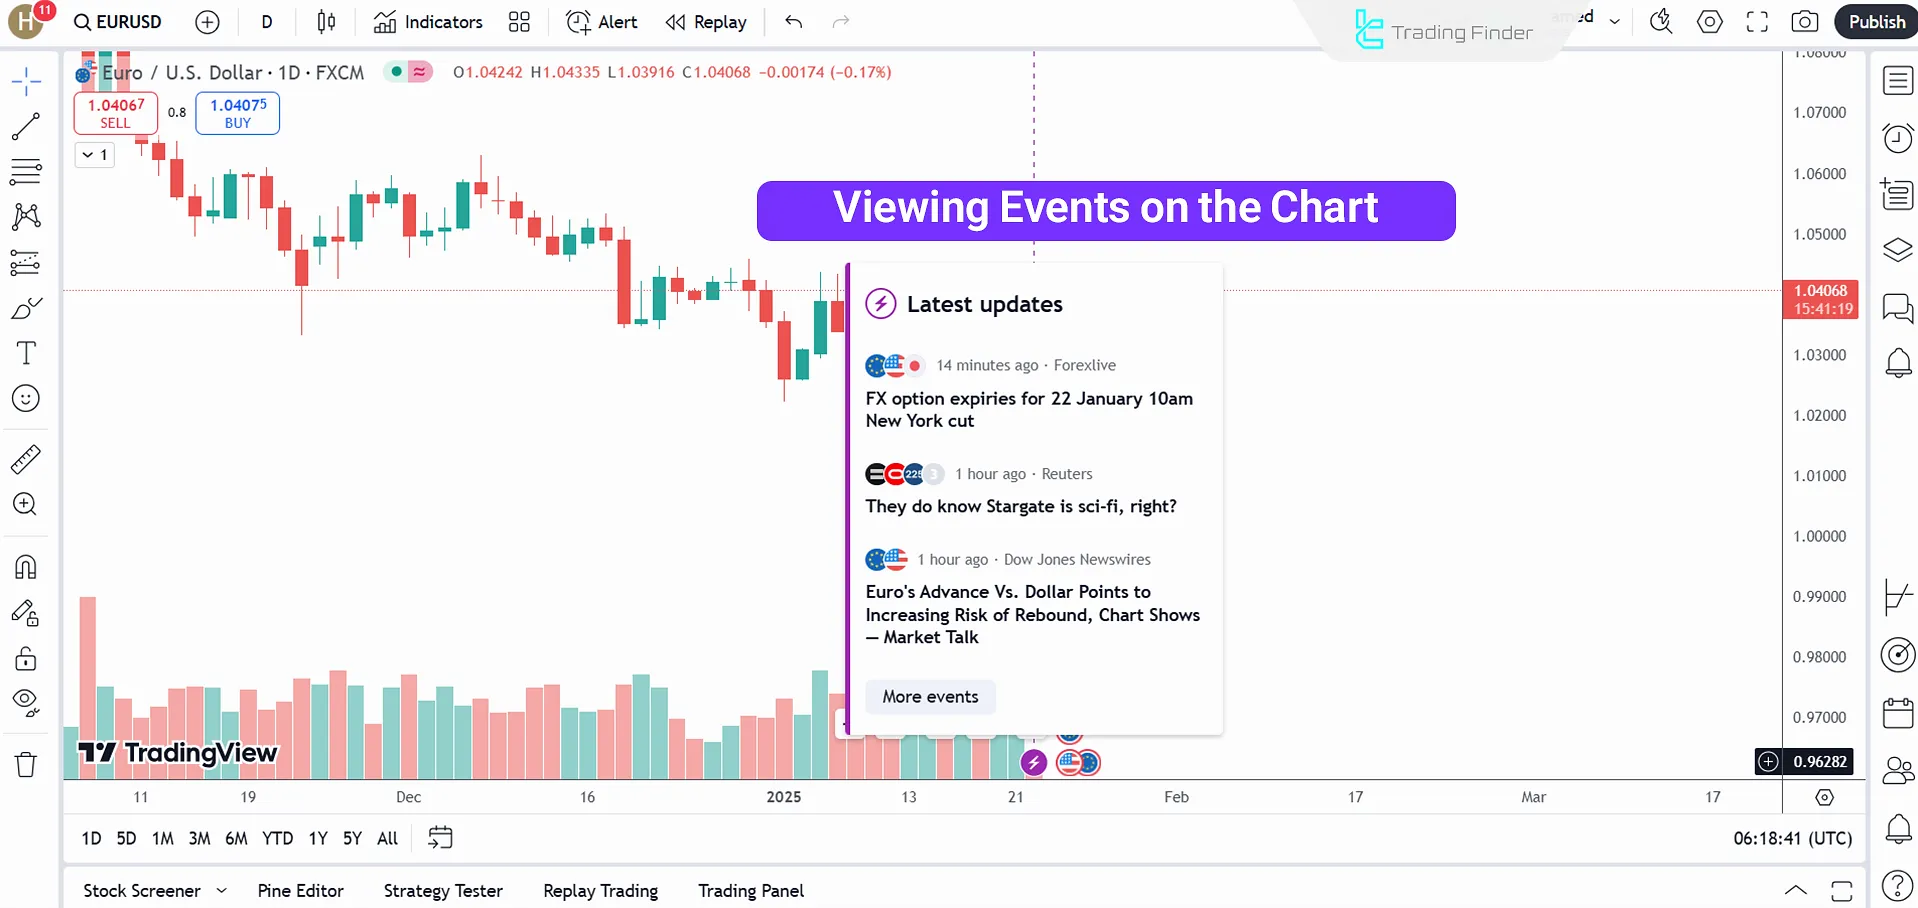
- The Events tool displays financial news and events directly on the chart;
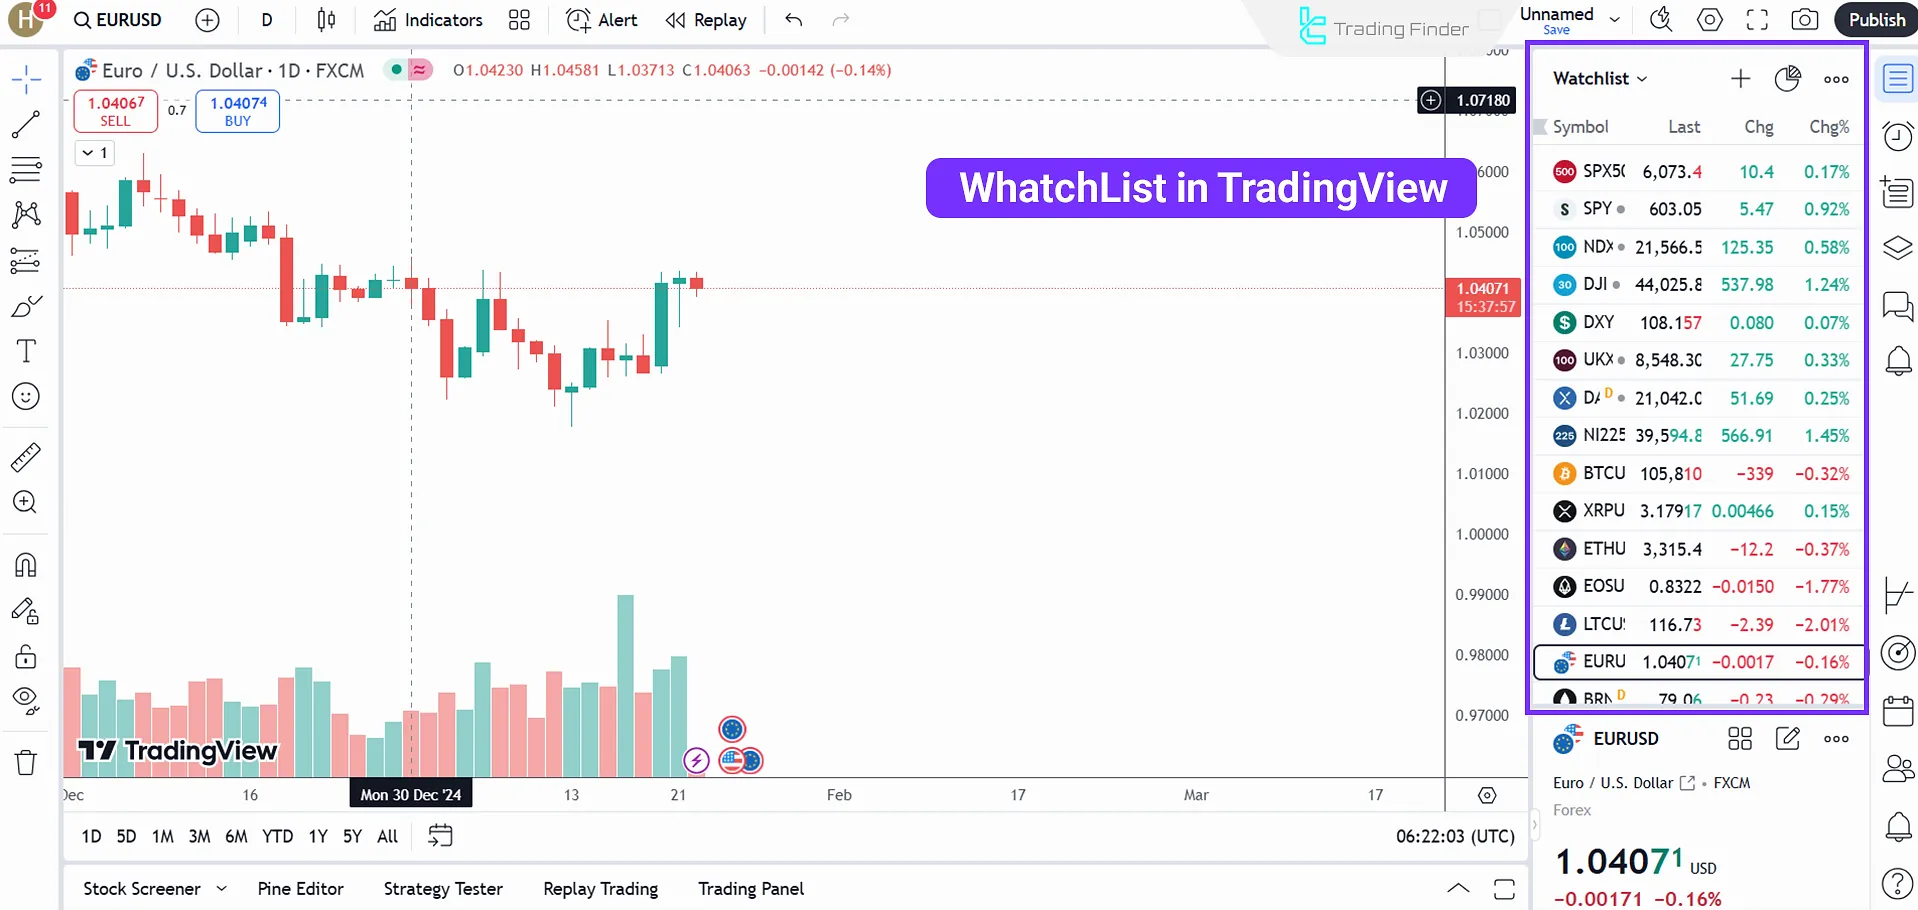
- The Watchlist saves favorite symbols for monitoring price changes;
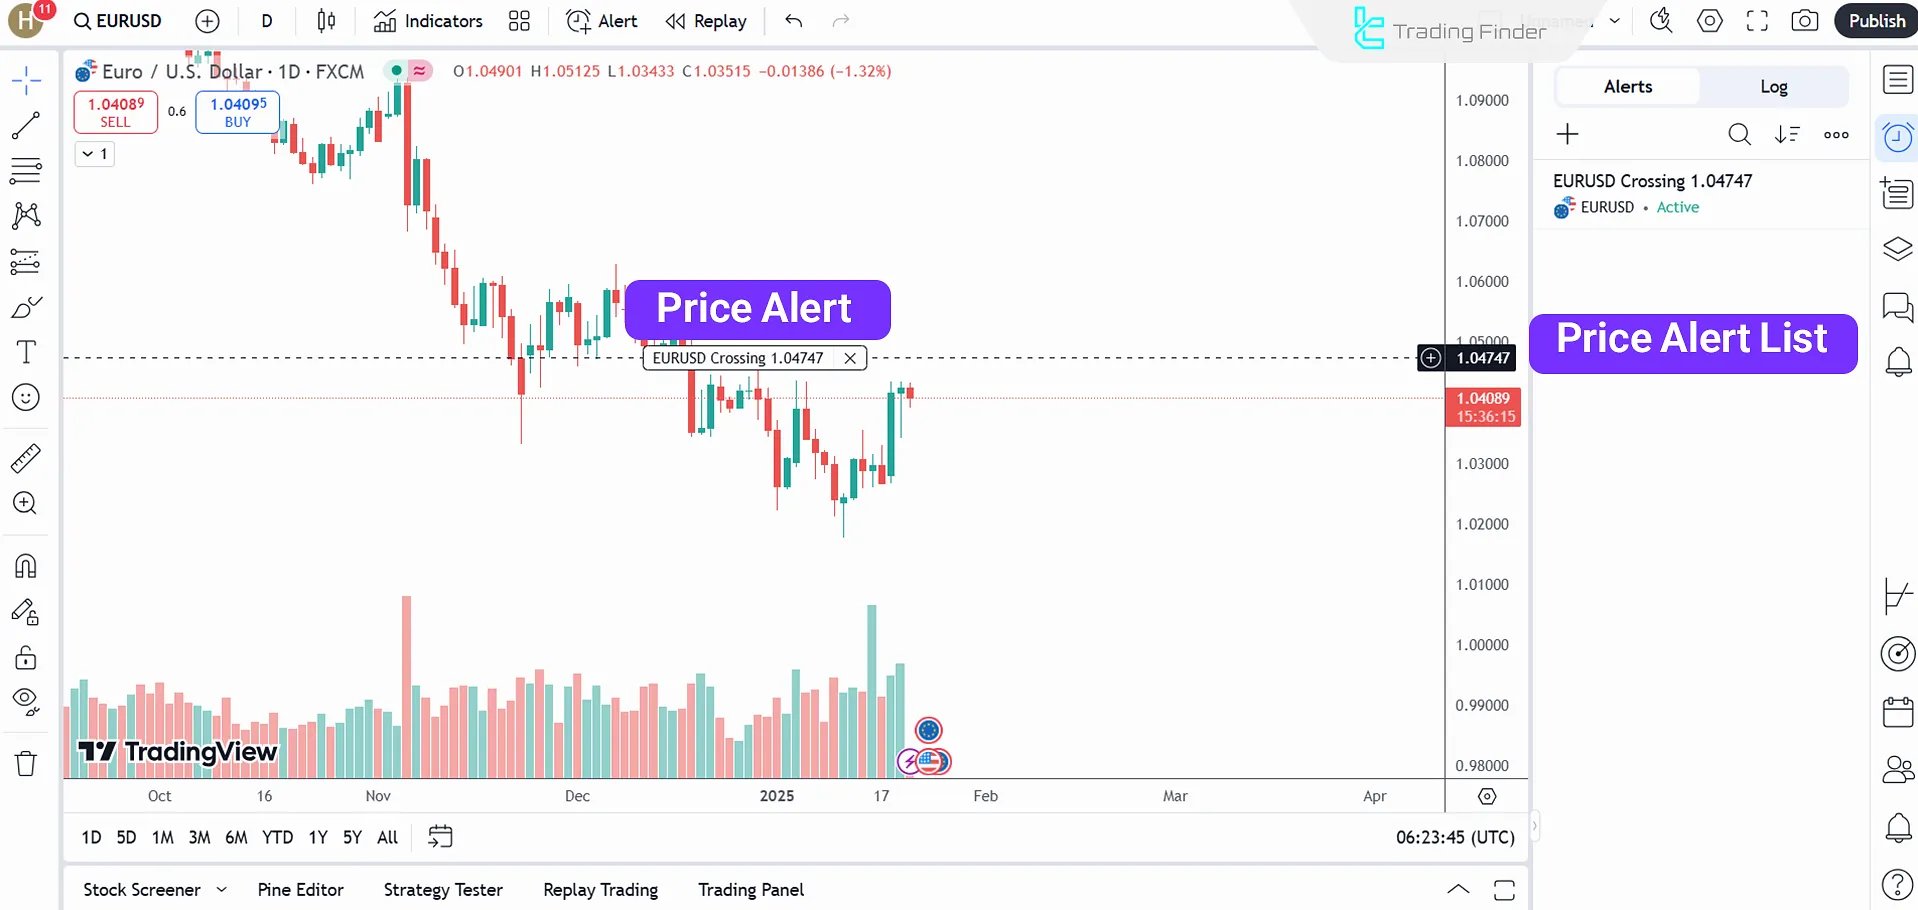
- With Alerts, users can receive notifications for specific conditions, such as price reaching a defined level. Alerts can also combine technical tools and indicators.
Premium Versions of TradingView
While the basic version of TradingView offers a wealth of features for free, upgrading to premium plans unlocks advanced capabilities. The table below compares the different plans based on key differences:
Plan Type | Basic | Essential | Plus | Premium | Expert | Ultimate |
Ads | Yes | No | No | No | No | No |
Charts per Tab | 1 | 2 | 4 | 8 | 10 | 16 |
Historical Data Access (Minute Timeframes) | None | Up to 42 days | Up to 180 days | Unlimited | Unlimited | Unlimited |
Indicators per Chart | 2 | 5 | 10 | 25 | 30 | 50 |
Watchlists | 1 | Unlimited | Unlimited | Unlimited | Unlimited | Unlimited |
Symbols per Watchlist | 30 | 1000 | 1000 | 1000 | 1000 | 1000 |
Active Price Alerts | 5 | 20 | 100 | 400 | 600 | 1000 |
Tips for Optimizing Your Experience with TradingView
To make the most of your experience with TradingView, consider the following tips:
- Customize the interface: Adjust charts and tools to your needs
- Set price alerts: Maximize opportunities with timely alerts
- Learn Pine Script: Create custom strategies and indicators
- Engage with the community: Share and gain insights from other users
Conclusion
This TradingView Tutorial discussed the platform's tools such as Pine Editor, Strategy Tester, and Trading Panel.
Also, a brief overview of the available technical tools [Fibonacci, support/resistance, chart patterns] were provided.
We suggest customizing the website's interface and setting price alerts for having an optimal experience with the platform.


