


Candlesticks or Japanese Candlestick Charts are the foundation of technical analysis in financial markets. These charts visually and intuitively display information such as the open, closed, high, and low prices during a specific time frame.
What makes the Candlestick a unique tool is not just the price data—but its ability to reflect the market’s emotional narrative.
What is a Candlestick, and Why Is It Important?
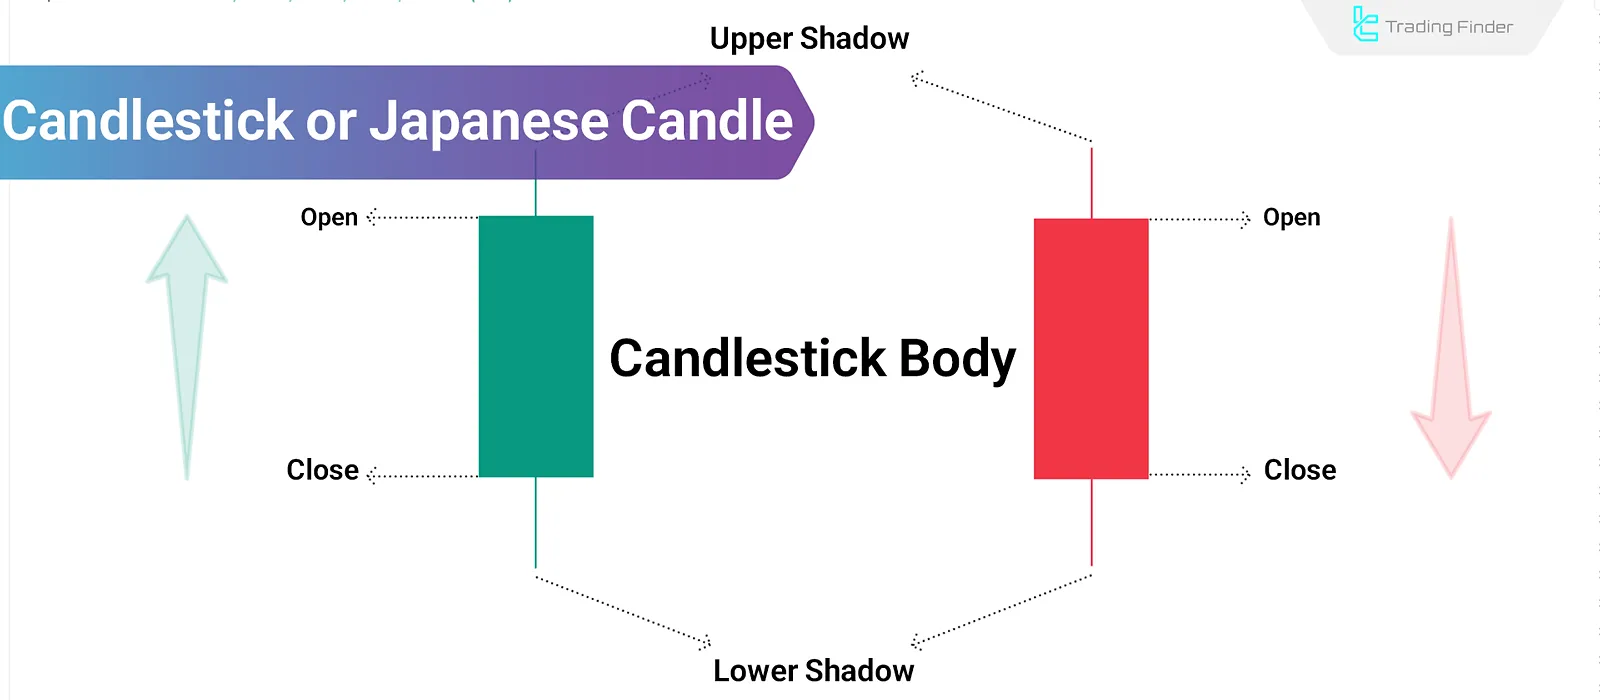
Each Candlestick is a compact summary of the battle between buyers and sellers. The body of the candle indicates the strength or weakness of one side of the market, while the shadows reflect volatility, uncertainty, or failed attempts at movement.
Thanks to their visual simplicity, ability to compress vital price data, and intuitive representation of market sentiment, Candlesticks serve as a visual format for showing price movements in technical analysis. These charts are used across all markets, including Forex, stock markets, cryptocurrencies, and more, on all timeframes.
Pros and Cons of Using Candlestick Patterns in Forex and Crypto
Candlestick patterns reflect the balance—or imbalance—between supply and demand on price charts. Evaluating their strengths and weaknesses can significantly enhance analytical accuracy in the Forex and Cryptocurrency markets.
Advantages | Disadvantages |
Quick identification of trend reversals and continuations | False signals in highly volatile markets |
Usable across various timeframes | Reliance on additional confirmations like volume |
Easy analysis without complex indicators | Lower accuracy on very low timeframes |
Alignment with supply and demand zones | Misinterpretation without sufficient experience |
Reinforces price action strategies | Susceptible to sudden news or events |
Application of Candlestick Price Action Patterns
The application of candlestick patterns and market behavior analysis in price action includes:
- Identifying supply and demand zones: By focusing on raw price movement, these patterns help pinpoint key areas of the market;
- Entry and exit signals with pin bars: The appearance of a pin bar near support or resistance levels may signal early entry or exit;
- Reducing indicator-induced lag: Price action eliminates Reliance on lagging indicators, allowing quicker responses;
- Confirming structural breaks with engulfing patterns: Patterns like engulfing candles in key areas confirm the start of new trends;
- Identifying liquidity zones and stop-loss hunts: Certain candlestick patterns can signal liquidity pools or price traps;
- Enhancing analysis by combining with volume: Studying patterns alongside volume, strengthens the credibility of support and resistance zones;
- Reflecting market psychology: Patterns like doji at tops or bottoms, signal indecision and potential trend reversal;
- Suitable for scalping and swing trading: Single-bar patterns on lower timeframes are great for quick scalping entries; Multi-bar setups offer more accurate swing trading opportunities;
- Boosting effectiveness in volatile markets: Combining these patterns with liquidity zones or volume increases effectiveness in turbulent conditions.
Types of Candlesticks
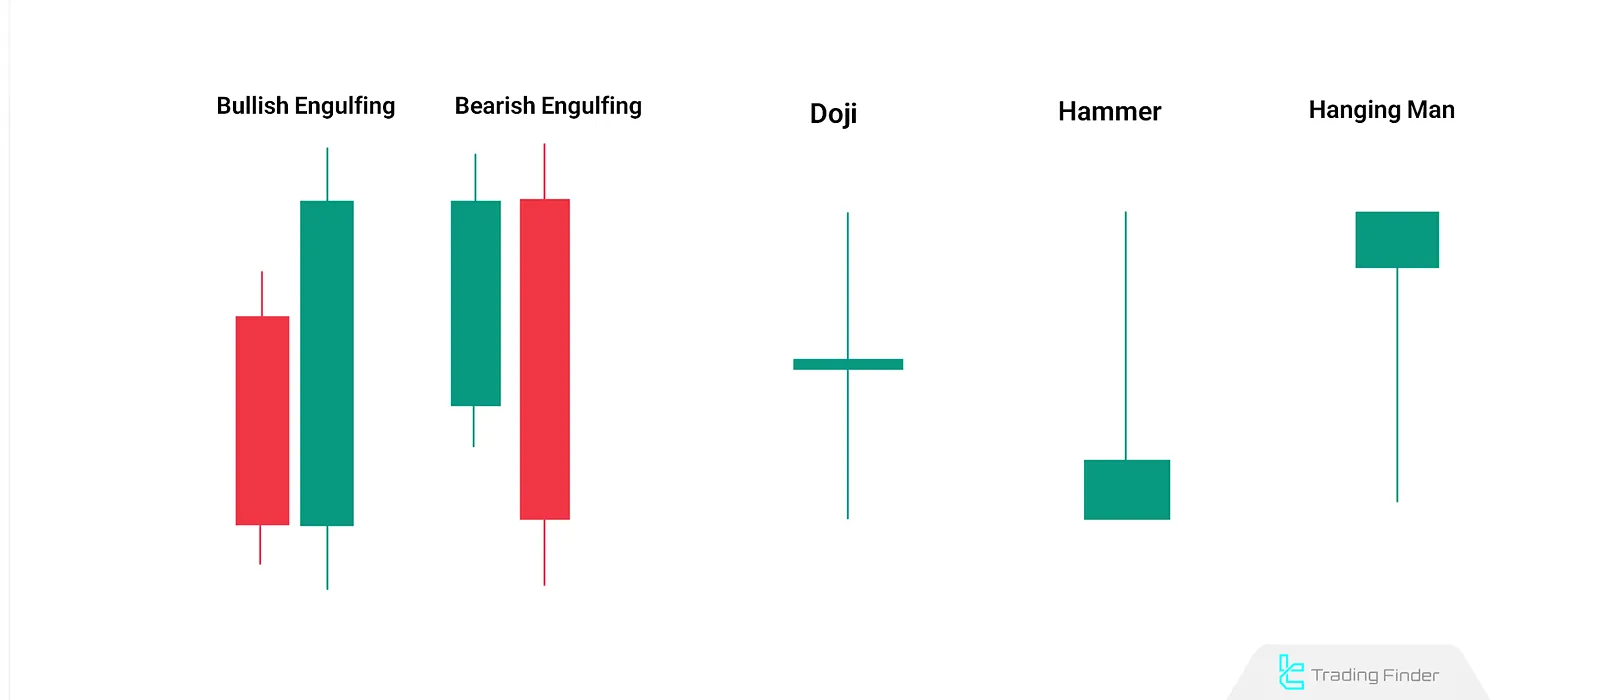
When candlesticks are viewed together, they form patterns that may signal a potential trend reversal or continuation. Well-known examples include bullish and bearish engulfing patterns. Types of Candlesticks:
- Doji
- Hammer
- Hanging Man
- Morning Star & Evening Star
Note: For more examples and insights, read the article on Types of Candlestick Patterns.
How to Read a Japanese Candlestick in Financial Markets?
Candlestick Charts can be used in any timeframe—from one minute or less to daily and beyond. The structure of a Candlestick in Technical Analysis includes four key price levels:
- Open Price
- Close Price
- High Price
- Low Price
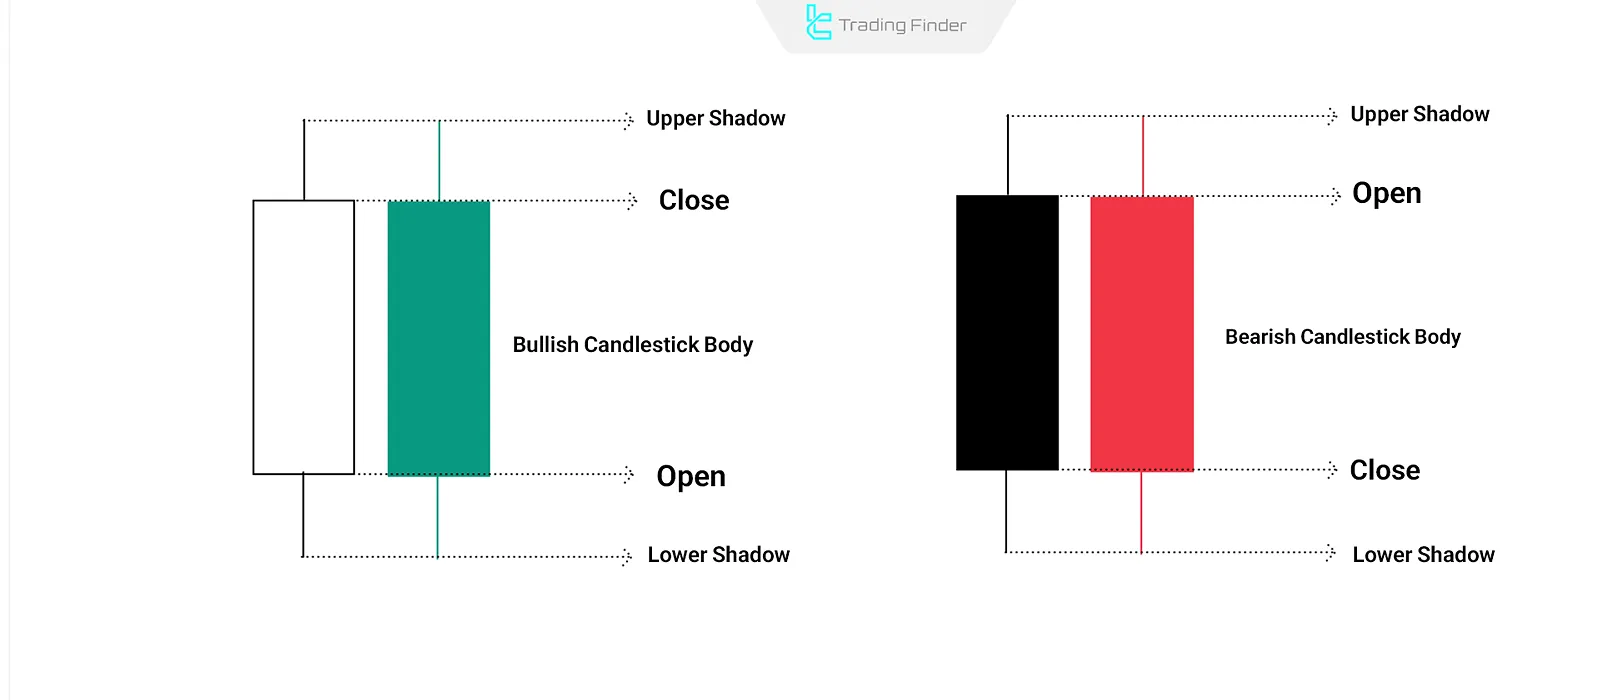
If the close is higher than the open, the candle appears hollow (typically white) or green, indicating buying pressure. If the close is lower than the open, the candle appears filled (generally black or red), signaling selling dominance.
The central part between opening and closing is called the real body, and the thin lines above and below it are shadows, showing the high and low prices within that period.
Conclusion
Candlesticks are not just visual representations of price—they are analytical tools for understanding market behavior. By offering key price levels, such as open, close, high, and low, they enable traders to assess the direction and momentum of the market.
When combined, candlesticks create patterns that can clearly signal entry and exit points. The true value of a Candlestick in technical analysis becomes apparent when used with price action and other supporting tools.


