


The Elliott Wave Theory in technical analysis is used to describe price movements in financial markets.
This concept was developed by Ralph Nelson Elliott after identifying repetitive fractal wave patterns and was divided into two parts: impulse waves and corrective waves.
Inspired by the Dow Theory, Elliott's theory was able to simulate repetitive market patterns and provide accurate predictions.
In this method, market movements are defined as sequential and fractal waves that can be identified in prices and consumer behavior.
What Are Elliott Waves?
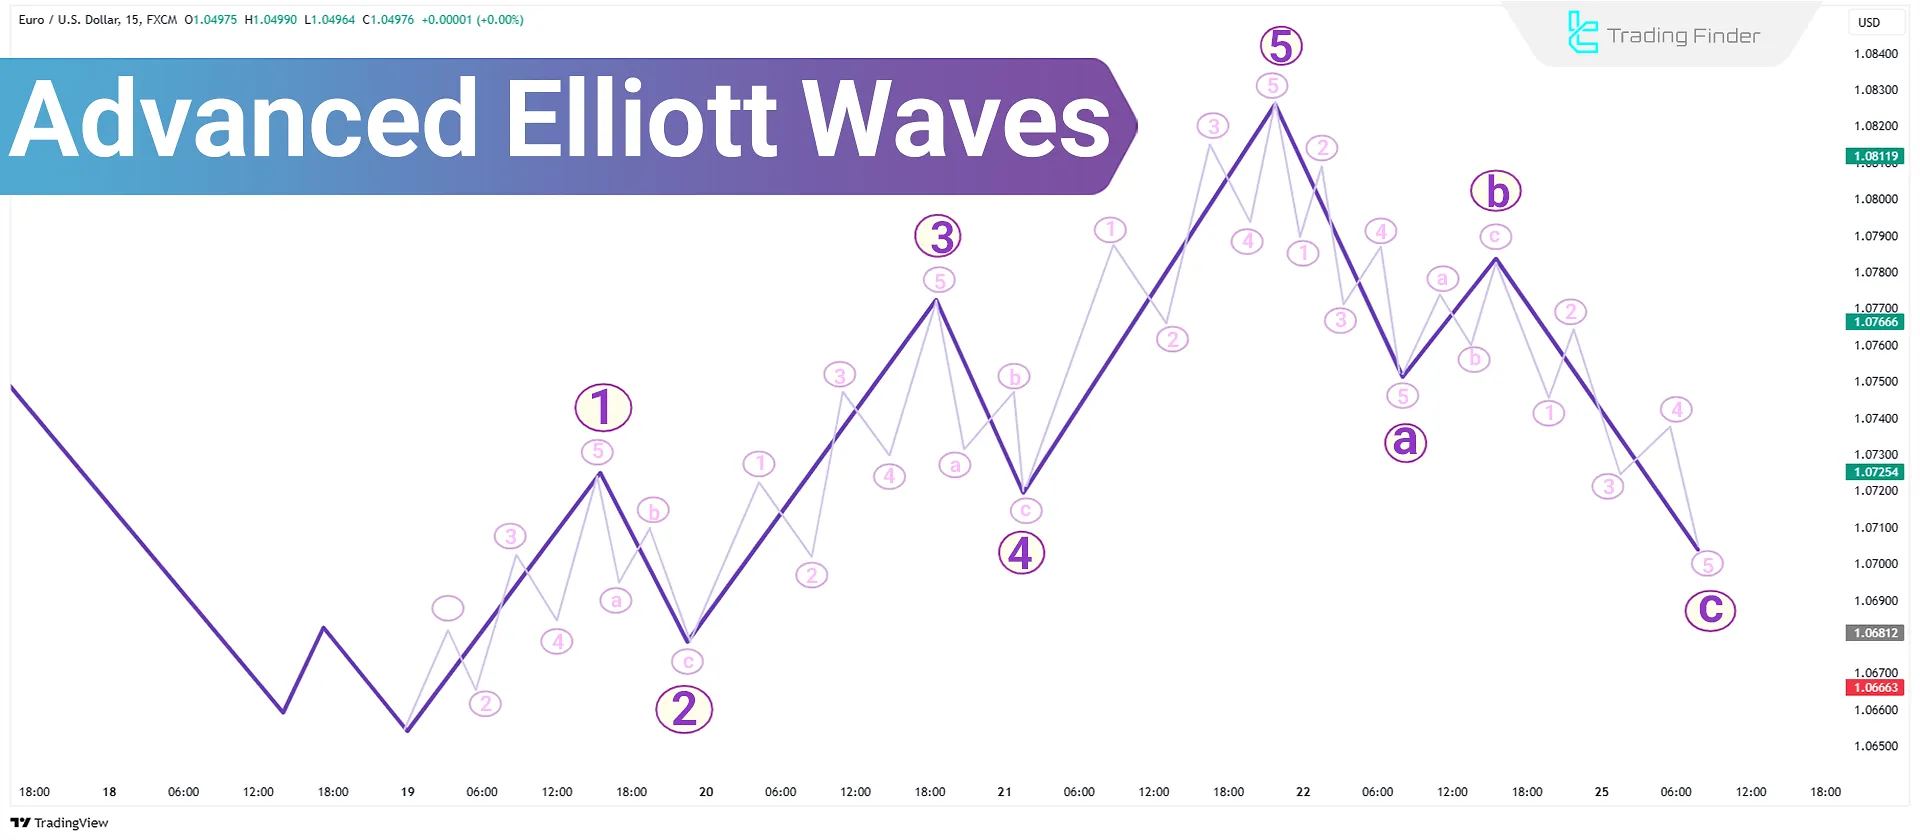
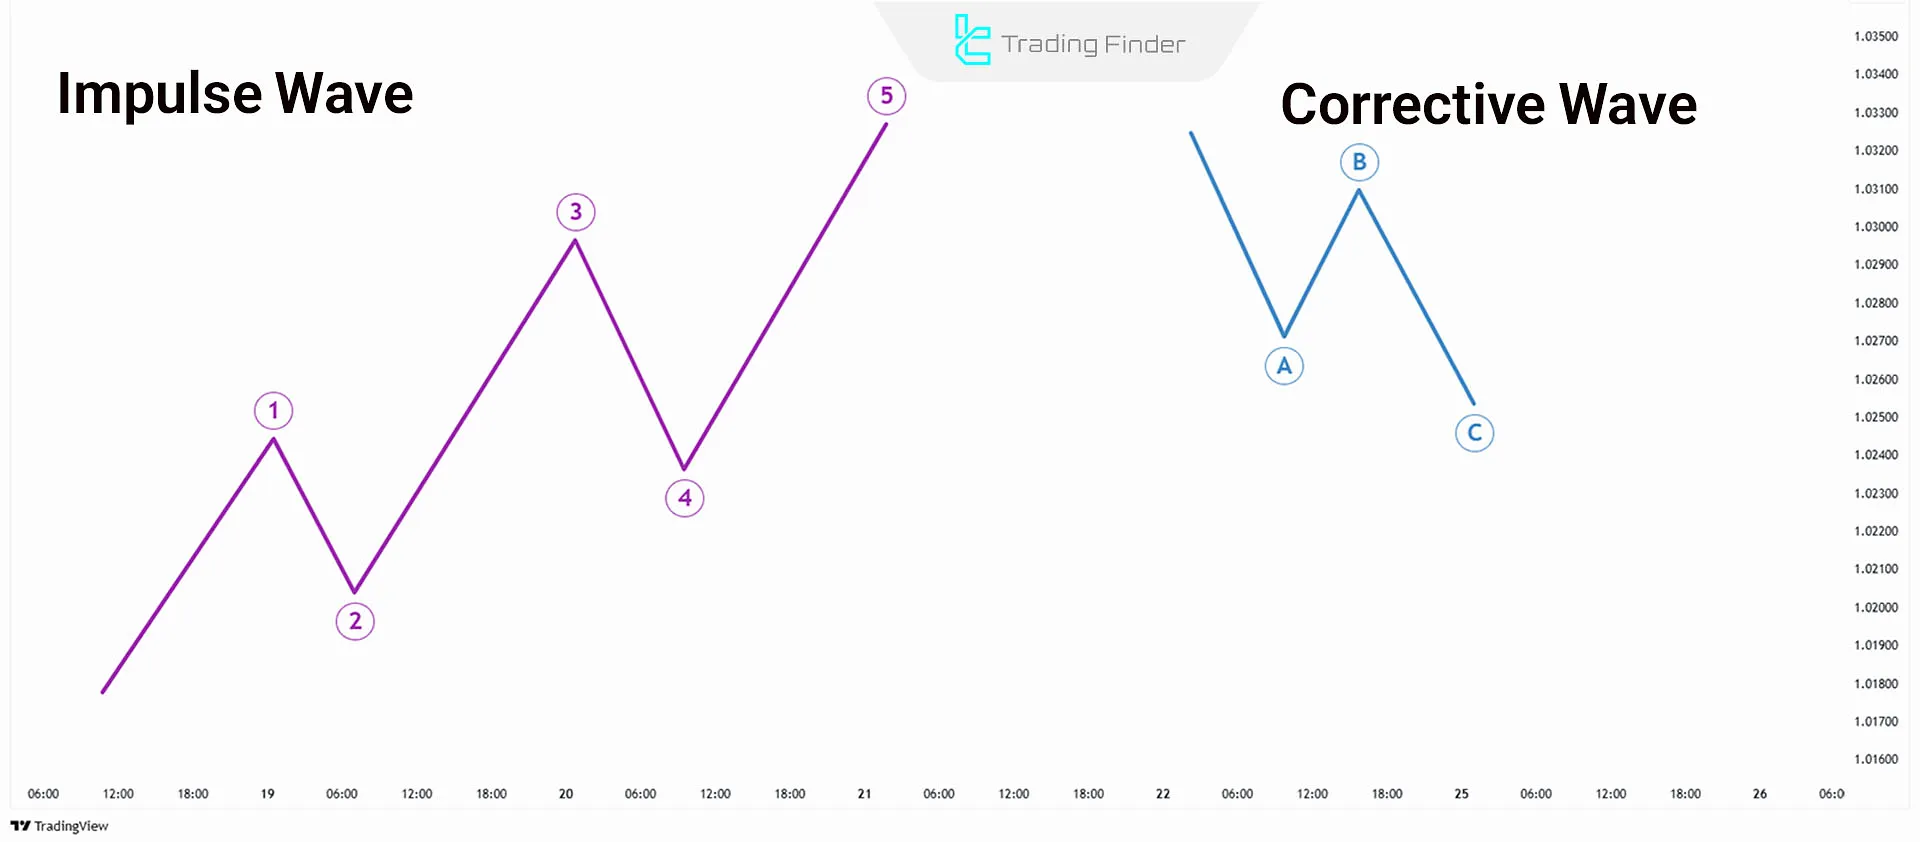
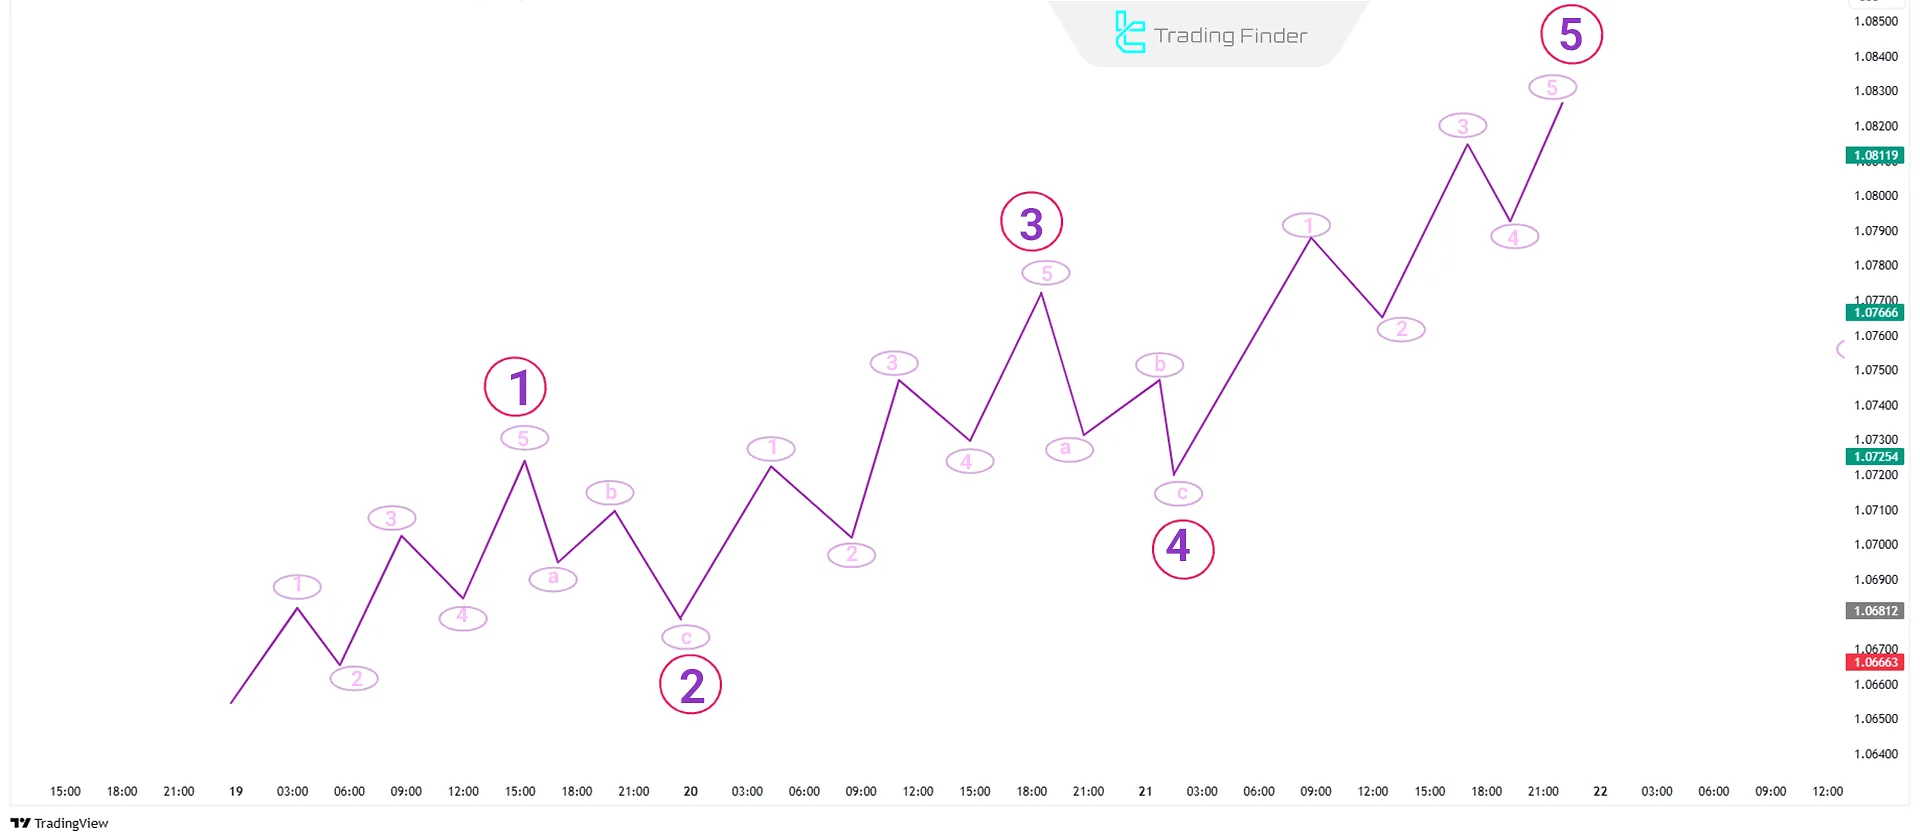
The Elliott Wave Theory (Elliott Wave) generally examines price movements in the direction of the main trend in five waves, called impulse waves, and trend corrections in three waves, called corrective waves.
In this model, impulse waves are labeled 1 to 5, and corrective waves are labeled a, b, and c. These patterns are visible in both long-term and short-term charts.
Smaller patterns usually nest within larger ones. By combining these patterns with the principles of Fibonacci and Dow theories, future market movements can be predicted, and trading opportunities can be identified.
Fibonacci Settings in Elliott Waves
Elliott Waves are based on Fibonacci levels (e.g., 0, 1, 1, 2, 3, 5, 8, 13, ...). Therefore, we useFibonacci to identify the targets of impulse and corrective waves in Elliott Waves.
For example, the key Fibonacci levels for impulse waves are as follows:
- Wave 2 typically retraces 50%, 61.8%, 76.4%, or 85.4% of Wave 1;
- Wave 3 usually extends to 161.8% of Wave 1;
- Wave 4 often retraces 14.6%, 23.6%, or 38.2% of Wave 3;
- Wave 5 is usually between 1.236 to 1.618 times Wave 4 and is equal to Wave 1 or 61.8% of the combined length of Waves 1 and 3.
Characteristics of Impulse Waves
Impulse waves consist of 5 waves that are drawn in the direction of the main market trend. Below, we examine each wave.
Wave 1 of Elliott Impulse
Wave 1 marks the beginning of a new trend in the market and usually indicates a major market trend reversal.
At the start of Wave 1, trading volume is low because the market has not yet recognized the trend change, and most traders have not confirmed the reversal.
Wave 2 of Elliott Impulse
Wave 2 in impulse waves is known as the first corrective wave after Wave 1. This wave is usually a corrective movement in the opposite direction of Wave 1, providing an opportunity to re-enter the new trend. Rules for forming Wave 2 in Elliott Waves:
- Volume in Wave 2 should be lower than in Wave 1;
- The price increase is usually less than 61.8% of the movement in Wave 1;
- The price movement is accompanied by a decline.
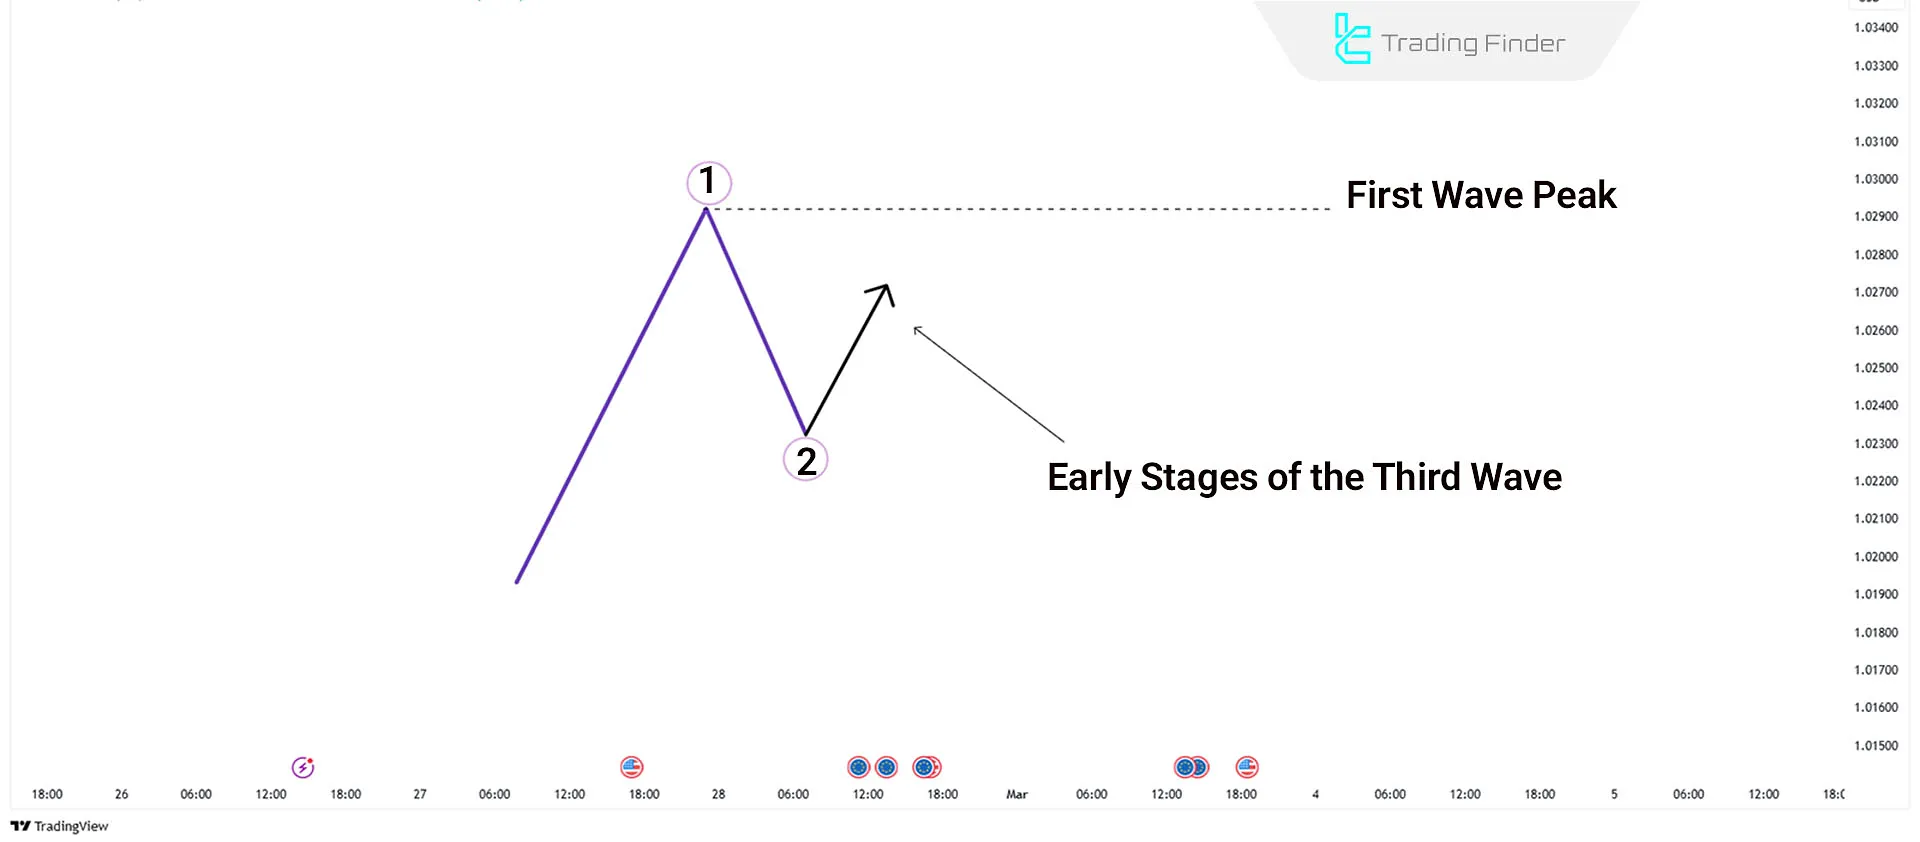
Wave 3 of Elliott Impulse
Wave 3 is usually the strongest and most dynamic wave in impulse waves, confirming the direction of the new market trend.
This wave is often accompanied by increased trading volume as more traders join the trend, and it grows at least 1.618 times Wave 1.
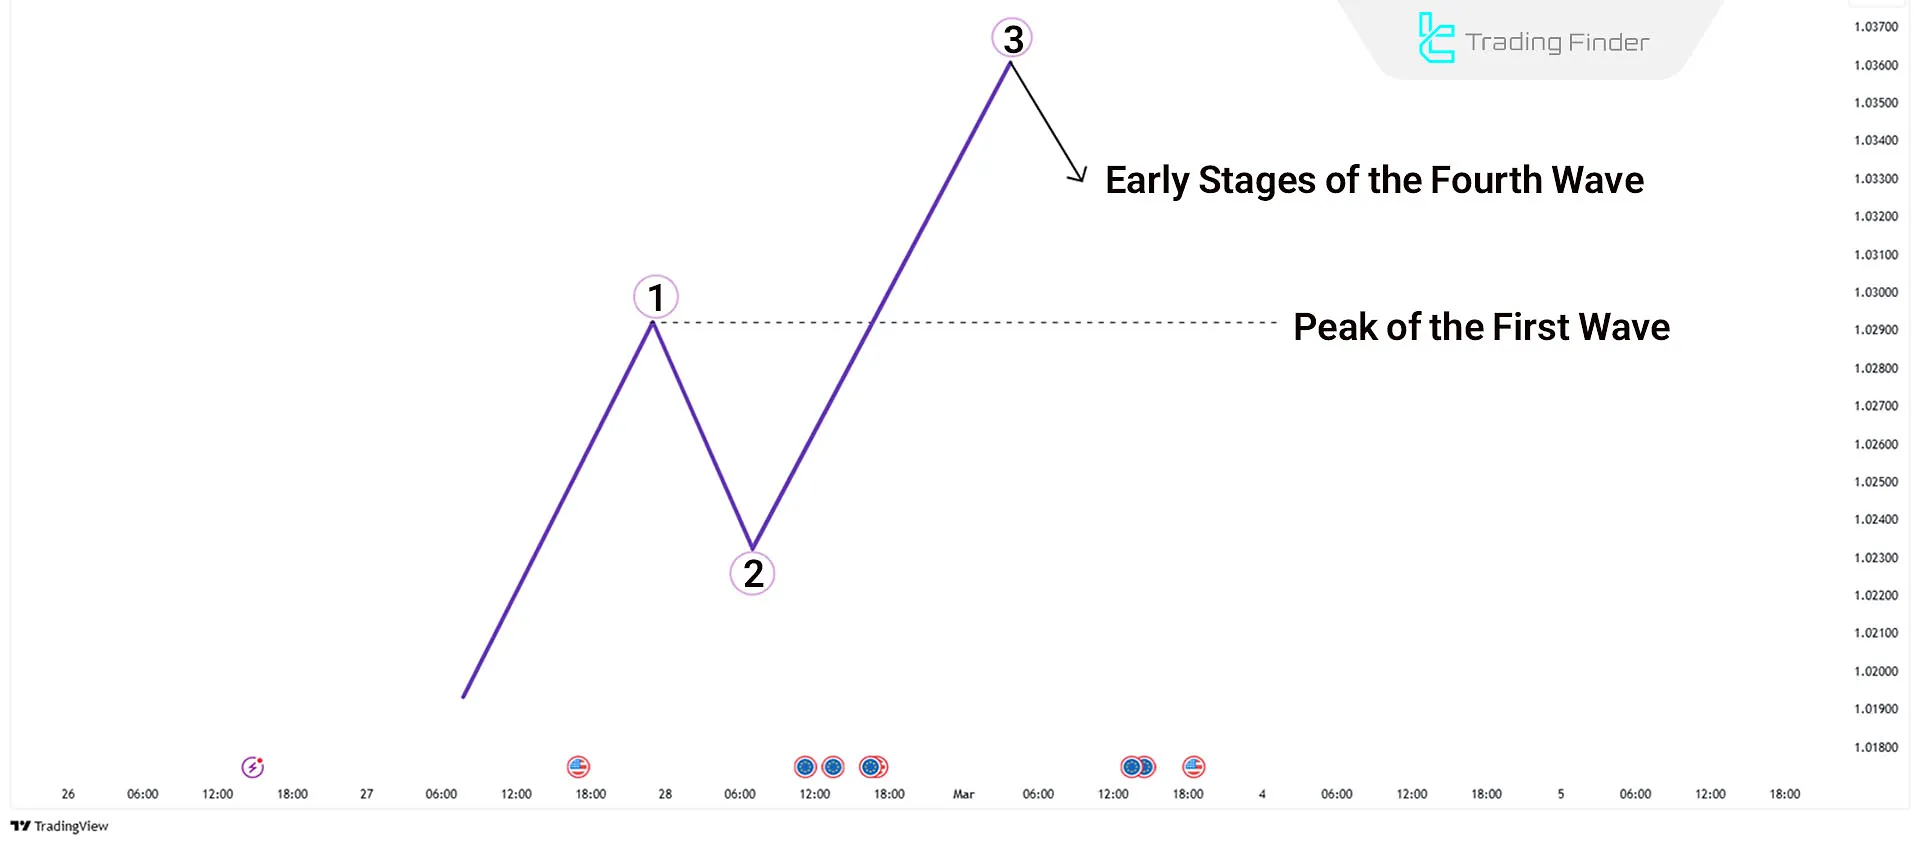
Wave 4 of Elliott Impulse
Wave 4 is a corrective wave that shows a temporary pause in the main trend and a reduction in market excitement before entering Wave 5.
This wave usually has a complex structure, and trading volume decreases in it. One of the most important rules of Wave 4 in advanced Elliott Waves is that it should not enter the territory of Wave 1.
Wave 5 of Elliott Impulse
Wave 5 is usually the final movement in the direction of the main trend, after which a major correction (a-b-c pattern) occurs.
Professional traders exit the market at this stage, while novice traders may enter due to excessive excitement.
Types of Impulse Waves
Elliott Impulse Waves consist of five waves that move in the direction of the main trend and may form a larger wave in higher timeframes. Types of Elliott Impulse Waves:
- Impulse Wave
- Impulse with Extension
- Diagonal Wave
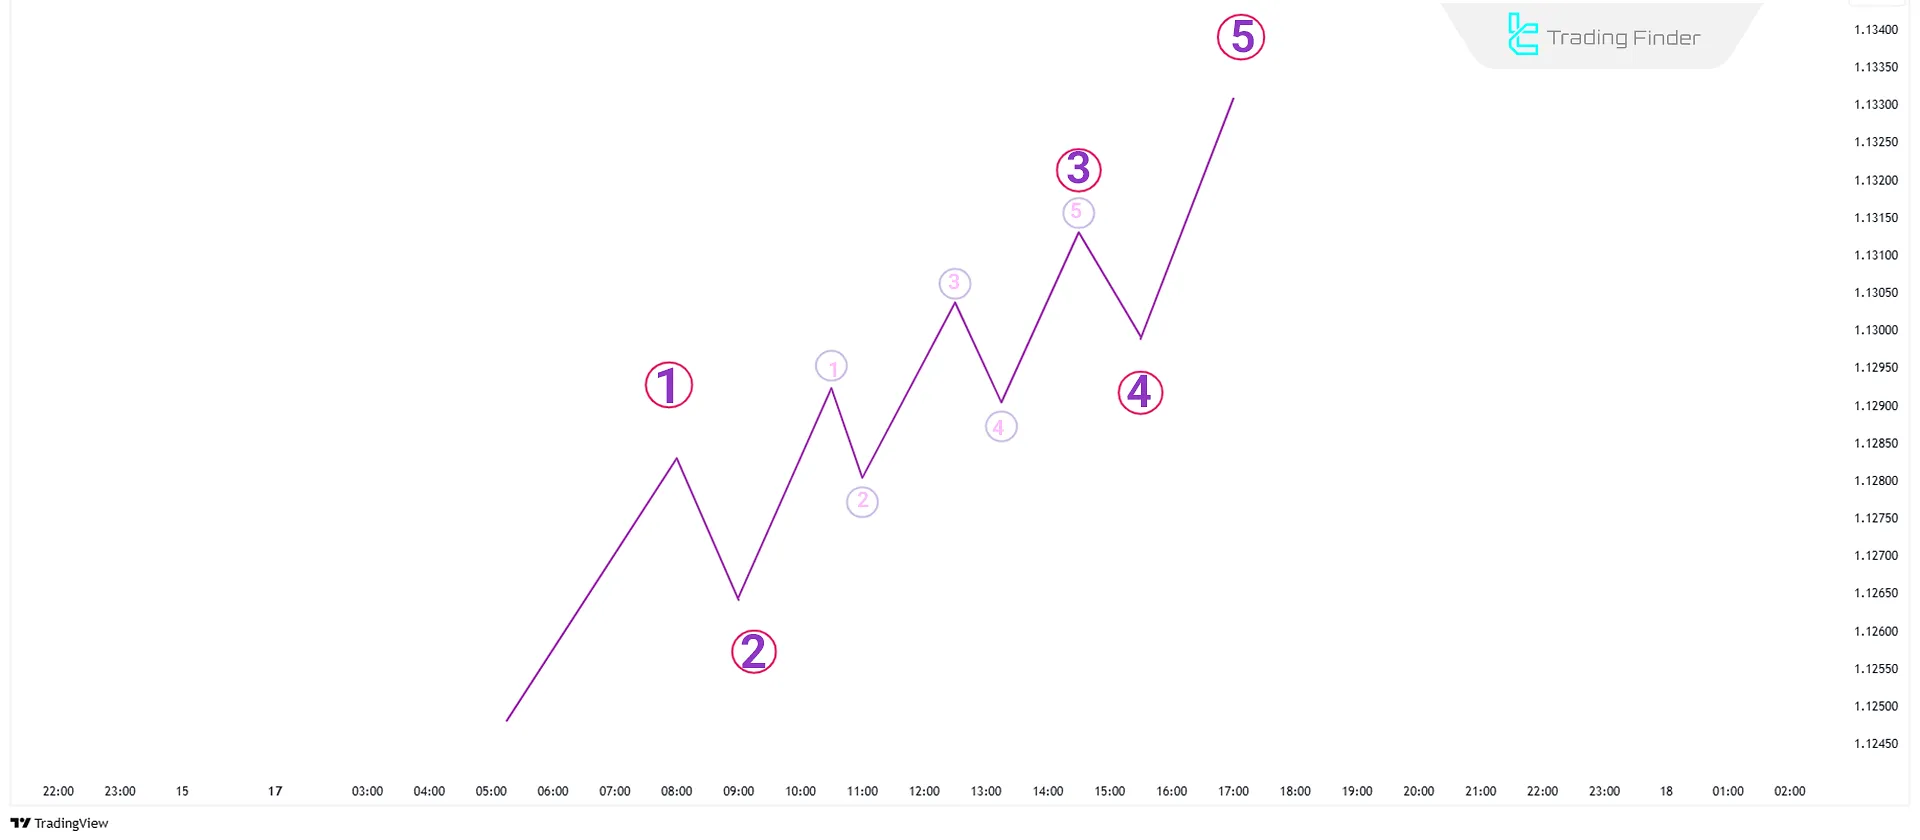
Impulse Waves
Impulse Waves are one of the main phenomena in Elliott Theory, forming a powerful movement in the direction of the main market trend.
These waves usually consist of five sub-waves, including three impulse waves and two corrective waves.
Fibonacci Settings for Impulse Waves
Fibonacci settings for impulse waves are as follows:
- Wave 2 typically retraces 50% to 61.8% of Wave 1;
- Wave 3 is usually 1.618 times Wave 2 or more;
- Wave 4 often retraces 23.6% to 38.2% of Wave 3;
- Wave 5 can be equal to Wave 1 or 0.618 to 1.618 times Wave 3.
Impulse with Extension
Impulse with Extension is a type of impulse wave that appears longer and more stretched in certain parts.
These waves usually extend in one of the impulse waves (1, 3, or 5). Specifically, in the stock and forex markets, extended waves are most commonly observed in Wave 3.
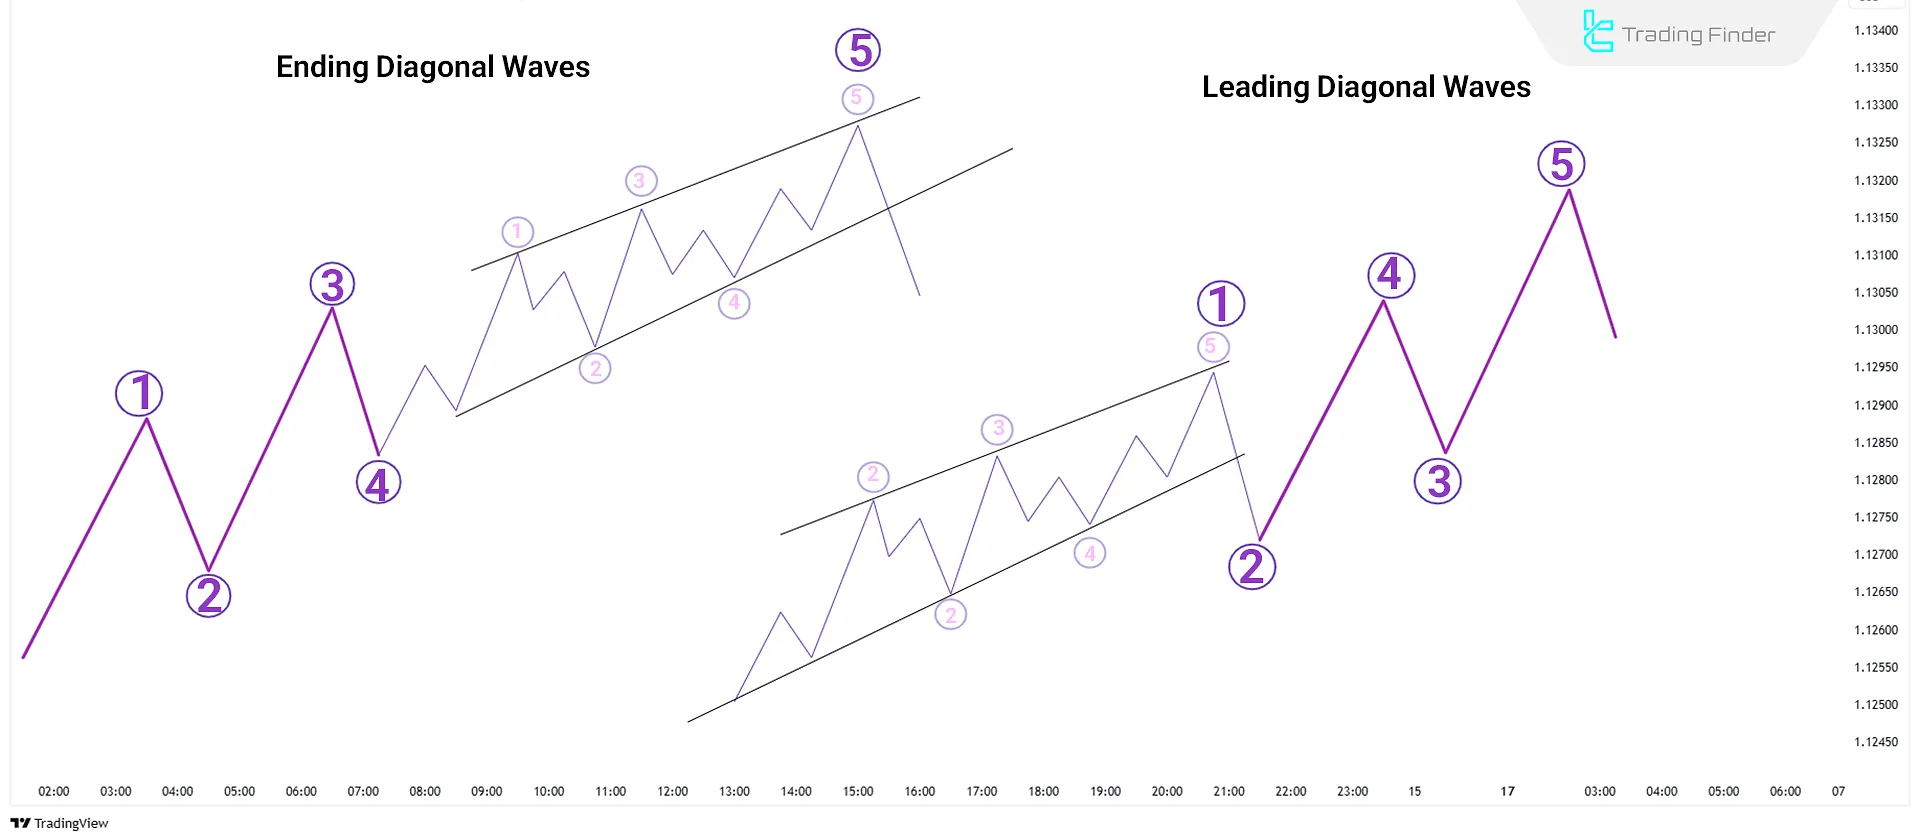
Diagonal Waves
Diagonal Waves, instead of having a clear 5-wave movement structure, form with more slope and overlap. These waves usually appear at the beginning or end of a strong trend. Types of Elliott Diagonal Waves:
- Leading Diagonal
- Ending Diagonal
Characteristics of Corrective Waves
Corrective waves consist of waves a, b, and c, which are drawn during market corrections. Below, we examine these waves.
Wave a of Elliott Correction
Wave a is the first part of a three-wave correction (a-b-c) that occurs after a five-wave impulse movement.
This wave indicates the beginning of the corrective phase and usually moves the market against the previous trend.
Wave a is often accompanied by lower trading volume and a relative price decline.
Wave b of Elliott Correction
Wave b moves in the opposite direction of Wave a and is considered a correction within a correction.
This wave often creates a false impression of the continuation of the previous trend. Wave b typically retraces 38.2% to 78.6% of Wave a.
Wave c of Elliott Correction
Wave c indicates the end of the corrective phase in a complete trend of impulse and corrective waves in Elliott Waves.
This wave is usually accompanied by a strong movement in the direction of Wave a and is the largest corrective wave in the a-b-c structure.
Wave c is equal to or larger than Wave a and, in many cases, marks the end of the correction and the beginning of a new trend.
Types of Corrective Waves
Corrective waves are more diverse than impulse waves and are harder to identify. Corrective waves always move in three waves and are never five-wave structures. There are four types of corrective patterns:
- Zigzag
- Flat
- Triangles
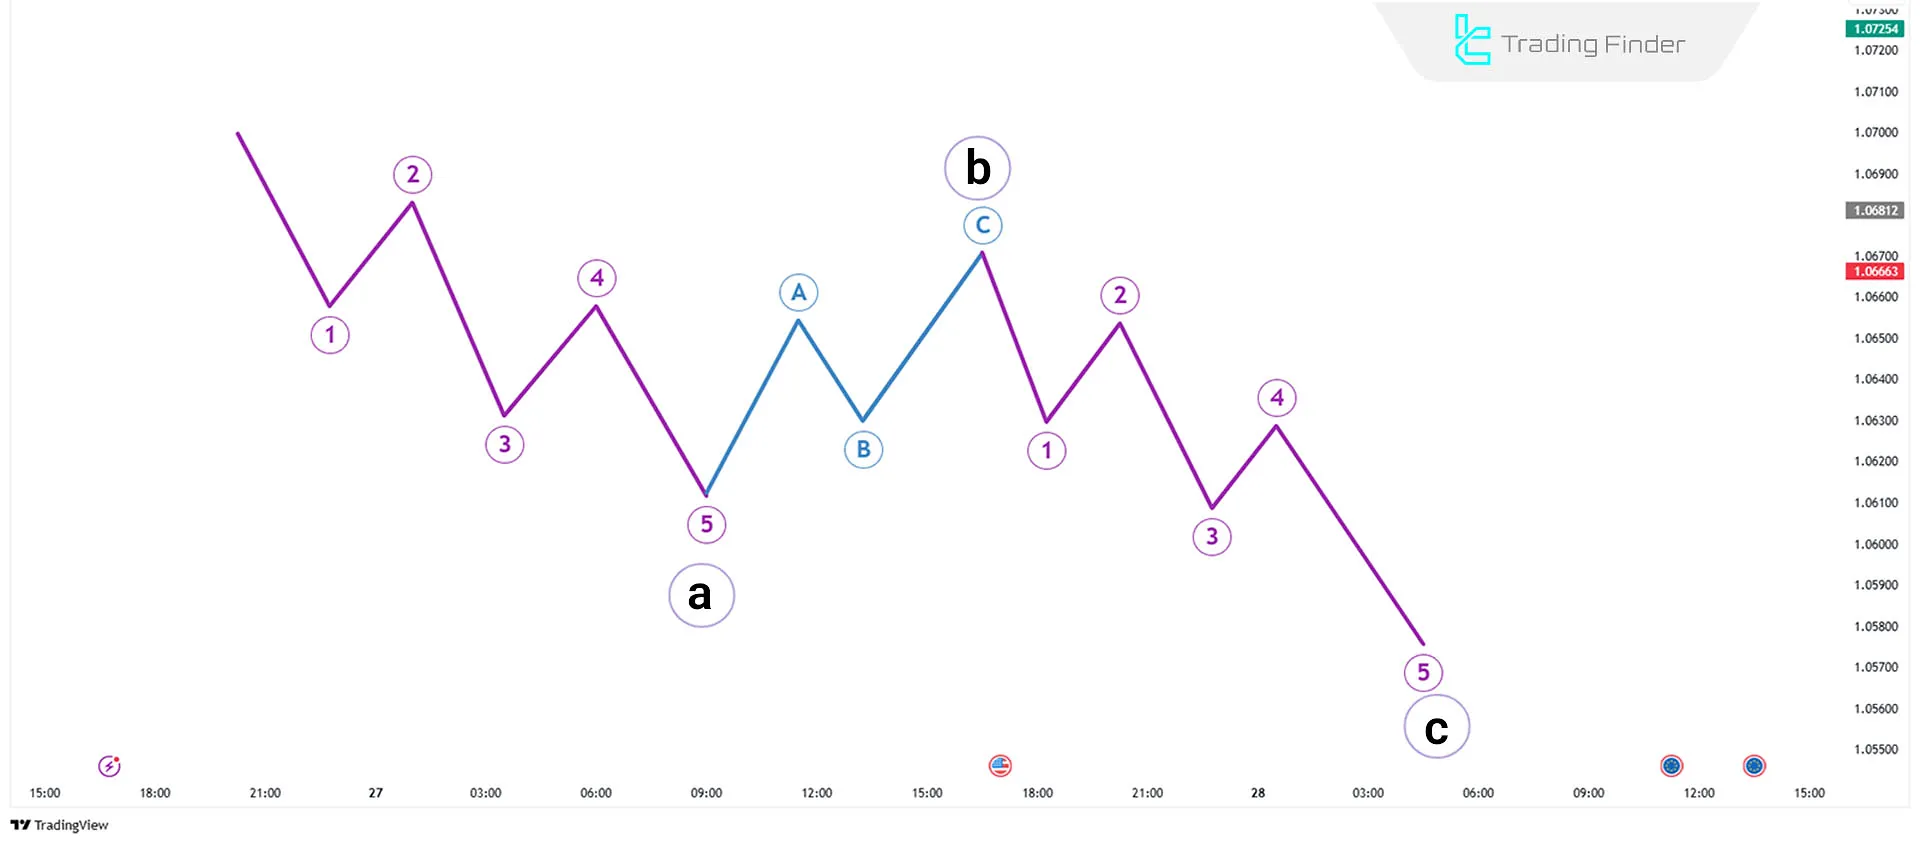
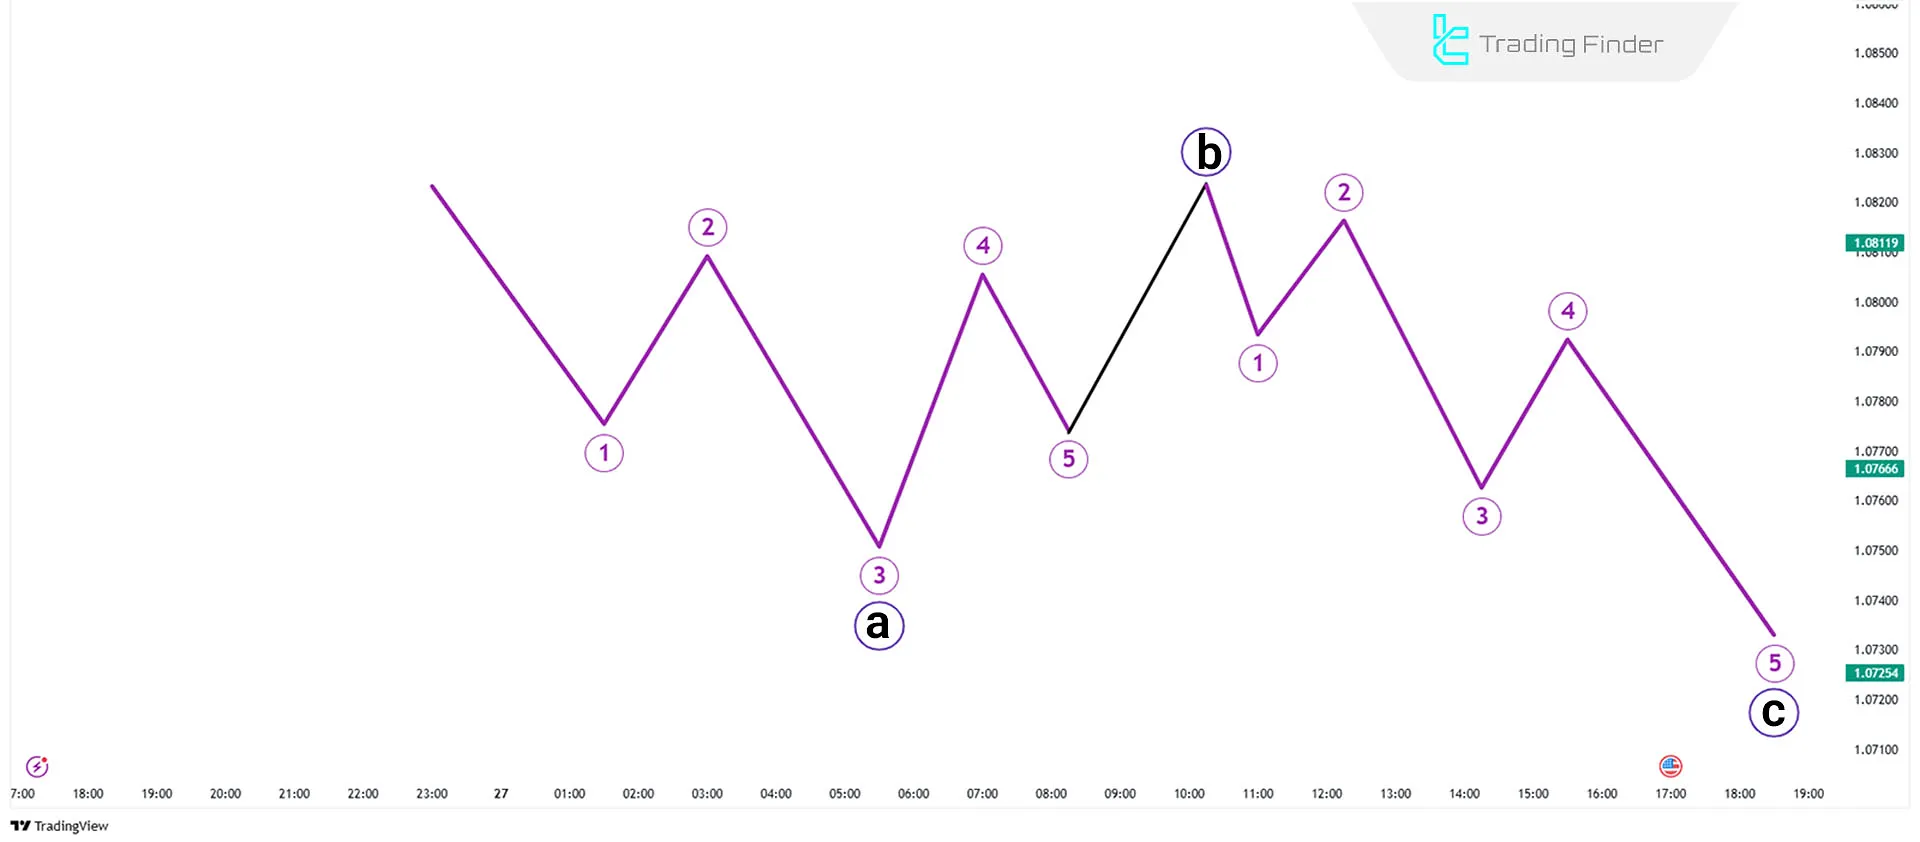
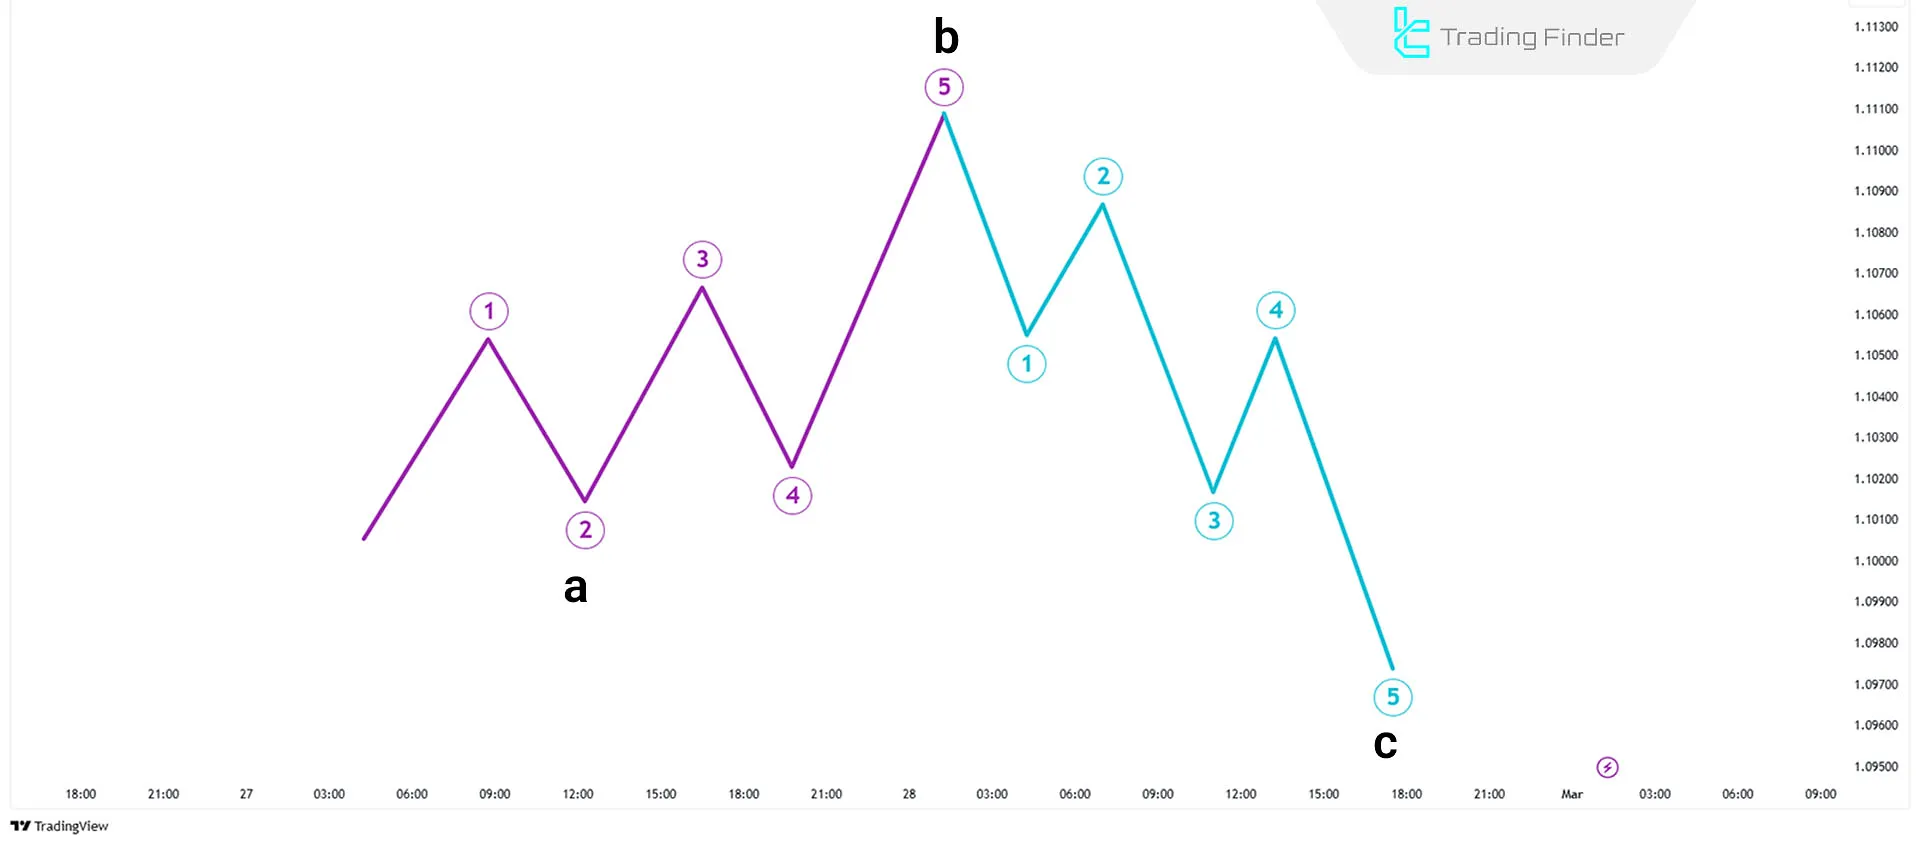
Zigzag
Zigzag is one of the three-wave corrective patterns (a-b-c) in Elliott Wave Theory, where the market moves sharply against the main trend.
This correction is often sharp and represents a deep correction relative to the previous trend.
Fibonacci Settings for Zigzag
- Wave b is approximately 50%, 61.8%, 76.4%, or 85.4% of Wave a;
- Wave c is approximately 61.8%, 100%, or 123.6% of Wave a;
- Wave c is usually equal to or larger than Wave a and can extend further if it reaches 161.8% of Wave a.
Flats
The Flat pattern, unlike the Zigzag, has a shallower and more sideways (range-bound) correction.
This correction usually moves the market horizontally or with a slight slope, resembling a sideways movement or price consolidation rather than a sharp correction.
Types of Elliott Flat Patterns:
Pattern Type | Wave b to Wave a Ratio | Wave c to Wave a Ratio | Description |
Regular Flat | 90% to 100% | Equal to or slightly more | Neutral correction with sideways movement |
Expanded Flat | More than 100% (usually 123.6%) | Longer than Wave a (usually 1.618 times) | Strong upward or downward movement in Wave c |
Running Flat | More than 100% | Shorter than Wave a | Strength in Wave b and failure of Wave C to surpass Wave a |
The Regular Flat pattern consists of a corrective wave movement with three phases (a-b-c). The wave division is shown in the image below:
In the Expanded Flat, since Wave c is significantly larger than the end level of Wave a, the pattern is drawn as follows:
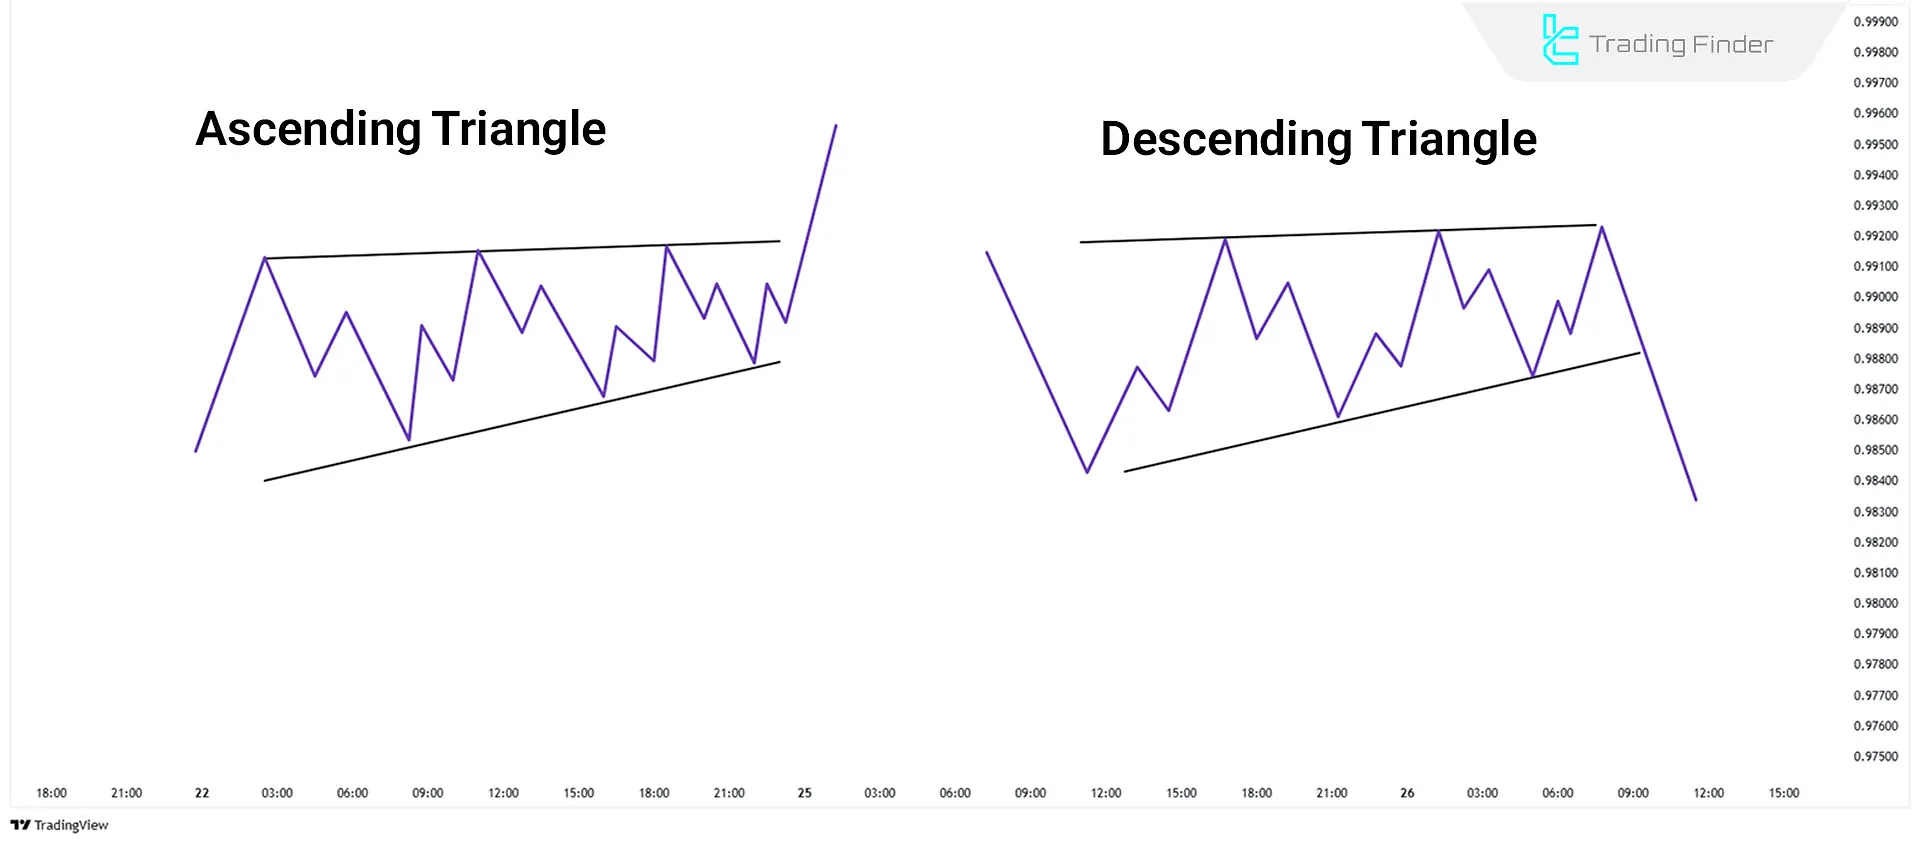
Triangles
Triangle patterns form when the market moves within a tight range. These waves usually occur in Wave 4 or Wave b before the main movement.
Complex Corrections
Sometimes market corrections are not simple and are formed by a combination of Zigzag, Flat, and Triangle patterns. In such cases, multiple corrective patterns are connected by Wave X.
These corrections usually appear in range-bound markets and cause unpredictable movements in the chart.
Conclusion
Using Elliott Waves, repetitive market patterns can be identified, and price movements can be predicted. These waves consist of 5 impulse waves and 3 corrective waves (a-b-c).
Impulse and corrective waves in Elliott Waves are used along with Fibonacci numbers to determine price targets and potential corrections.


