


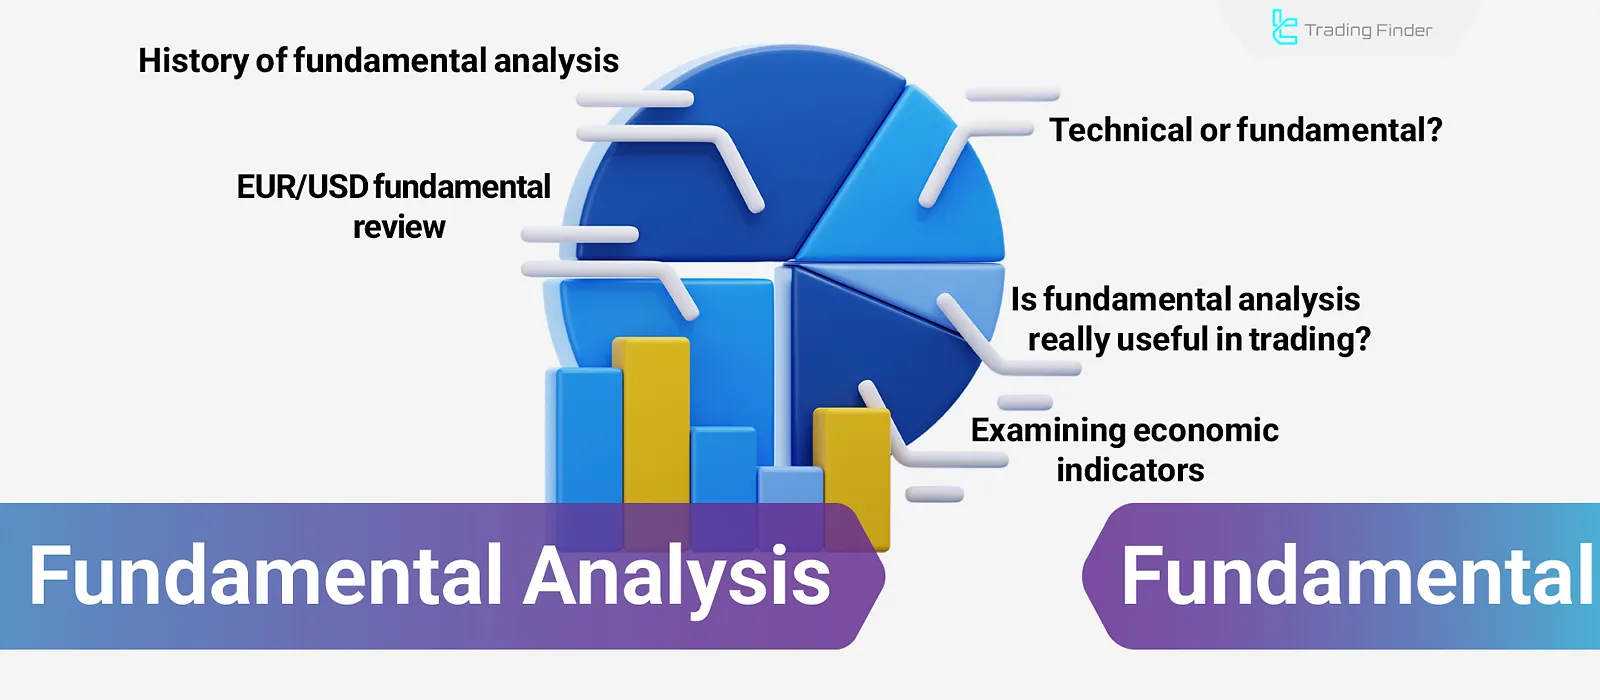
Fundamental analysis is one of the analytical approaches used to forecast the overall trend of all financial markets [Forex, commodities, stocks, and cryptocurrencies].
It examines fundamental factors likeeconomic data, central bank meetings,market sentiment, earning reports, and geopolitical risks to identify the mid-term and long-term price trends (currency pairs, stocks, gold, oil, etc).
In this style, the trader attempts to assess the intrinsic value of the asset based on economic conditions and monetary policies, and to identify the dominant market direction before it is fully formed on the chart.
What is Fundamental Analysis?
Fundamental Analysis is a method used in financial markets with the aim of identifying the intrinsic value of assets (the true value of an asset based on macroeconomic parameters and fundamental analysis) and predicting mid-term and long-term trends.
History of Fundamental Analysis
The initial idea of fundamental analysis emerged with the rise of classical economics in the 18th and 19th centuries. Adam Smith, in his book "The Wealth of Nations," first emphasized the concept of intrinsic value and the factors influencing the value of goods and services.
Modern fundamental analysis was introduced in 1934 with the publication of the book Security Analysis by “Benjamin Graham” and “David Dodd”.
These two university professors laid the foundation for scientific methods of estimating the intrinsic value of stocks by presenting analytical frameworks grounded in financial and economic data.
Advantages and Disadvantages of Fundamental Analysis
Fundamental analysis focuses on examining financial statements, macroeconomic conditions, industry positioning, and a company’s competitive advantages, and it has shaped the investment decision-making framework based on real market data.
In the table below, we review the specialized advantages and disadvantages of fundamental analysis:
Advantages | Disadvantages |
Identifying the intrinsic value of an asset | Time lag in market reaction |
Logical basis for decision-making | Low efficiency in short-term trading |
Reducing emotional decision-making errors | High dependence on data quality |
Ability to assess earnings sustainability | Complexity of financial statement analysis |
Possibility of forecasting economic trends | Uncertainty in the realization of forecasts |
Suitable for long-term strategies | Time-consuming analysis process |
Assessing companies’ financial health | Difficulty in accessing transparent information |
Identifying sustainable competitive advantages | Sensitivity to political variables |
Supporting risk management | Inability to determine precise entry and exit points |
Applicability across diverse markets | Risk of misinterpreting macroeconomic data |
Fundamental Factors Affecting Assets
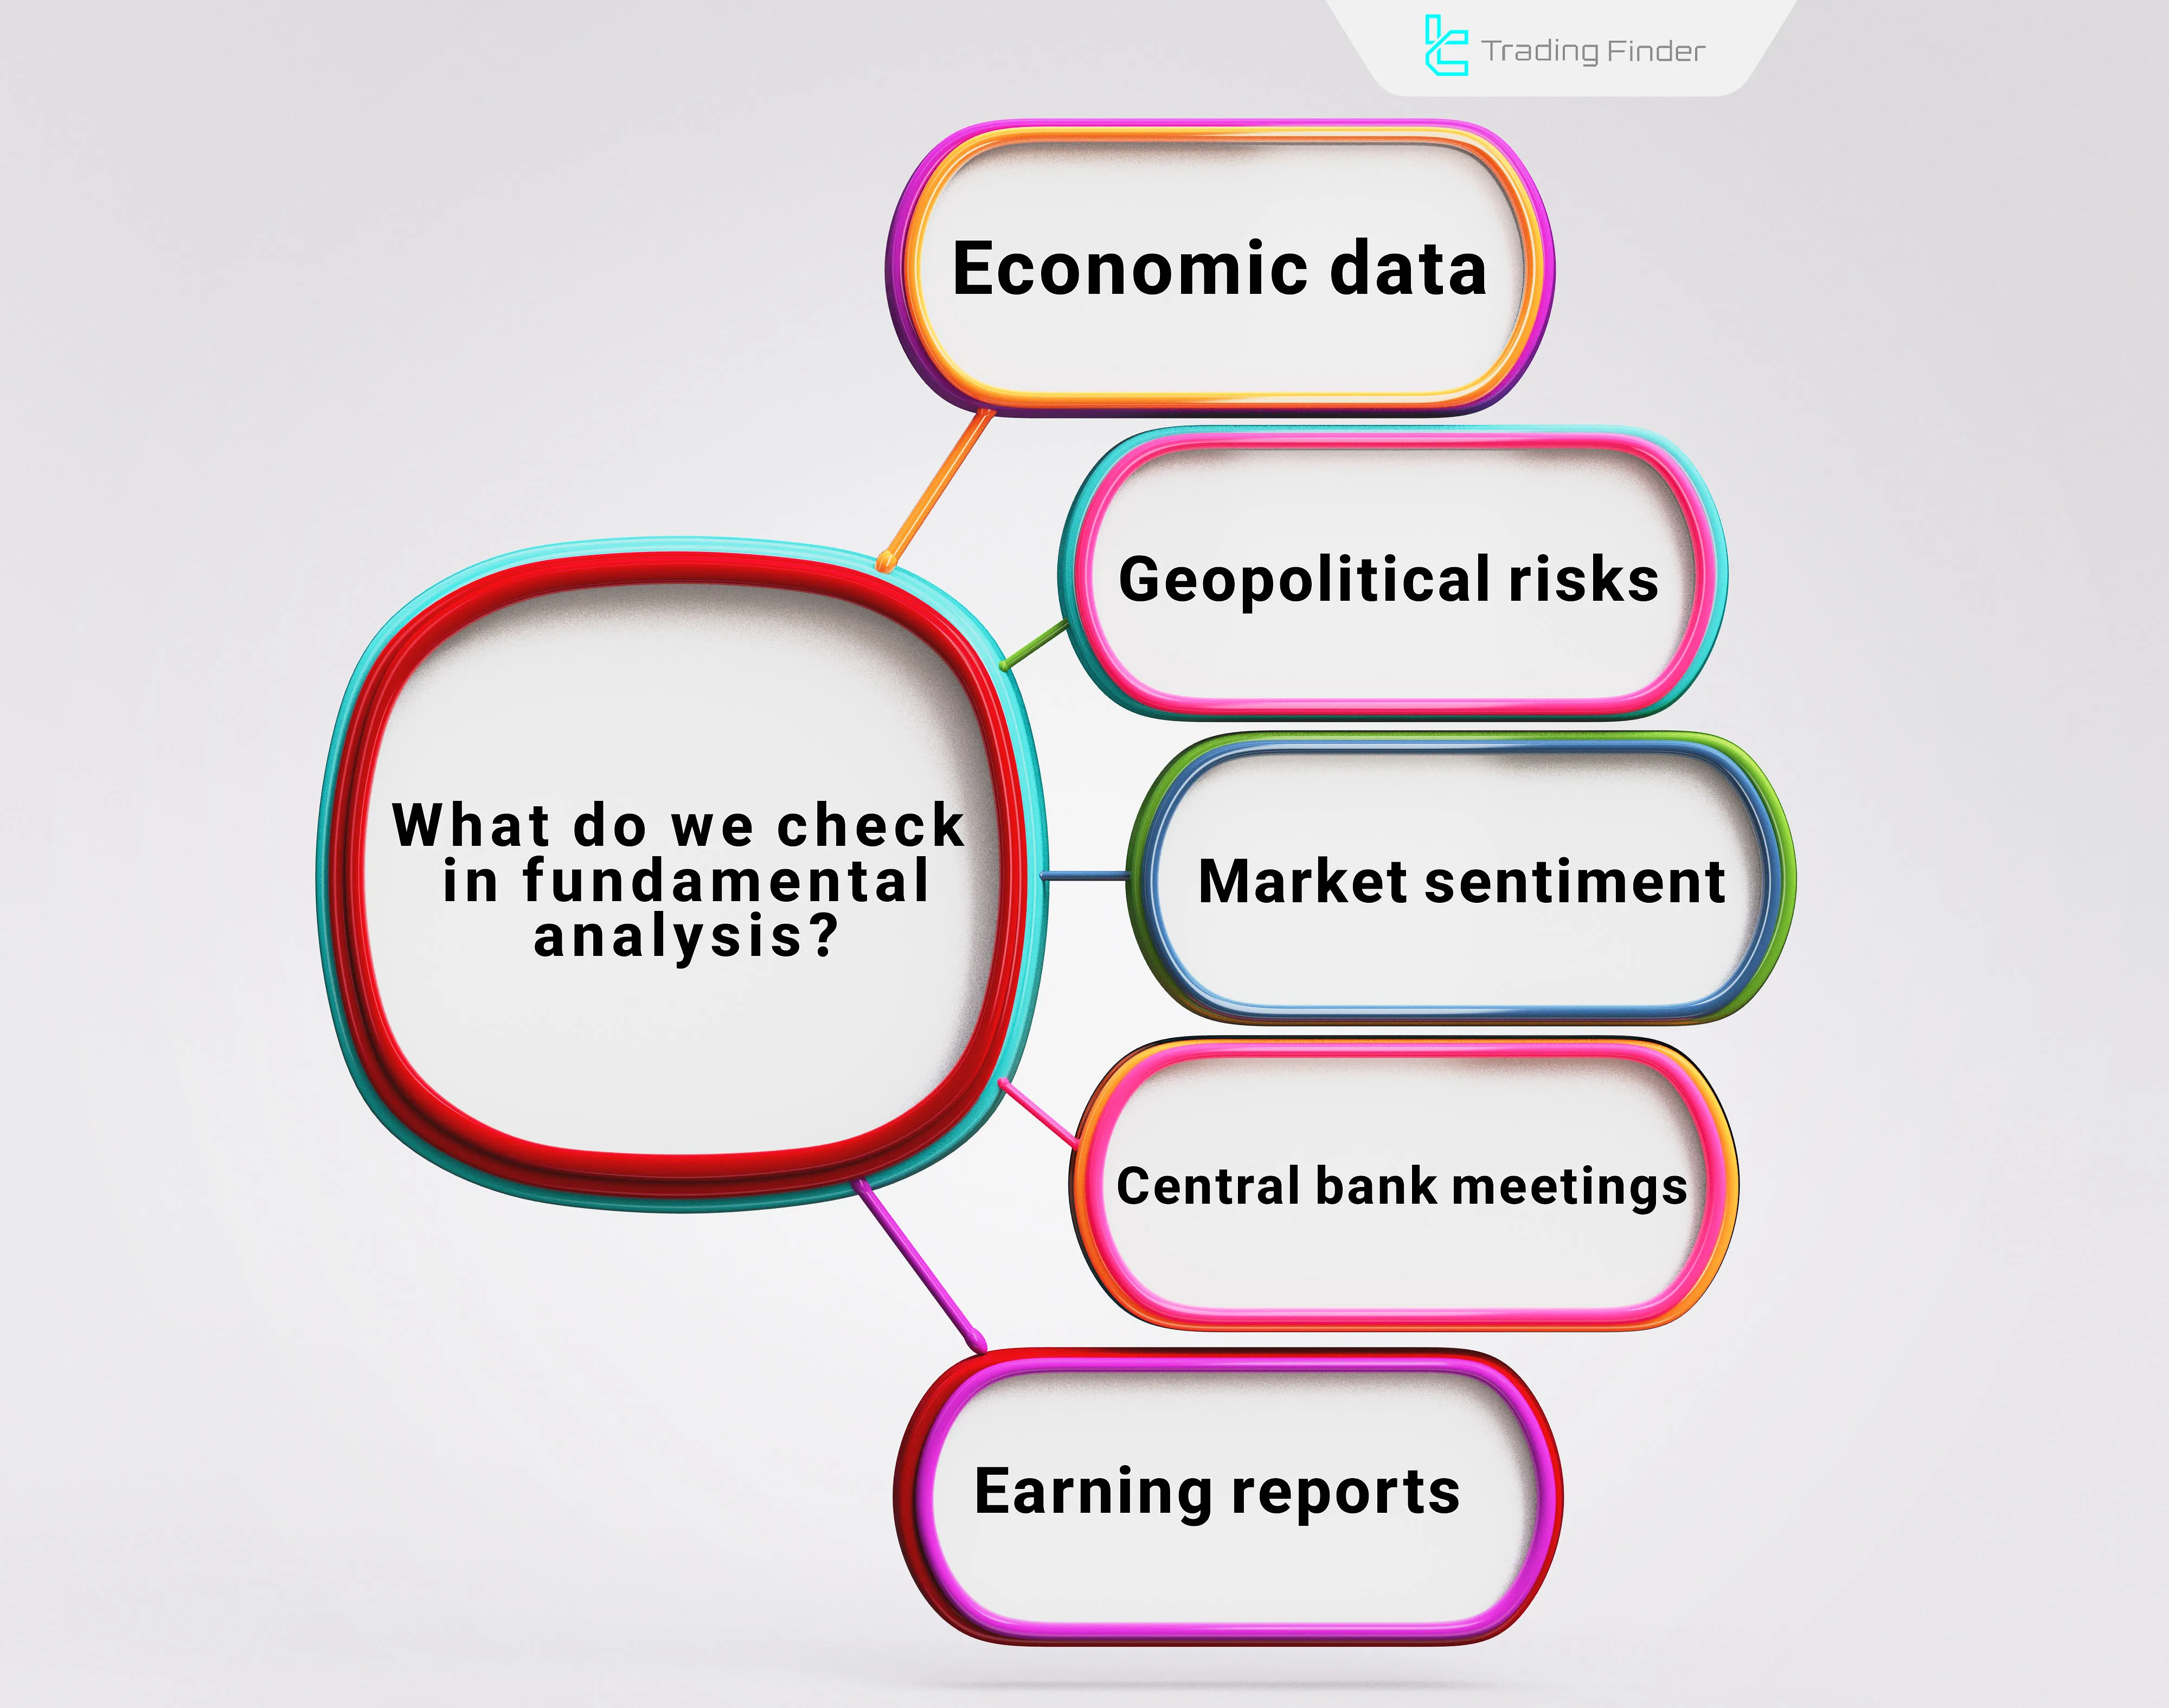
Several data points are examined in fundamental analysis, including economic data and market sentiment. Key fundamental factors affecting assets include:
- Economic Data
- Central Bank Meetings
- Income Reports and Financial Statements
- Market Sentiment
- Geopolitical Risks
Economic Data
Economic data refers to the reports published on Forex Factory, which can be categorized into three main types: production data, inflation data, and employment data.
Continuously studying and evaluating these reports provide insights into a country's macroeconomic conditions and are helpful for fundamental analysis of forex.
Using economic data, fundamental biases (the bias of an asset based on fundamental parameters) can also be identified for currency pairs.
Central Bank Meetings
Most central banks hold interest rate meetings every six weeks. During these meetings, analysts assess the changes in interest rates, central bank statements, new economic forecasts, and even the tone of the central bank president's speech.
The outcomes of these meetings can lead to sharp volatility and trend changes in financial markets, as they alter investors’ expectations regarding future monetary policies.
For this reason, professional traders, in addition to the interest rate decision, pay close attention to details such as the tone of the statement and references to inflation or economic growth in order to more accurately assess the medium-term direction of price movement.
Earning Reports and Financial Statements
Financial statements, revenue trends, and corporate profitability can be used to forecast valuation trends of stocks and stock market indices. Income reports are released quarterly, and one of the credible sources for these results is Investing.com.
The company's performance is measured by comparing actual earnings per share (EPS) with forecasted figures.
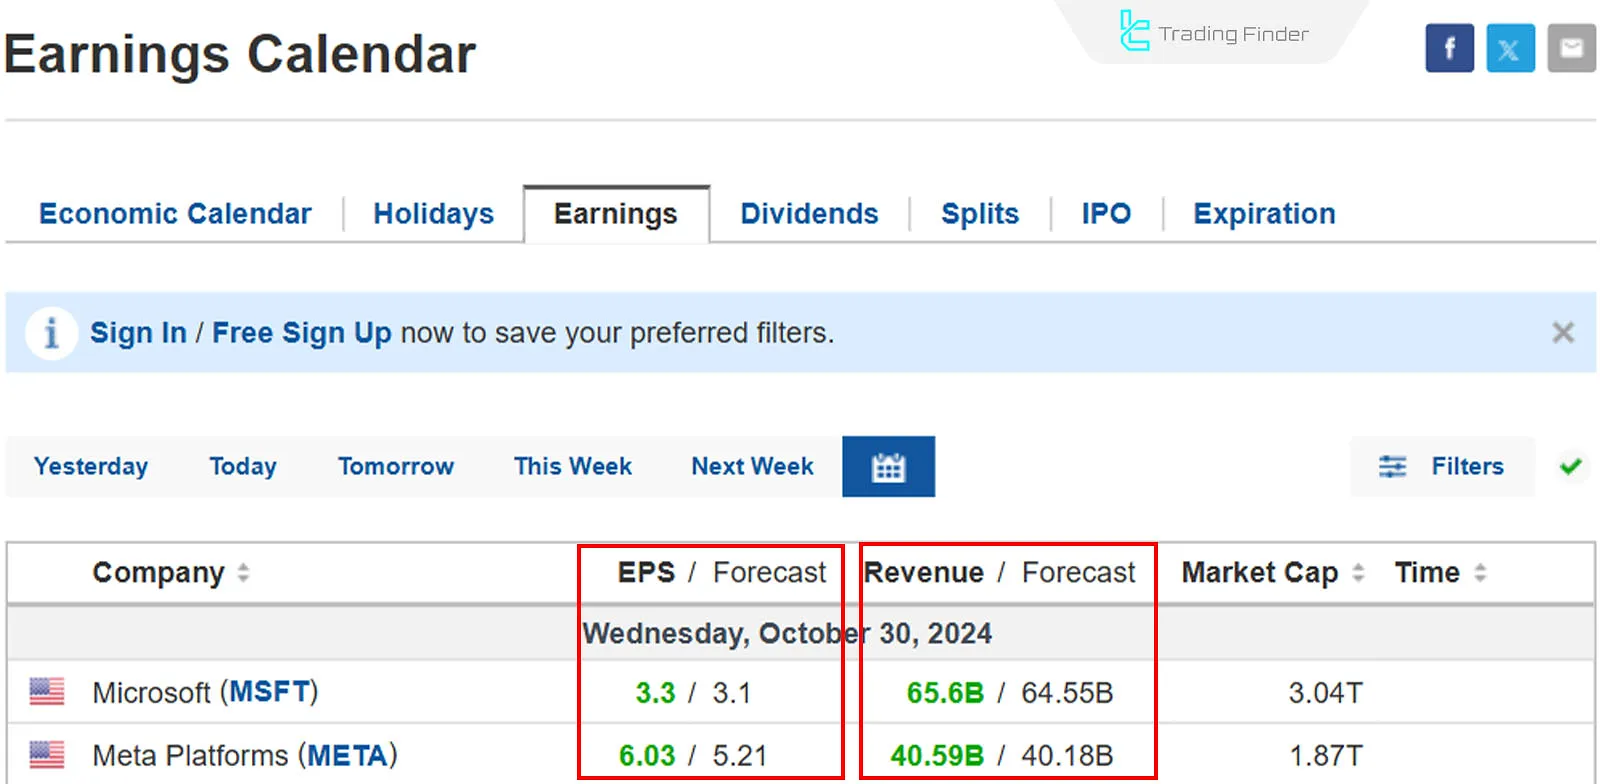
The financial reports of large companies (in terms of market cap) impact the overall market sentiment, and index traders should pay special attention to the reports of these companies.
Key Financial Ratios in Fundamental Analysis
Financial ratios, as numerical indicators, precisely evaluate the level of profitability, liquidity capacity, and overall financial health of a company and form the foundation of fundamental analysis. The most important categories of these ratios are defined as follows:
- Return on Equity (ROE)
- Return on Assets (ROA)
Liquidity ratios are key tools for measuring a company’s ability to meet short-term obligations and include the following:
- Current Ratio
- Quick Ratio
Valuation ratios are the main instruments for assessing the attractiveness of a stock relative to its market price and include the following three items:
- Price to Earnings (P/E)
- Price to Book (P/B)
- Earnings Per Share (EPS)
These ratios quantify the financial strength of companies and clarify the process of distinguishing strong companies from weak structures in trading decision-making.
Market Sentiment
Market sentiment refers to the willingness or reluctance of traders to take risks. In a risk-off market, safe assets like gold, bonds, and low-risk currecies (such as CHF, JPY, and USD) are in demand.
Conversely, in a risk-on market, demand shifts towards riskier assets like stocks, cryptocurrencies, andrisk-on currencies (such as AUD, NZD, and CAD).
Geopolitical Risks
Political risks (such as presidential elections) and geopolitical risks (such as wars) are significantly unpredictable. As geopolitical tensions increase, fear spreads in the market, and it enters a risk-off state. In this case, safe assets become more in demand, while riskier markets face selling pressure.
Reliable Data Sources for Fundamental Analysis
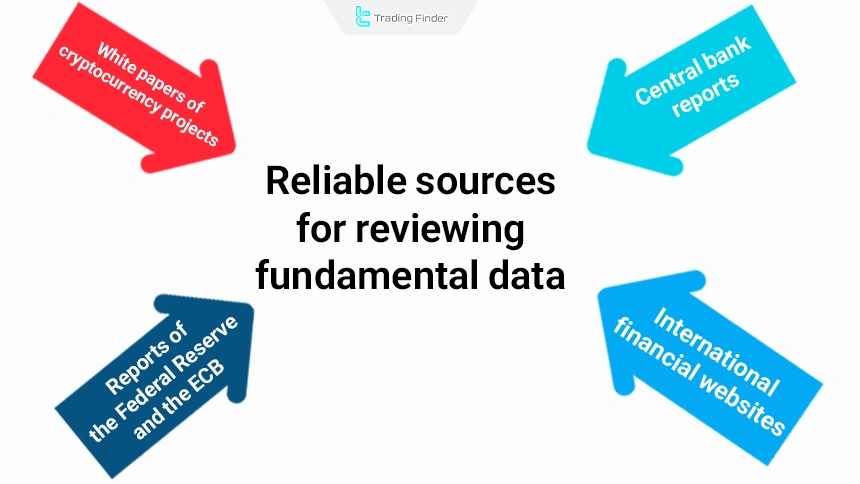
To conduct an accurate and reliable fundamental analysis, access to credible and up-to-date data sources plays a vital role, as the quality of an investor’s decision-making is directly affected by the accuracy and completeness of this information. Reliable sources for reviewing fundamental data include the following:
- International financial websites (such as Investing and Trading Economics)
- Central bank reports
- White papers of cryptocurrency projects
- Federal Reserve and ECB reports
Application of Fundamental Analysis
By using fundamental analysis and economic data, one can detect the fundamental bias of assets and avoid opening positions contrary to market biases.
Fundamental analysis, by determining the intrinsic value of a stock or asset, indicates the likelihood of price reaching its fair value.
If the current price of an asset is lower than its intrinsic value, a buying opportunity is presented. Conversely, if the price is higher than its intrinsic value, traders can consider selling.
Difference Between Short-Term and Long-Term Fundamental Analysis
The difference between short-term and long-term fundamental analysis lies mainly in the type of data used, the trading objective, and the time horizon. Both are fundamental in nature, but their applications are completely different:
- Long-term fundamental analysis: focuses on sustainable company growth, profitability, and future development;
- Short-term fundamental analysis: focuses on news, quarterly reports, and economic data.
In Forex, short-term fundamental analysis has greater applicability, while in the stock market, long-term analysis is dominant.
Steps of Conducting Fundamental Analysis
The steps of conducting fundamental analysis are summarized step by step as follows:
- Selecting the target market and asset in line with the investment strategy;
- Reviewing the overall economic situation and macro variables affecting the asset;
- Analyzing the related industry in terms of growth cycle, competition, and structural risks;
- Reviewing the company’s financial statements in the stock market based on the balance sheet, income statement, and cash flow statement;
- Purposeful use of financial ratios (Financial Ratios) to assess profitability, liquidity, and financial leverage;
- Valuing the asset using valuation models and estimating intrinsic value (Intrinsic Value);
- Comparing the market price with intrinsic value to identify undervaluation or price bubble conditions;
- Making the final decision to buy, sell, or hold the asset based on the analysis results.
After completing these steps, the analyst should combine economic data, industry information, and financial statement results to form an integrated picture of the asset’s condition.
This picture is shaped not only by numerical data, but also by the growth outlook, competitive advantage, systematic and unsystematic risks, and the sustainability of earnings.
Different price scenarios are developed so that the investor can adopt an optimal strategy by considering the time horizon, risk tolerance, and financial objectives, and avoid emotional and short-term decisions.
In the educational video on the TraderNick YouTube channel, supplementary explanations about fundamental analysis are provided, and the video content explains the path to understanding intrinsic asset value, economic data, and the logic of investment decision-making.
Real-World Example of Fundamental Analysis
Suppose we intend to perform a fundamental analysis on the stock of a hypothetical company in the petrochemical industry. The review process is as follows:
- Reviewing the economic situation with a focus on an increase in the dollar exchange rate and its direct impact on the growth of petrochemical exports;
- Industry analysis with an emphasis on the petrochemical sector being positioned within the global demand growth cycle;
- Reviewing financial statements, including +30% annual revenue growth, +25% increase in net profit, and maintaining the debt structure at a controlled level;
- Reviewing financial ratios, including a Price to Earnings (P/E) ratio of 6, which is below the industry average, and a Return on Equity (ROE) of 38%, at a highly favorable level;
- Asset valuation by estimating intrinsic value at a level approximately 30% higher than the market price.
The final result indicates that this stock is fundamentally positioned within a value zone suitable for entry, and its profitability and growth structure are aligned with medium- to long-term investment logic.
Forex Economic Calendar Tool
The TradingFinder Forex economic calendar tool is one of the practical services of the TradingFinder website, which displays events affecting financial markets on a regular and weekly basis.
By providing the exact date and time of news releases, this tool helps traders gain a clear view of the timing of important economic data.
The ability to set a preferred time zone and also filter events by country are among the most important customization features of this calendar.
In the Trading Finder economic calendar, each event includes details such as the news title and the related market.
It also provides four key parameters: the impact level of the news (low, medium, or high), the actual value after release, the forecast value, and the previous value from the prior period.
This information structure forms the main foundation of fundamental analysis in the Forex market.
This tool also enables quick navigation between days and weeks, and events are displayed in both Gregorian and Solar calendars. Coverage of more than 150 countries has made the TradingFinder economic calendar not limited to a specific region and inclusive of various global markets.
In fundamental analysis, the primary focus is on data such as inflation rates including CPI, Gross Domestic Product or GDP, the Purchasing Managers’ Index or PMI, as well as interest rate decisions.
By reviewing these data, traders identify the probable direction of the market. Speeches by central bank officials, especially the Federal Reserve Chair, are also considered important events in this calendar.
This tool plays a key role in implementing news trading strategies and short-term volatility trading; because by being aware of the release time of high-impact news, traders can more precisely adjust their entry and exit points.
In addition to the web version, the TradingFinder economic calendar is also available as a browser extension and a mini application to provide faster access for users.
Overall, with a focus on market trend forecasting, risk management, and market sentiment analysis, this tool is considered one of the practical resources for traders in financial markets.
Valuation Models in Fundamental Analysis
Valuation models in fundamental analysis are used to estimate the intrinsic value of assets, and each model has a specific function in financial decision-making. The most important valuation approaches are defined as follows:
- Discounted Cash Flow model (DCF), based on estimating future cash flows and converting them into present value using a discount rate;
- Price to Earnings model (P/E), based on comparing the stock price with its net earnings to assess the level of valuation;
- Price to Book model (P/B), based on the ratio of a stock’s market price to the value of assets recorded on the balance sheet.
Applying these models makes it possible to identify the gap between market price and intrinsic asset value and creates conditions for recognizing value zones or price bubble areas in the investment decision-making process.
Difference Between Technical and Fundamental Analysis
In fact, choosing between fundamental analysis and news trading largely depends on an investor’s personality type and time horizon. Fundamental investing is more suitable for individuals who pursue gradual and sustainable capital growth through in-depth analysis of economic and financial data.
Whereas News Trading is more applicable to traders who have fast decision-making ability, high stress management skills, and acceptance of intense market volatility, and who benefit from the market’s immediate reactions to news to achieve short-term profits.
In the table below, a specialized comparison of these two approaches is presented:
Comparison criteria | Fundamental analysis | News trading |
Basis of analysis | Financial and economic data | Current news and events |
Type of information | Financial statements, growth rates, inflation | Interest rates, employment reports, political events |
Time horizon | Long-term investing | Short-term volatility trading |
Main objective | Determining the intrinsic value of the asset | Exploiting market reactions |
Reaction speed | Gradual and analytical | Fast and immediate |
Level of volatility | Low to medium | High |
Primary application | Investing | Short-term trading |
Combining Fundamental and Technical Analysis
Combining fundamental analysis and technical analysis is considered one of the most precise approaches for decision-making in financial markets.
Fundamental analysis evaluates the intrinsic value of an asset, while technical analysis helps determine optimal entry and exit timing.
This integration shapes the trading structure based on value logic and price behavior and enhances decision-making accuracy under different market conditions. In fact, in the combined approach:
- Fundamental analysis is used to select the appropriate asset;
- Technical analysis is used to determine entry and exit points.
Combining these two approaches reduces risk and increases decision-making accuracy and is regarded as the most professional trading style.
The educational article on combining technical and fundamental analysis on investopedia.com provides more comprehensive explanations of this approach and structurally explains the dimensions of asset valuation and entry and exit timing.
Differences in Fundamental Analysis Across Stocks, Forex, and Crypto
The nature of fundamental analysis varies depending on the type of market:
- In the stock market: The focus is on financial statements, company profits, debts, target market, and corporate management;
- In Forex: Macroeconomic data such as interest rates, inflation, GDP, unemployment rates, and central bank policies carry greater importance;
- In crypto: Fundamentals are assessed based on the white paper, development team, project use case, supply and demand, tokenomics, and network activity.
A common mistake among many traders is applying a single model across all markets, which leads to incorrect analysis.
Can You Trade Using Fundamental Analysis?
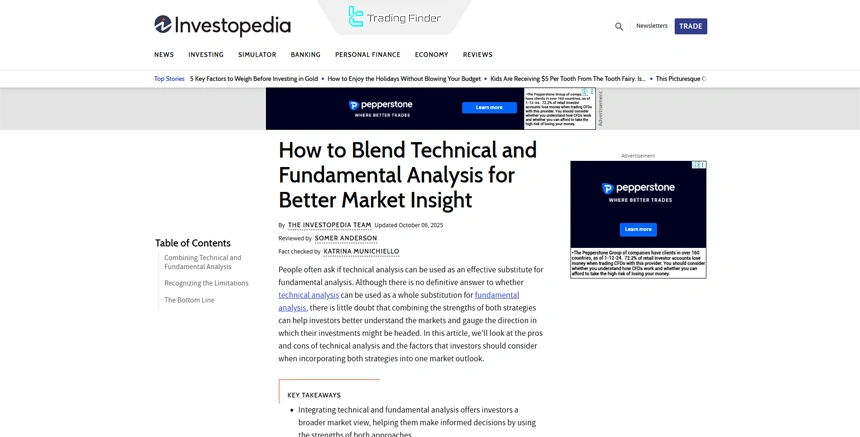
A real-life example of fundamental analysis' impact on financial markets will be evaluated. Below is a chart showing the sharp decline of the EUR/USD pair in October 2024.
The reason for this decline can be traced back to the severe divergence in monetary policies and economic growth between Europe and the United States.
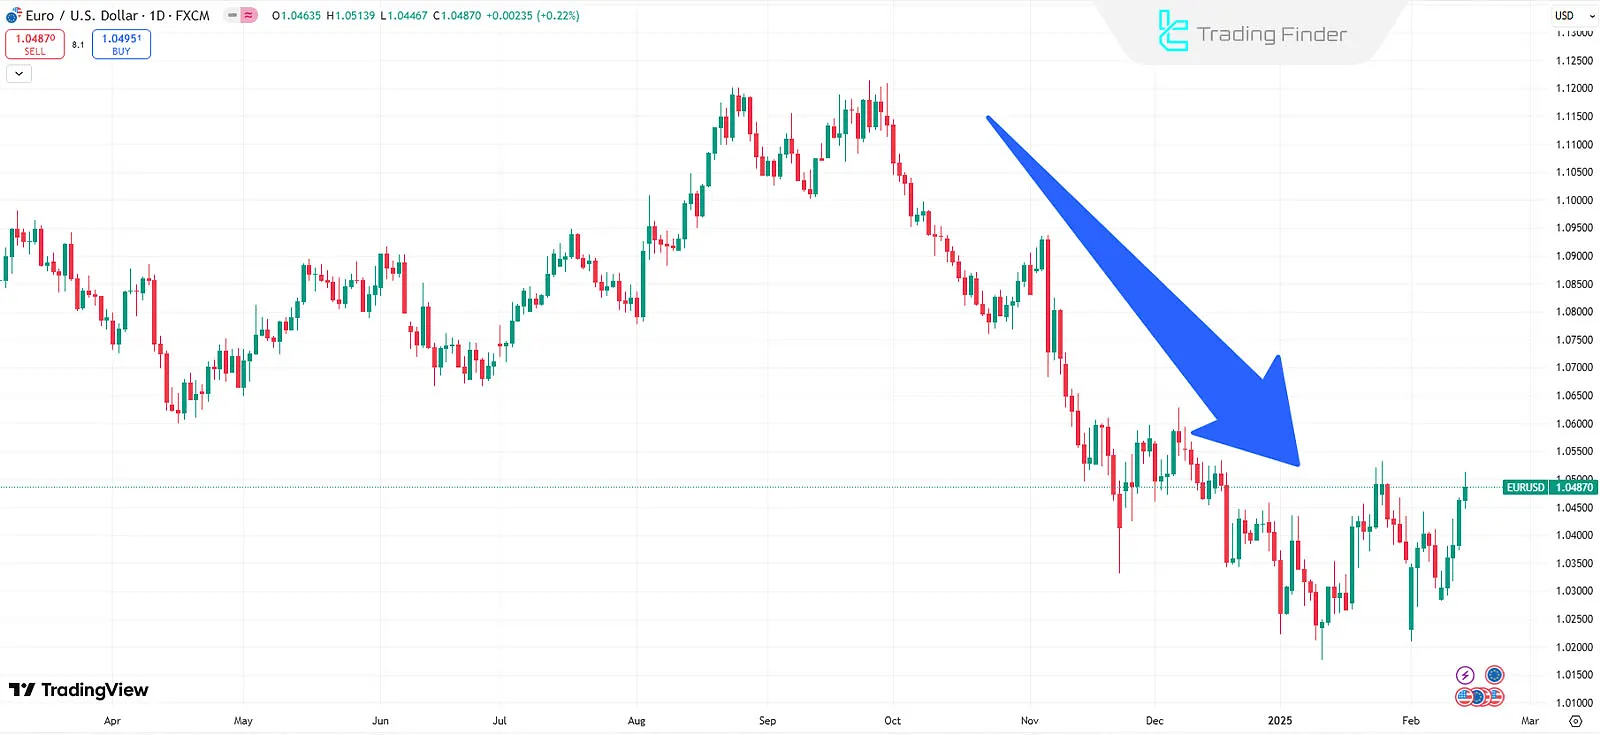
This image shows Germany's weak economic growth from mid-2022 to late 2024. Germany, being the largest economy in Europe, significantly influences the euro.
In response to weakening economic growth in Europe, the European Central Bank (ECB) reduced interest rates by 150 basis points (1.5%) from a peak of 4.5%.
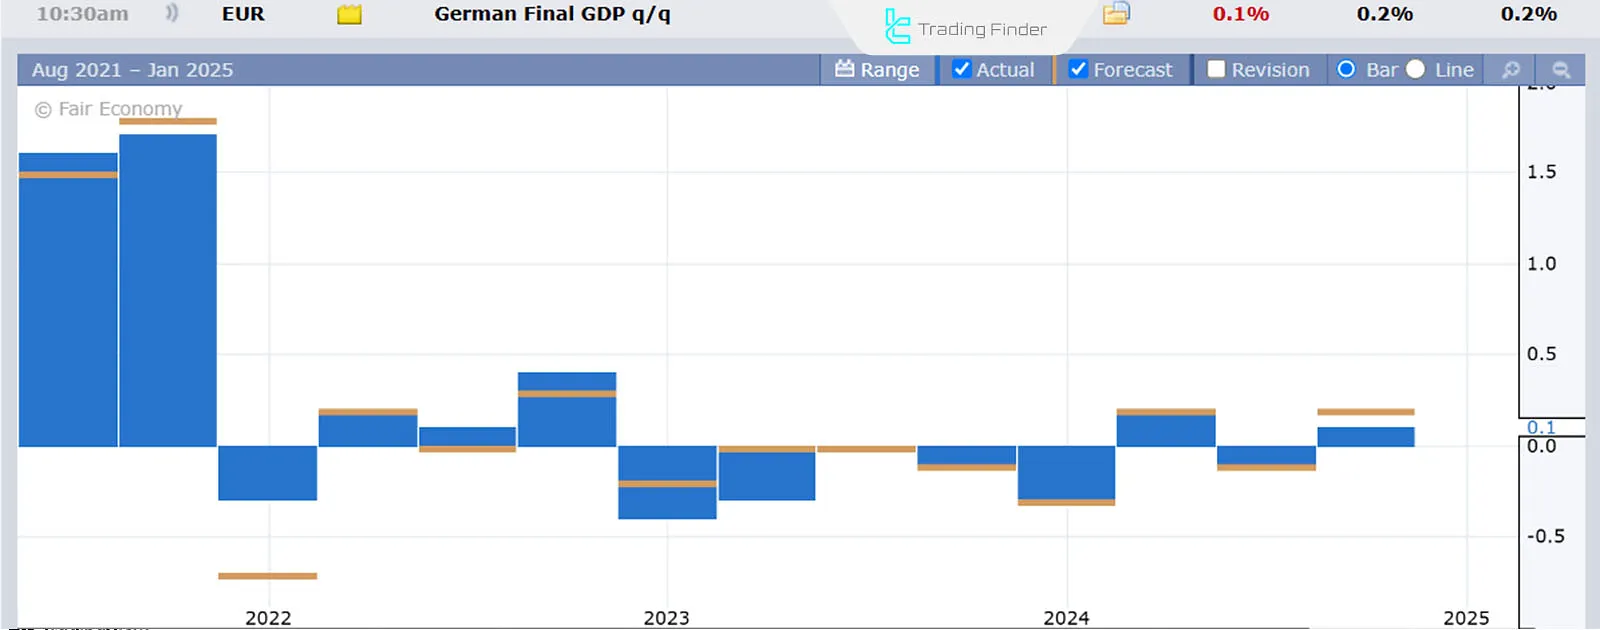
In contrast, the U.S. economic data showed strong growth, resulting in inflationary pressures and slower interest rate cuts.
As a result of the monetary policy gap and economic growth in Europe and America, the dollar has strengthened against the euro in the last three months of 2024.
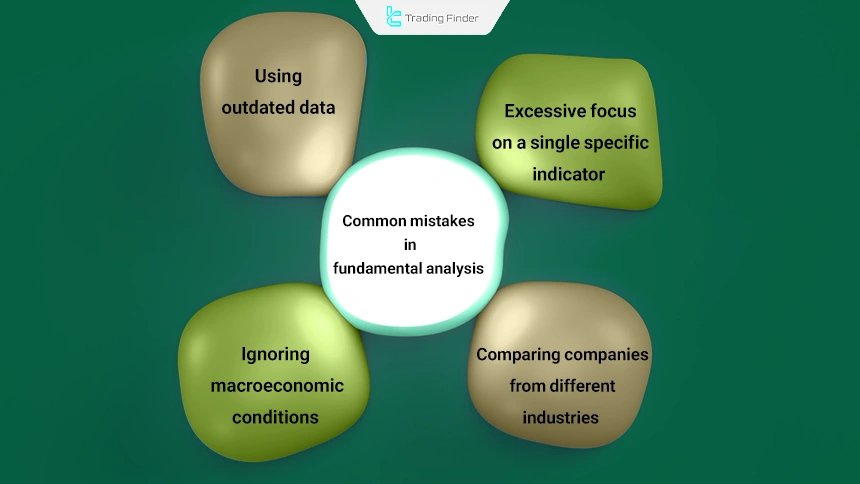
Common Mistakes in Fundamental Analysis
Emotional entry after news releases, impulsive reactions to news, and incorrect comparisons between dissimilar companies, among other factors, can seriously undermine the credibility of intrinsic value assessment.
Below are some other common errors in fundamental analysis:
- Excessive focus on a single specific indicator
- Using outdated data
- Ignoring macroeconomic conditions
- Comparing companies from different industries
Conclusion
Fundamental analysis is a method used in financial markets to predict price trends by evaluating fundamental factors such as economic reports, central bank meetings, and financial news.
The data analyzed in fundamental analysis is mainly applied to predict mid-term and long-term trends, making it particularly suitable for long-term investors and swing traders.


