


Futures contracts are tools for trading and speculation or risk hedging; futures contracts allow retail traders and large companies to manage the risk of price increases or decreases by fixing prices in the future. Additionally, futures contract data is used to predict market sentiment or trends in financial markets.
In practice, futures not only provide risk hedging but also offer a platform for professional speculation, and their high trading volume delivers valuable information about the behavior of major market participants.
Analyzing variables such as open interest, trading volume, and changes in positions in the futures market can lead to a better understanding of capital flow and the probable direction of price movement.
Introduction to Futures Contracts and the Futures Market
The futures market is a market in which futures contracts are traded (futures contracts for buying and selling assets such as commodities, currency pairs, stocks, or indices).
The structure of the futures market enables the use of leverage, two-sided trading, and risk transfer; therefore, it plays an important role in price discovery and increasing the liquidity of financial markets.
What is a Futures Contract?
A futures contract is an agreement between a buyer and a seller to trade a specific asset at a predetermined price on a maturity date; entering into this contract involves costs such as initial margin, transaction fees, and maintenance margin:
- Initial Margin: The initial margin, paid as collateral to enter the contract, is typically 2% to 10% of the contract value and is refunded upon sale or maturity;
- Transaction Commission: The broker's fee for executing the contract, may be fixed or vary based on transaction volume;
- Maintenance Margin: This amount must be maintained in the account to keep the contract open and is usually less than the initial margin;
Futures contracts are used for risk management, hedging, and speculation (trading).
What is the Futures Trading Market?
In the futures trading market, futures contracts are traded; since there is no obligation to hold the contract until maturity, the trader can sell the contract before the maturity date in the futures market; in this case, the trader's profit or loss will be equal to the change in the contract's value.
This flexible structure has turned the futures market into one of the primary platforms for volatility trading and risk management in financial markets.
The ability to engage in two-sided trading, use leverage, and benefit from high liquidity allows traders to extract numerous trading opportunities even from short-term price movements.
Example of Futures Trading
A futures contract for trading 100 barrels of oil at a price of $50 is valued at $5,000. If the oil price rises to $60, the contract's value increases to $6,000. In this situation, if the trader sells the contract, they will gain a profit of $1,000 (the difference in contract value).
This example shows that profit and loss in the futures market are calculated based on the difference between the entry and exit prices, not actual ownership of the asset, and if the price moves against the prediction, losses increase proportionally.
For this reason, using a stop loss, applying risk management, and selecting an appropriate position size are critically important in futures contracts.
Difference Between Futures Contracts and Futures Trading
A futures contract is an agreement between a buyer and a seller to trade an asset at a specific date at a predetermined price. However, in "futures trading", futures contracts are traded.
Simply put, a futures contract itself is the financial instrument, whereas futures trading refers to the process of buying and selling this instrument in the market.
Traders can generate profit or loss by speculating on changes in contract prices without holding the contract until maturity, a feature that makes futures a dynamic market well suited for active traders.
For a more precise understanding of how the futures market operates, the educational video published on the Harvest Public Media channel on YouTube can be used.
Features and Benefits of the Futures Market
Hedging (risk management), the use of leverage, two-way trading, and diverse markets are attractive features of the futures market.
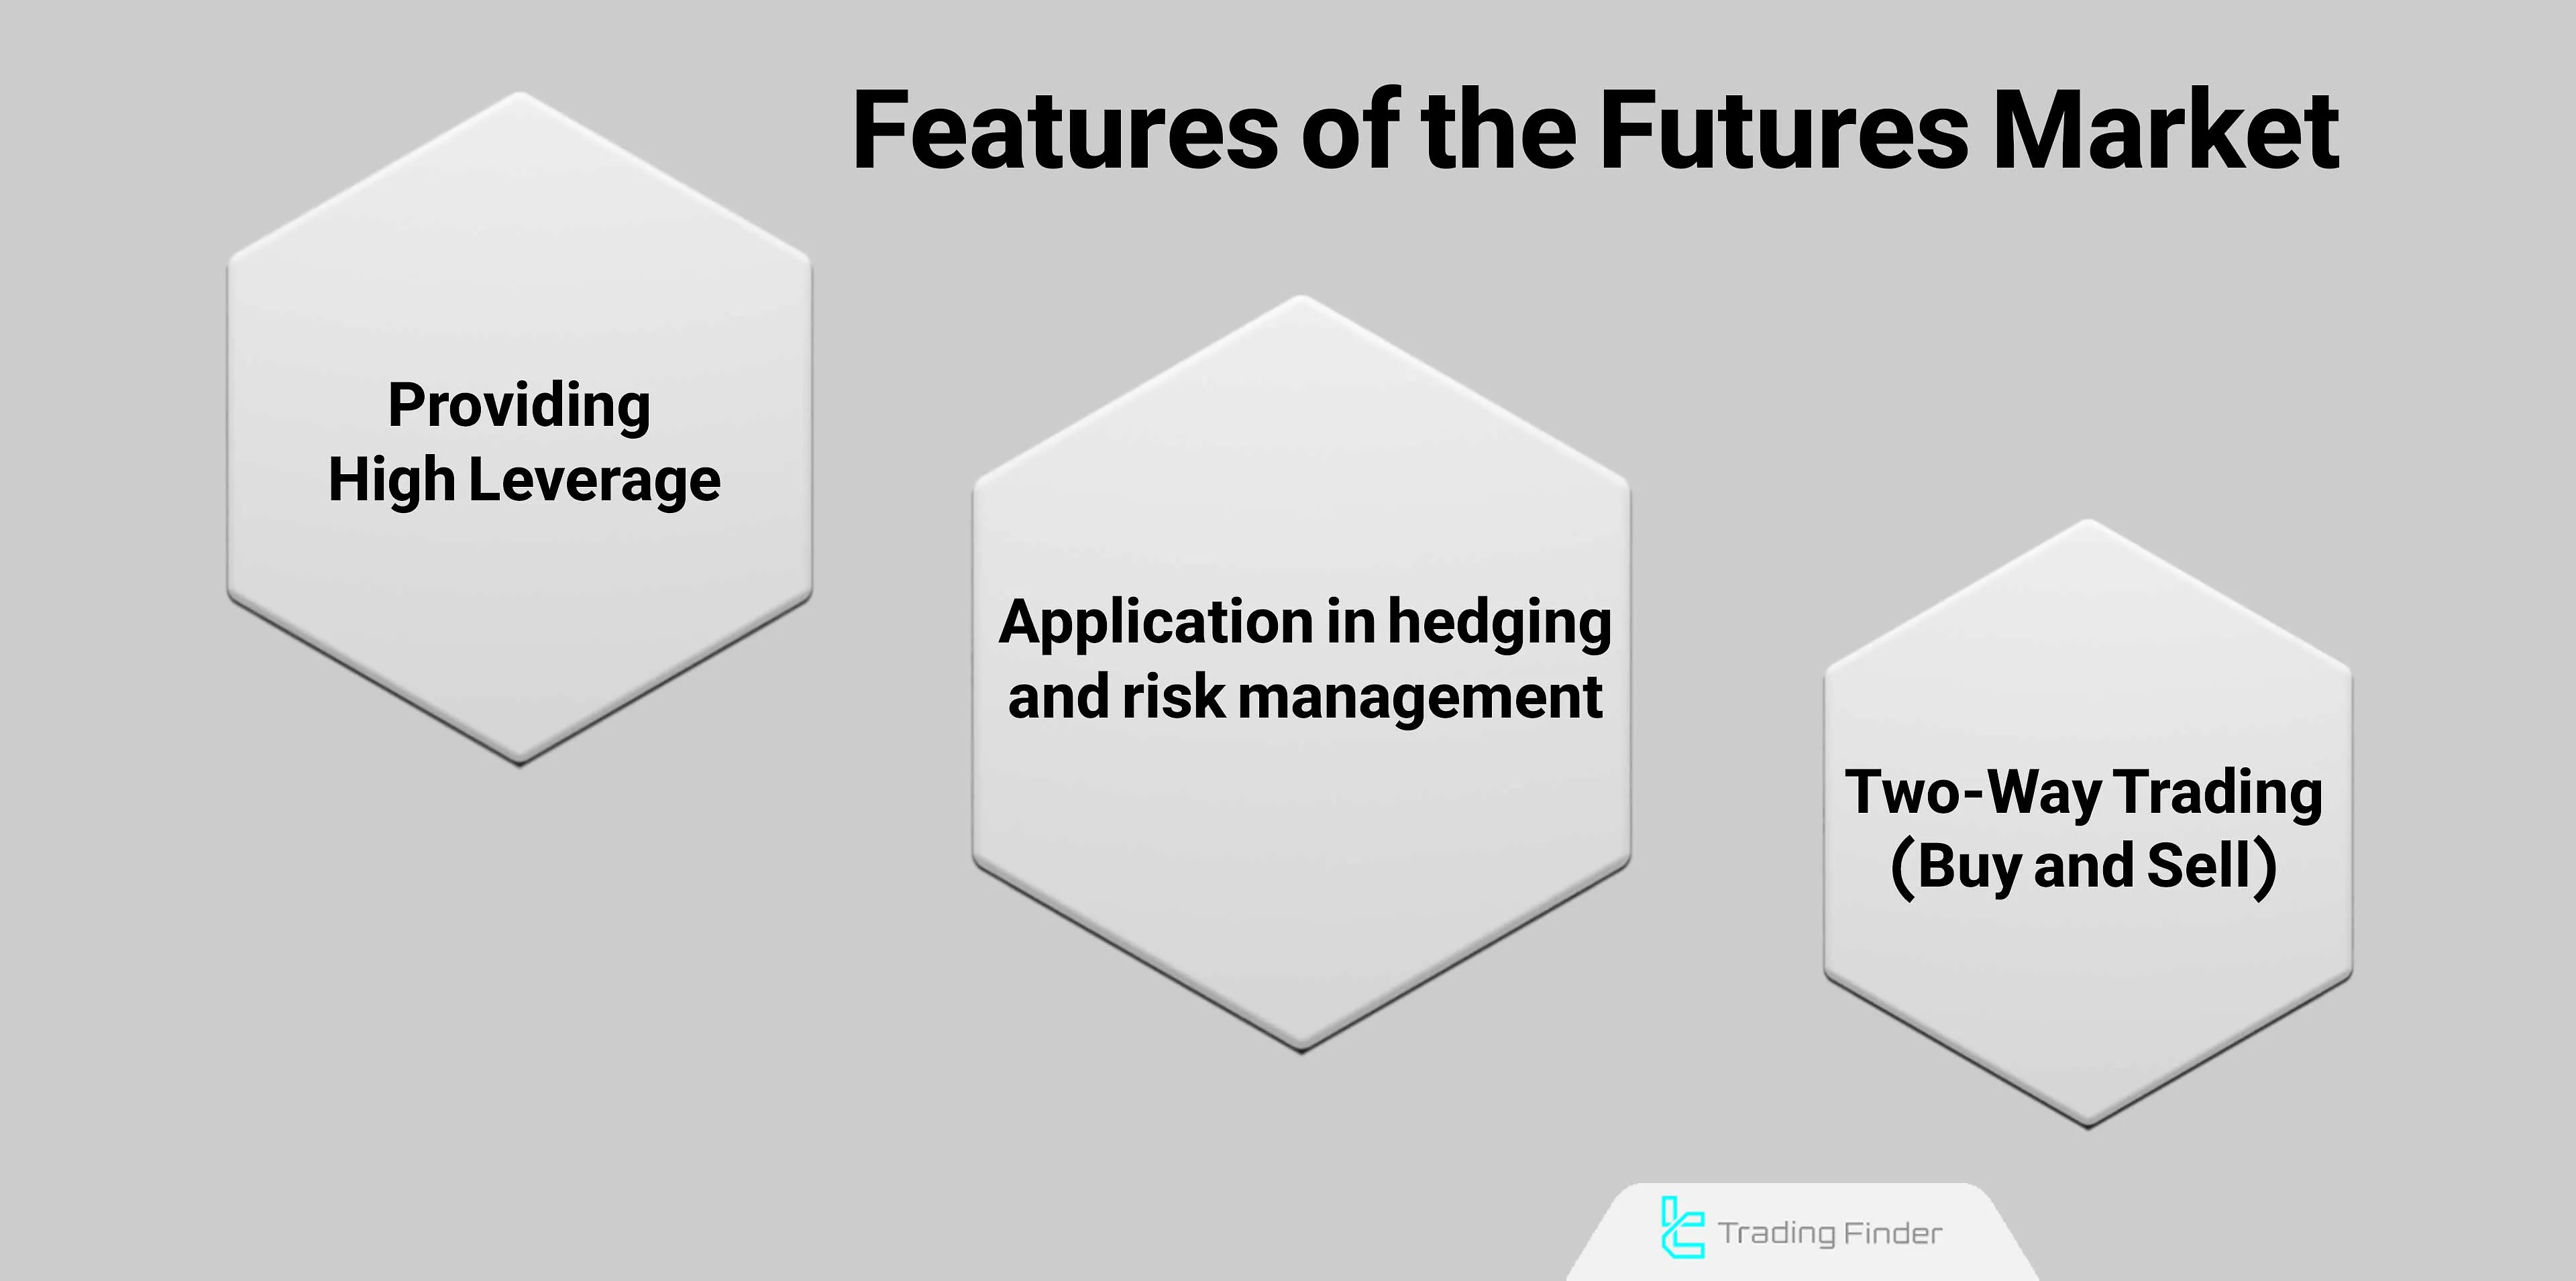
Features of the futures market:
- Use in Hedging and Risk Control: Risk control is a key feature of the futures market, allowing producers to lock in prices for selling products or buying raw materials to avoid price fluctuations;
- High Leverage: In futures trading, traders can use leverage to gain more funds;
- Two-Way Trading: Futures trading also allows selling; for instance, an oil company can agree to sell its product on a specific date at a predetermined price.
Which Markets Offer Futures Trading?
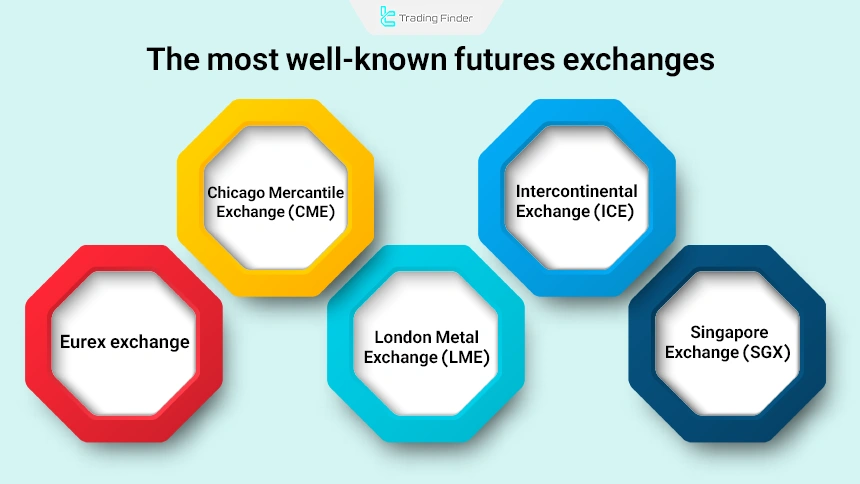
Futures trading takes place in regulated exchanges, and centrally; approved stock exchanges are responsible for regulating and supervising trading. The most famous futures trading exchanges:
- Chicago Mercantile Exchange (CME): This exchange is located in the United States and has a large volume of trading and liquidity; in CME, futures contracts for commodities, currency pairs, stocks, interest rates, and energy products are traded;
- Intercontinental Exchange (ICE): An international market known for agricultural product futures;
- Eurex: The futures market for European stock indices and interest rates;
- London Metal Exchange (LME): The global market for metal futures;
- Singapore Exchange (SGX): The futures market for Asian indices located in Singapore; interest rate, commodity, and metal contracts are also traded on the Singapore International Exchange.
Application of Futures Contracts in Hedging and Risk Management
Futures contracts are widely used in hedging and risk control due to their feature of fixing prices at a specific future date.
For example, a producer has a specific prediction about the increase in oil prices in the next three months; in such a situation, this producer can hedge against the risk (risk of price increase) by entering into a futures contract to buy oil at the current price with a maturity of three months.
At maturity, if the price of oil increases, they profit, and if it decreases, they lose; because the execution of the contract at maturity is mandatory.
Difference Between Futures Contracts and Options
The most important difference between futures contracts and options is whether the trade is mandatory or optional at maturity. Key differences between futures and options:
Feature | Futures Contract | Options Contract |
Risk | High (depending on price fluctuations) | Lower, limited to premium cost |
Execution at Maturity | Mandatory | Optional |
Upfront Payment | Initial margin (usually lower than premium cost) | Premium cost (usually higher than initial margin) |
Trading Volume | Usually higher | Usually lower |
Flexibility | Limited | Higher |
The educational article on the difference between futures contracts and options contracts on investopedia.com provides supplementary explanations about differences in risk, contractual obligations, and the application of each instrument in financial markets.
Application of Futures Contracts in Market Analysis
Tracking futures trading data in fundamental analysis has a wide range of applications in predicting market expectations for interest rates and commodity prices.
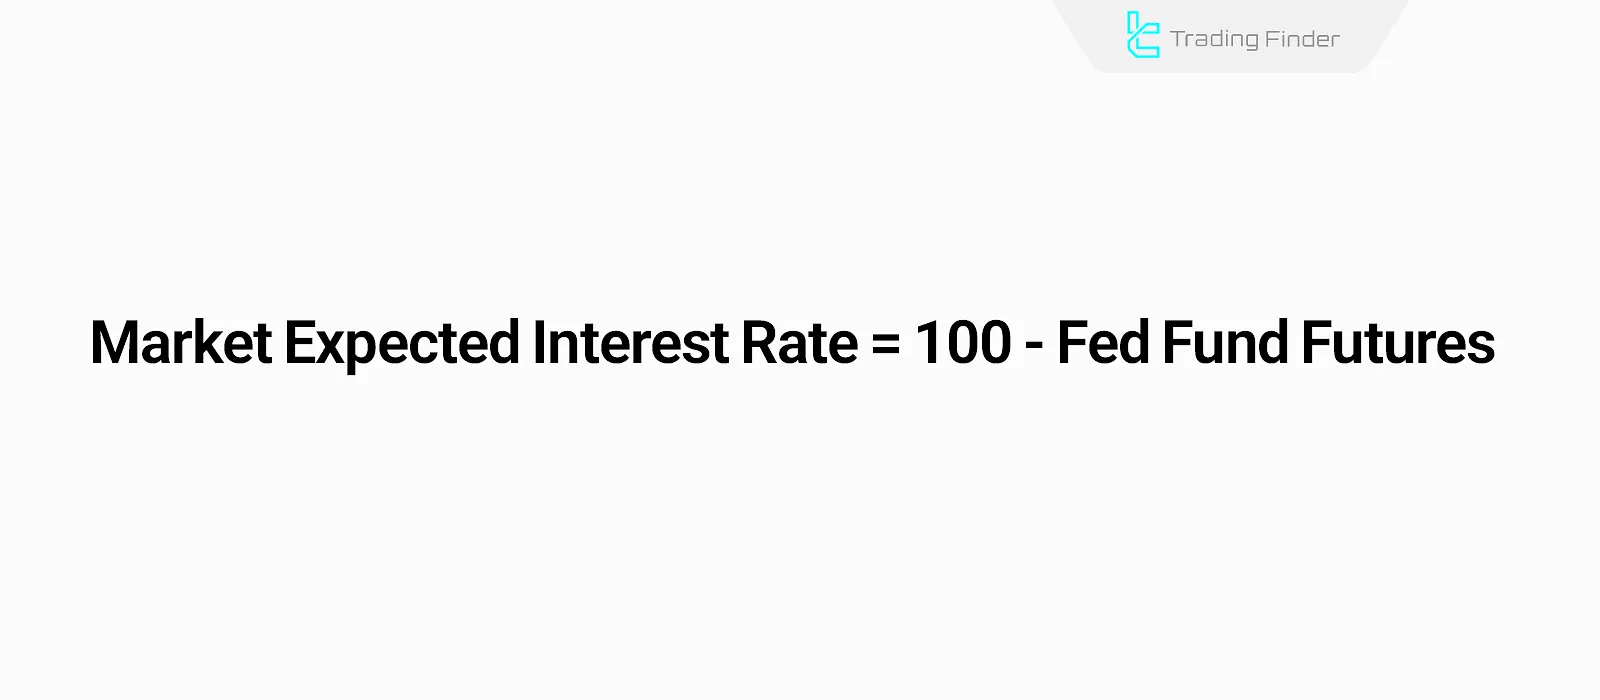
Predicting Interest Rates Based on Futures Contracts
For example, expectations for changes in US interest rates are published on the CME website and are derived from Federal Reserve interest rate futures contract data. The market's expected interest rate is calculated using the following formula:
Identifying Supply and Demand Levels Using Futures Data
Futures market data can be used to predict supply anddemand levels, as at maturity, the product or asset in question is traded at the predetermined price.
If there is a large volume of contracts at a specific price level at maturity, it can be concluded that there is a significant amount of supply or demand at that level.
For this reason, analyzing the distribution of contract volumes across different maturities can identify levels at which major market participants have the greatest price commitments.
These levels typically act as market reaction zones, and combining them with technical analysis or price action increases the accuracy of identifying support levels, resistance levels, and price targets.
Supply and Demand Zones Indicator in MetaTrader
The Supply and Demand Zones indicator is considered one of the advanced analytical tools on the MetaTrader platform, which automatically identifies key supply and demand zones on the chart by focusing on price behavior.
By analyzing historical market data, this indicator determines areas where liquidity accumulation has occurred and where the probability of meaningful price reactions increases.
Within the structure of this MetaTrader indicator, support (Demand) and resistance (Supply) zones are displayed as colored bands. These levels remain on the chart until price reacts to them or their liquidity is absorbed.
One of the key advantages of Supply and Demand Zones is the differentiation between touched and untouched zones; since zones that have not yet been tested usually carry higher validity for trading decisions.
This indicator falls into the categories of MetaTrader support and resistance indicators as well as reversal indicators and is designed for traders with an intermediate skill level.
Multi-timeframe analysis capability allows traders to examine market structure across different timeframes and gain deeper insight into the overall price trend. In terms of target markets, this tool performs effectively in Forex, cryptocurrency, stocks, and the forward market.
In bullish market conditions, when price approaches a demand zone, the formation of bullish reversal candlestick patterns such as a Bullish Engulfing or a bullish Doji can signal continuation of the upward move and present suitable Buy opportunities.
YouTube:
Conversely, in a bearish trend, price reactions to a supply zone accompanied by candlesticks such as a bearish Doji strengthen the probability of price reversal and Sell opportunities.
The settings panel of the Supply and Demand Zones indicator enables full customization of support and resistance zone display, management of level overlaps, separation of market cycles, and modification of colors for touched or untouched zones.
This flexibility turns the indicator into a powerful tool for accurately determining Entry and Exit points.
Overall, the Supply and Demand Zones indicator in MetaTrader is considered an effective analytical solution for identifying market structure, detecting reversal zones, and optimizing trading decisions in Day Trading styles and professional technical analysis.
Futures in the Cryptocurrency Market
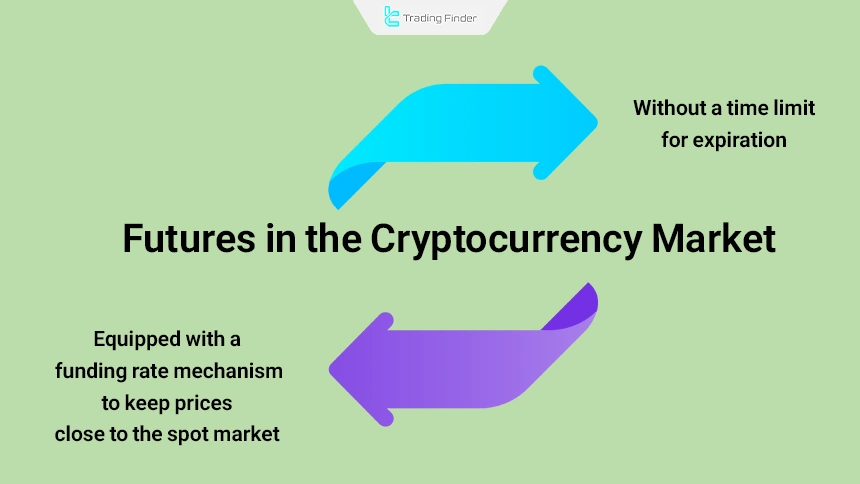
In the cryptocurrency market, futures contracts allow traders to open positions on the rise or fall of prices of cryptocurrencies such as Bitcoin and Ethereum without actual ownership of the asset.
Unlike traditional futures with a fixed expiration date, many crypto futures contracts are offered as perpetual futures and have no time limit for expiration. These contracts use a funding rate mechanism to keep trading prices close to the spot market.
What is the Funding Rate in Crypto Futures and Why is it Important?
The funding rate is a mechanism used in perpetual futures contracts to keep the contract price close to the spot market price. In this system, long and short traders pay each other at specified intervals (usually every 8 hours).
If the funding rate is positive, long traders pay short traders; if it is negative, the opposite occurs. The funding rate can be an indicator of market sentiment.
Very high positive rates usually indicate overbought conditions and excessive market optimism, while negative rates can signal selling pressure or fear.
Accordingly, crypto futures are more suitable for short-term trading and volatility-based strategies, and their function focuses more on active trading than on physical asset risk hedging.
However, the funding rate should be analyzed alongside other indicators such as open interest, volume, and market structure, and it should not be used as a standalone basis for decision-making.
Difference Between Futures and Spot
In the spot market, the trader buys or sells the asset physically and becomes its owner. Profit or loss is derived solely from price changes, and the use of leverage is either unavailable or very limited.
In contrast, futures trading is contract-based and does not transfer actual asset ownership. Traders can profit from both price increases (long) and price decreases (short) and can use leverage to increase position size.
For this reason, spot trading is more suitable for long-term and lower-risk investors, while futures are more commonly used by professional and short-term traders.
The table below provides a detailed comparison between futures and spot trading:
Feature | Spot trading | Futures trading |
Asset ownership | Actual ownership of the asset | No asset ownership, price-based trading |
Settlement time | Immediate settlement | Time-based or perpetual settlement |
Leverage | No leverage | Multi-level trading leverage |
Trading risk | Lower risk | High risk |
Liquidation | No liquidation | Possibility of liquidation |
Profit in bearish markets | No direct profit | Ability to profit from price declines (short) |
Complexity level | Simple structure | Complex structure |
Capital management | No margin | Requires margin management |
Primary use | Investment and holding | Volatility trading and risk hedging |
Costs | Lower fees | Fees and funding fee |
Difference Between Futures and Margin Trading
In margin trading, the trader uses their capital as collateral to borrow funds from the exchange and trades the actual asset in the spot market.
Profit and loss are directly tied to the asset balance, risk management is simpler, and liquidation usually occurs at a greater distance from the entry price.
In futures trading, the trader enters a derivative contract and does not own the asset. Profit and loss are calculated based on the price difference of the contract. Due to the use of high leverage and the mark price mechanism, small price fluctuations can lead to rapid liquidation.
Comparison table of futures and margin:
Feature | Margin | Futures |
Market type | Spot with borrowing | Derivative (contract) |
Asset ownership | Yes | No |
Leverage | Low (2× to 5×) | High (up to 50× or more) |
Profit/loss calculation | Based on the actual asset | Based on the contract |
Risk | Moderate | Very high |
Liquidation speed | Lower | Higher |
Suitable for | Conservative traders | Professional traders |
Common Mistakes in Futures Trading
Many new traders in the futures or derivatives market face significant losses due to a lack of deep understanding of the risks and mechanisms of this market.
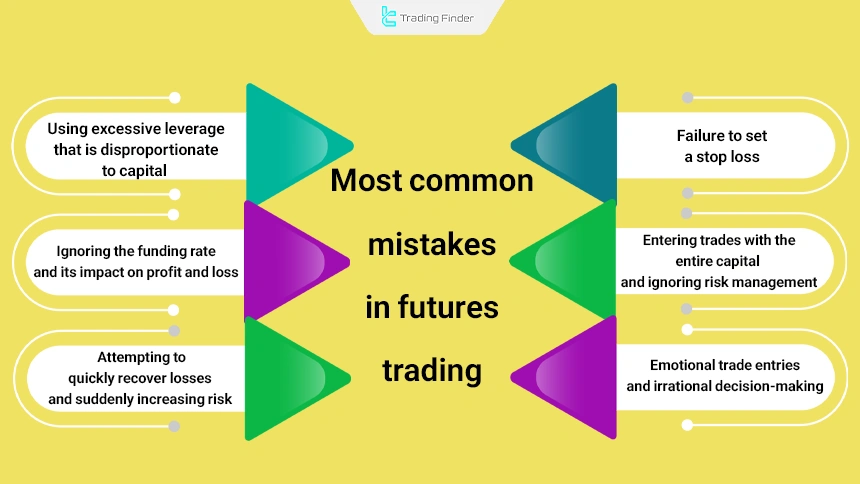
Repeated mistakes in this space quickly put the trading structure at risk and expose capital to uncontrollable risks. The most common mistakes are categorized as follows:
- Using excessive leverage that is disproportionate to account size;
- Failing to set a stop loss for trading positions;
- Entering trades with the entire capital and ignoring risk management principles;
- Ignoring the funding rate and its impact on profit and loss;
- Emotional trade entries and irrational decision-making;
- Attempting to quickly recover losses and suddenly increasing risk.
Mastery of capital management and a precise understanding of the structure and mechanisms of futures trading form the foundation of sustainable activity in this market and pave the way for professional participation.
Conclusion
The futures market offers an attractive platform for trading or hedging with features such as price fixing in the future and the ability to sell before maturity. Additionally, analysts identify key supply and demand levels by tracking the maturity of options and futures contracts.
These data show the price levels at which large capital positions are most sensitive and where market reactions are expected.
For this reason, combining futures market analysis with price action or smart money concepts can provide traders with a more precise view of price behavior and key market decision zones.


