


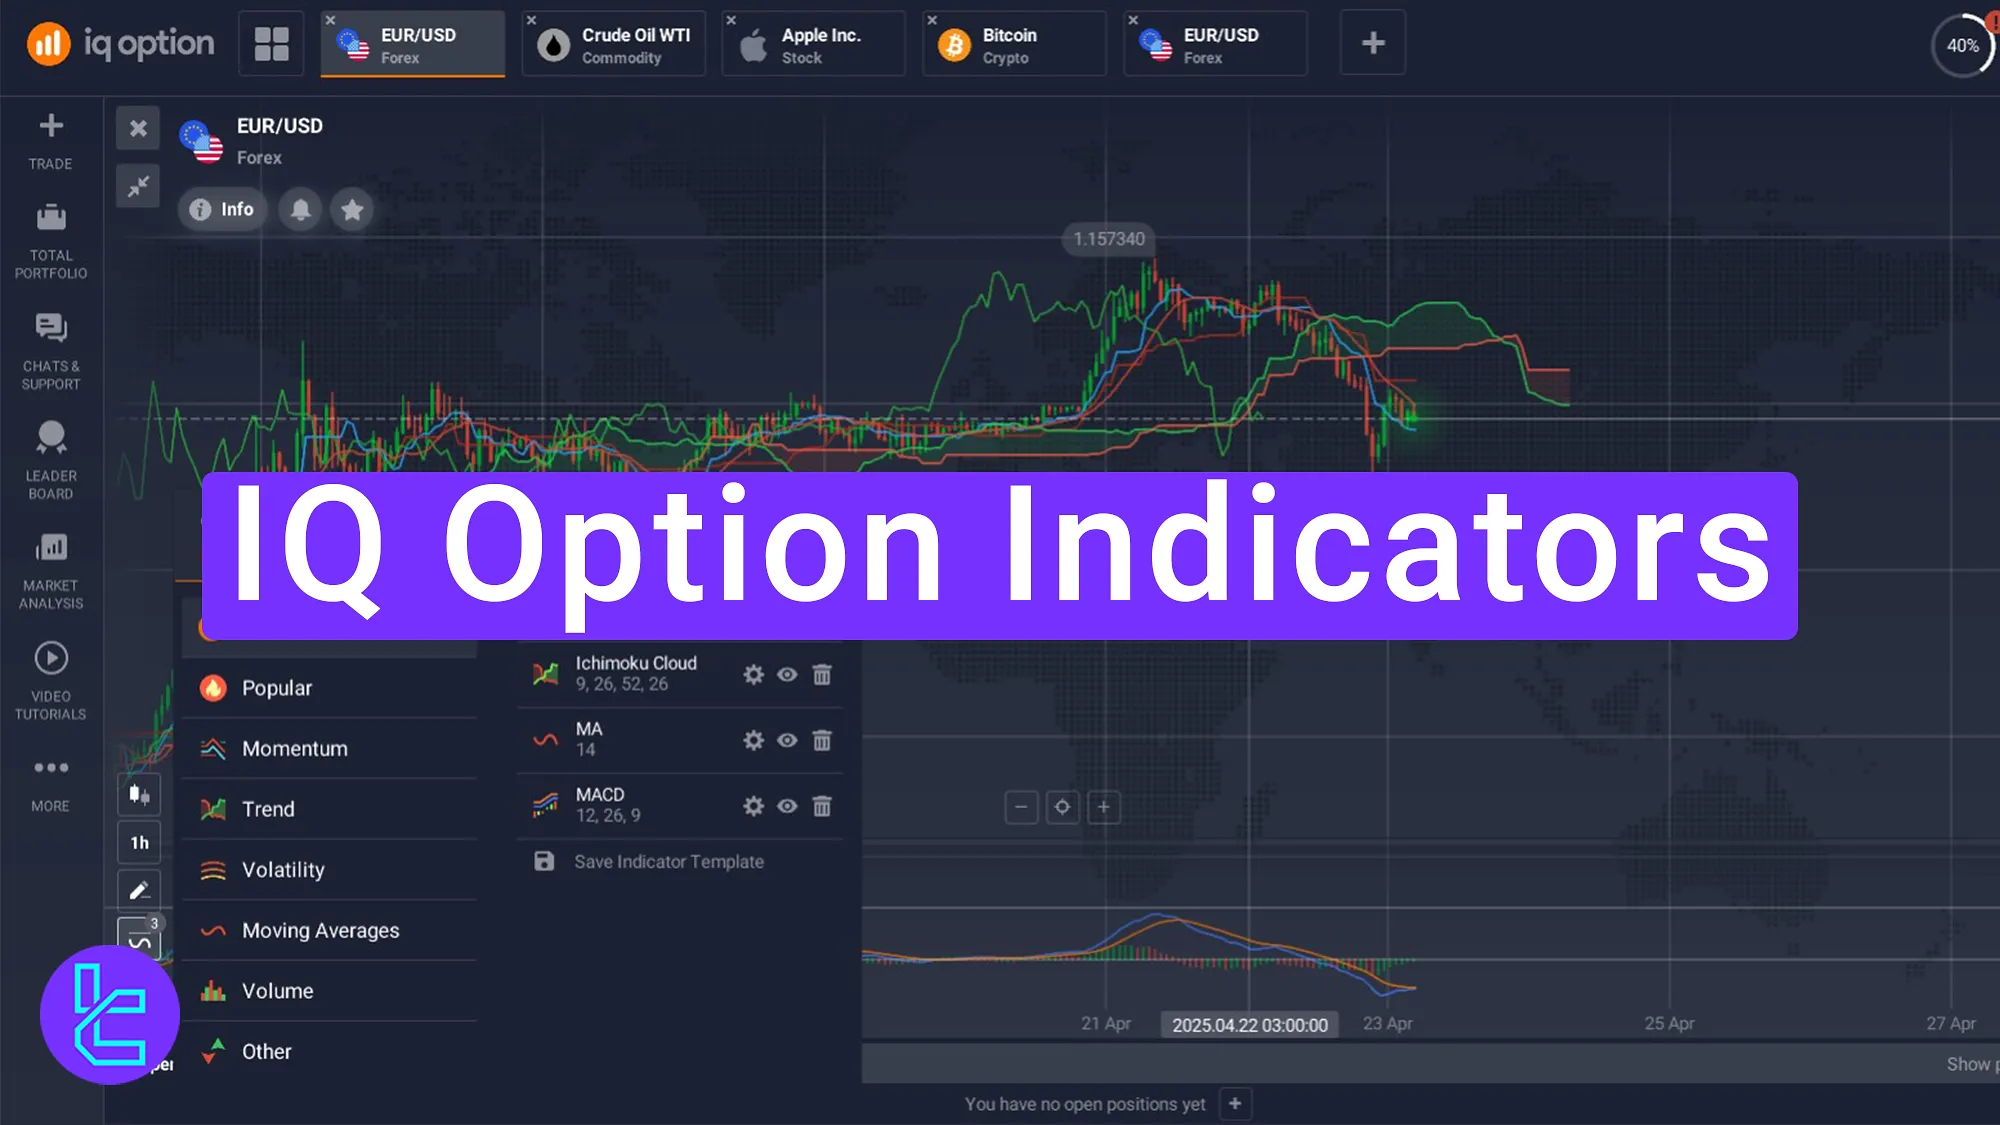
IQ Option indicators, such as MACD, RSI, Bollinger Bands, and Ichimoku Cloud, allow traders to perform technical analysis on various instruments. The 5 main indicator categories in IQ Option are momentum, volume, volatility, trend, and moving averages.
The IQ Option technical analysis tool encourages traders to combine multiple indicators for confirmation, adjust settings to fit different timeframes, and practice first on demo accounts.
Users are also advised to pair indicators with fundamental analysis and price action.
Beat IQ Option Indicators
IQ Option indicators provide traders with a robust set of technical analysis tools. Here are seven of the best indicators available on the IQ Option platform:
- Moving Average (MA)
- Bollinger Bands
- Fibonacci Retracement
- Stochastic Oscillator
- Ichimoku Cloud
- Moving Average Convergence Divergence (MACD)
- Relative Strength Index (RSI)
These indicators are all available on the IQ Option trading platform, and you can learn to access them by watching the YouTube video below.
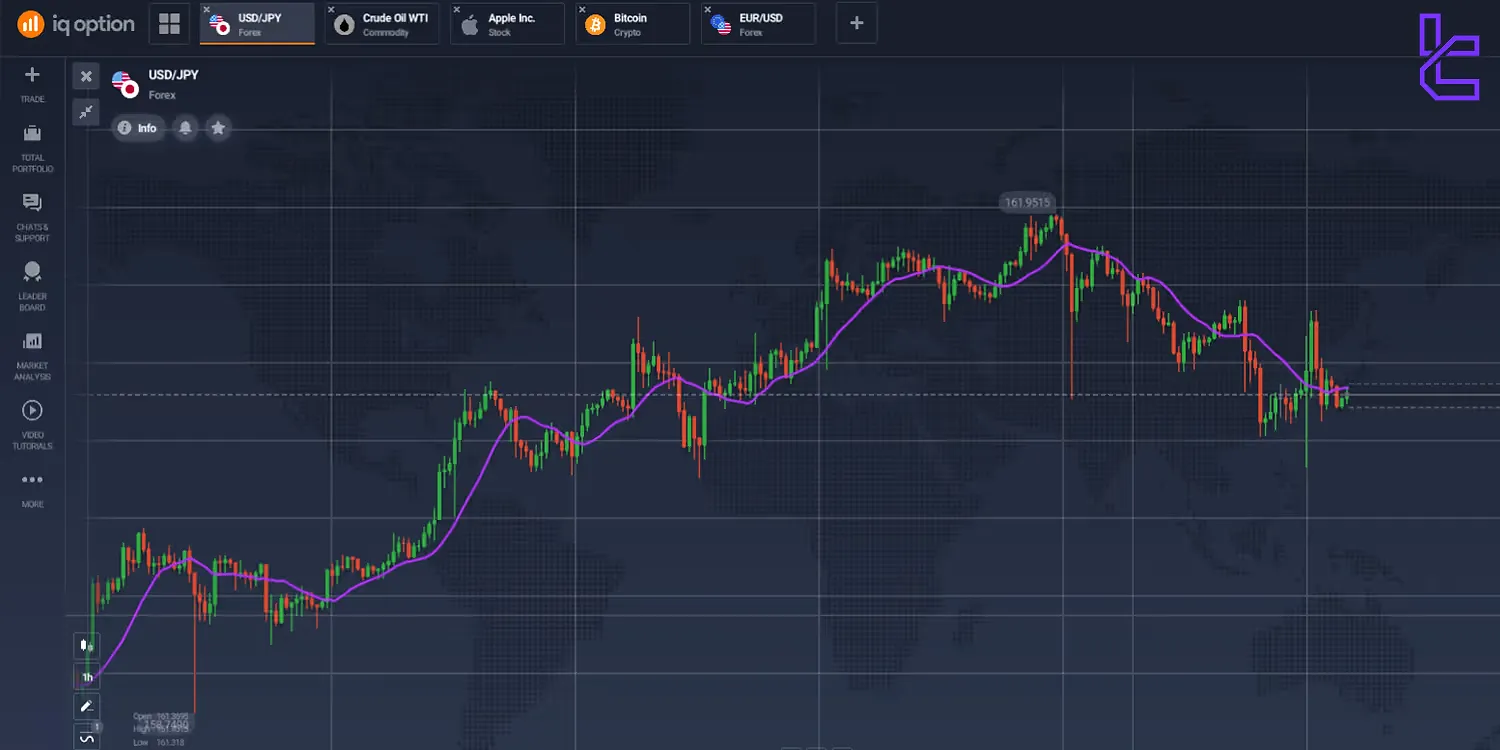
Moving Average
The Moving Average (MA) is a versatile and widely used indicator on the IQ Option platform. It helps traders identify the overall trend direction by smoothing out price fluctuations over a specified period.
Key features of the Moving Average indicator:
- Calculates the average price over a set number of periods;
- Available as Simple Moving Average (SMA) and Exponential Moving Average (EMA);
- Helps determine support and resistance levels;
- Useful for identifying trend reversals and potential entry/exit points;
- Traders often use multiple MAs with different time periods to generate buy and sell signals when the shorter-term MA crosses the longer-term MA.
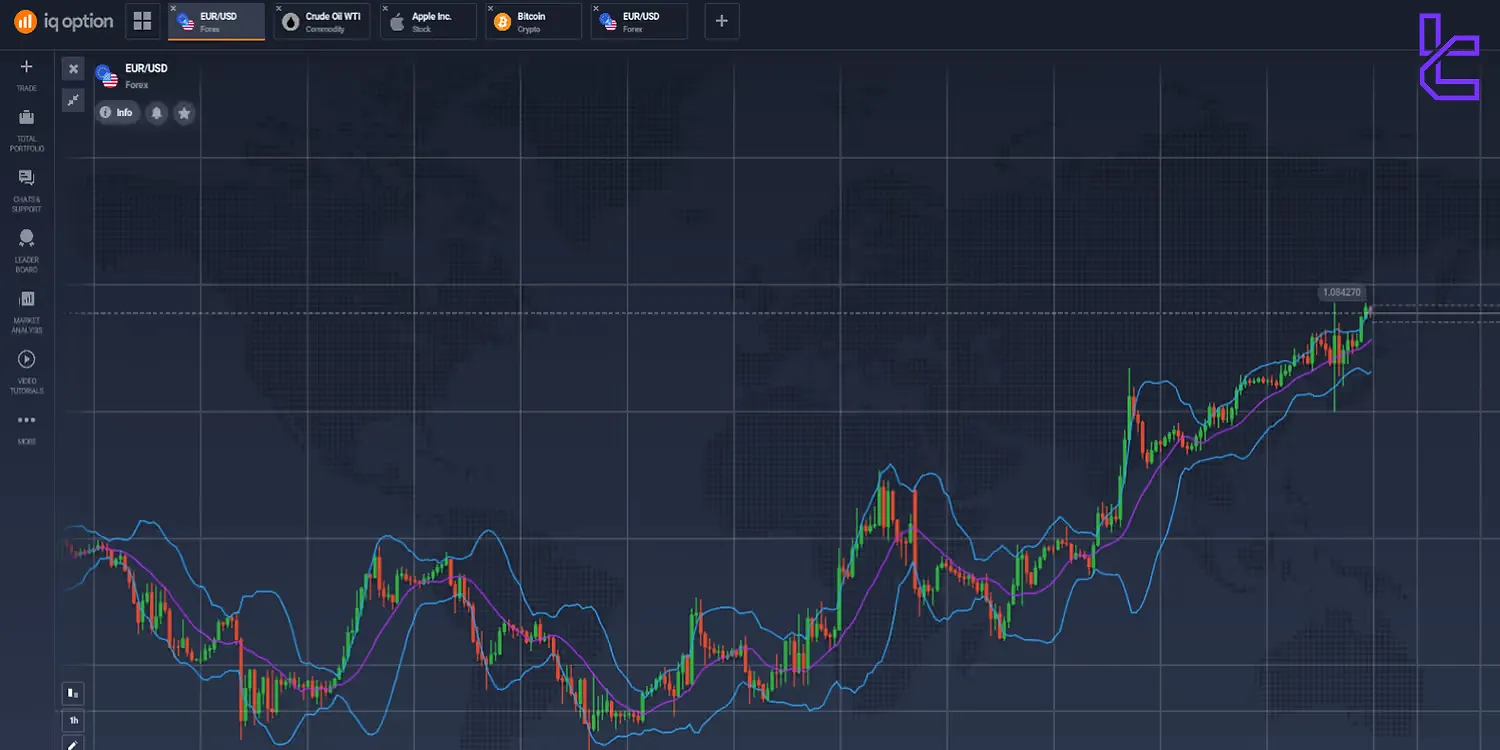
Bollinger Bands
Bollinger Bands are a popular volatility indicator on IQ Option platform, consisting of three lines: a simple moving average (middle band) and two standard deviation lines (upper and lower bands).
Key features of the Bollinger Bands indicator:
- Measures market volatility and potential overbought/oversold conditions;
- Helps identify potential breakouts and trend reversals;
- Can be used to set dynamic support and resistance levels;
- Useful for both trending and ranging markets.
Traders often look for price touches on the upper or lower bands as potential reversal signals, especially when combined with other indicators.
Fibonacci Retracement
TheFibonacci Retracement tool is an indicator based on the mathematical sequence discovered by Leonardo Fibonacci. It's used to identify potential support and resistance levels during price retracements.
Key features of the Fibonacci Retracement indicator:
- Helps identify potential reversal points in a trend;
- Commonly used levels include 23.6%, 38.2%, 50%, 61.8%, and 78.6%;
- Can be applied to any timeframe;
- Useful for setting entry points, stop-loss levels, and profit targets.
Traders often use Fibonacci levels in conjunction with other indicators to confirm potential reversal points and improve trade timing.
Stochastic Oscillator
Another popular indicator on IQ Option is the Stochastic Oscillator momentum indicator that compares a closing price of an asset to its price range over a specific period. It's particularly useful for identifying overbought and oversold conditions.
Key features of the Stochastic Oscillator:
- Oscillates between 0 and 100;
- Overbought conditions are typically above 80, and oversold conditions are below 20;
- Consists of two lines: %K (fast) and %D (slow);
- Can generate buy/sell signals when the two lines cross.
Traders often use the Stochastic Oscillator in combination with trend-following indicators to confirm potential entry and exit points.
Ichimoku Cloud
The Ichimoku Cloud, also known as Ichimoku Kinko Hyo, is one of the most powerful indicators on IQ Option that provides information about trend, momentum, and support and resistance levels all in one chart.
Key features of the Ichimoku Cloud indicator:
- Consists of five lines: Tenkan-sen, Kijun-sen, Senkou Span A, Senkou Span B, and Chikou Span;
- The "cloud" is formed between Senkou Span A and B;
- Provides multiple signals, including trend direction, strength, and potential reversals;
- Useful for identifying support and resistance levels.
Traders often use the Ichimoku Cloud to get a comprehensive view of market conditions and confirm signals from other indicators.

MACD Indicator
The Moving Average Convergence Divergence (MACD) is a trend-following momentum indicator, another tool in the IQ Option indicators section that shows the relationship between two moving averages of an asset's price.
Key features of the MACD indicator:
- Consists of the MACD line, signal line, and histogram;
- Helps identify trend direction and strength;
- Can generate buy/sell signals when the MACD line crosses the signal line;
- Useful for spotting potential trend reversals.
RSI Indicator on IQ Option Platform
The last indicator on IQ option that we are going to talk about taday is Relative Strength Index (RSI). RSI is a momentum oscillator that measures the speed and change of price movements. It's particularly useful for identifying overbought and oversold conditions.
Key features of the RSI indicator:
- Oscillates between 0 and 100;
- Typically, readings above 70 indicate overbought conditions, while readings below 30 suggest oversold conditions;
- Can help identify potential trend reversals;
- Useful for spotting bullish and bearish divergences.
Traders often use the RSI in conjunction with trend-following indicators to confirm potential entry and exit points.
IQ Option Indicators Comparison Table
Here's a comparison table of the seven indicators discussed:
Indicator | Type | Primary Use | Complexity |
Moving Average | Trend | Identify overall trend | Low |
Bollinger Bands | Volatility | Measure market volatility | Medium |
Fibonacci Retracement | Retracement | Identify potential reversal levels | Medium |
Stochastic Oscillator | Momentum | | Identify overbought/oversold conditions | Medium |
Ichimoku Cloud | Multi-faceted | Comprehensive market analysis | High |
MACD | Trend/Momentum | Identify trend direction and strength | Medium |
RSI | Momentum | Identify overbought/oversold conditions | Low |
Tips on Using Indicators in IQ Option Platform
To make the most of the indicators on IQ Option:
- Don't rely on a single indicator; use a combination for confirmation;
- Understand each indicator's strengths and limitations;
- Adjust indicator settings to match your trading timeframe;
- Practice using indicators on a demo account before trading real money;
- Use indicators in conjunction with fundamental analysis and price action;
- Regularly review and refine your indicator strategy.
Remember, indicators are tools to assist your decision-making, not to replace it. Always use proper risk management techniques in conjunction with your technical analysis.
Can I Use These Indicators in Other Binary Brokers?
Yes, most of the best binary option brokers offers these basic Indicators and oscillator for traders in their trading platforms.
Broker | IQ Option Broker | |||
Simple Moving Average | Yes | Yes | Yes | Yes |
Bollinger Bands | Yes | Yes | Yes | Yes |
Relative Strength Index Indicator | Yes | Yes | Yes | Yes |
Moving Average Convergence Divergence | Yes | Yes | Yes | Yes |
Stochastic | Yes | Yes | Yes | Yes |
Parabolic SAR | Yes | Yes | Yes | Yes |
Commodity Channel Index | Yes | Yes | Yes | Yes |
Average True Range | Yes | Yes | Yes | Yes |
Average Directional Index | Yes | Yes | Yes | Yes |
Ichimoku Cloud Indicator | Yes | Yes | Yes | Yes |
Writer's Opinion and Conclusion
IQ Option offers over 20 indicators. However, MA, Bollinger Bands, Stochastic, MACD, and RSI are among the best indicators and oscillators available in this broker.
If you want to learn more about this broker, check the IQ Option tutorial page or watch the videos on the TradingFinder YouTube channel.


