


Key Points:
- WTI Crude Oil, after completing the liquidity collection scenario, has entered a key decision zone and is on the verge of breaking above the H1 projection block range;
- In crude oil, a close above 64.17 can activate the continuation of the move toward the 65.42 range; in this area, the absorption of Buy Side Liquidity and a potential bearish reaction are likely;
- If momentum weakens within the CP or Order Block range, the short-term bearish reversal scenario will be activated;
- Natural Gas USD on the 4-hour timeframe, after collecting Buy Side Liquidity, has faced selling pressure and the dominant bearish structure remains intact;
- The 2.886 level is considered an important bearish target, and an increase in short contracts in the futures market can strengthen the downside acceleration;
- A short-term correction toward the Breaker Pattern range is possible, but as long as the structure does not change, the bearish scenario has the upper hand;
- The closure of the Chinese market and reduced liquidity depth may result in more aggressive movements and deceptive volatility;
- Rising US 10-year Treasury yields and easing geopolitical tensions may reinforce downward pressure on the energy market.
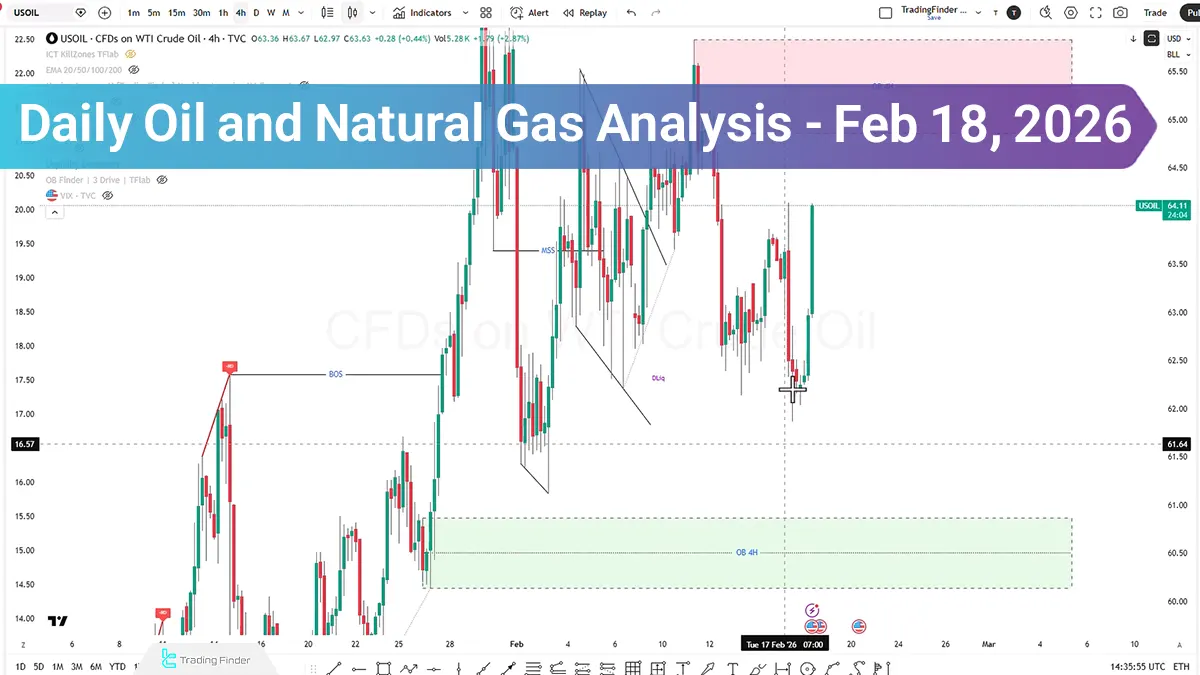
On February 18, 2026, energy market trading, US light crude oil, after completing the liquidity collection scenario, reacted to the projected targets and is now approaching key decision zones.
Meanwhile, natural gas on the 4-hour timeframe, following selling pressure, has reached a significant technical area, and its behavior around the 2.886 level will determine the continuation of its path. At the same time, geopolitical risks and the closure of the Chinese market as one of the largest oil consumers may intensify volatility.
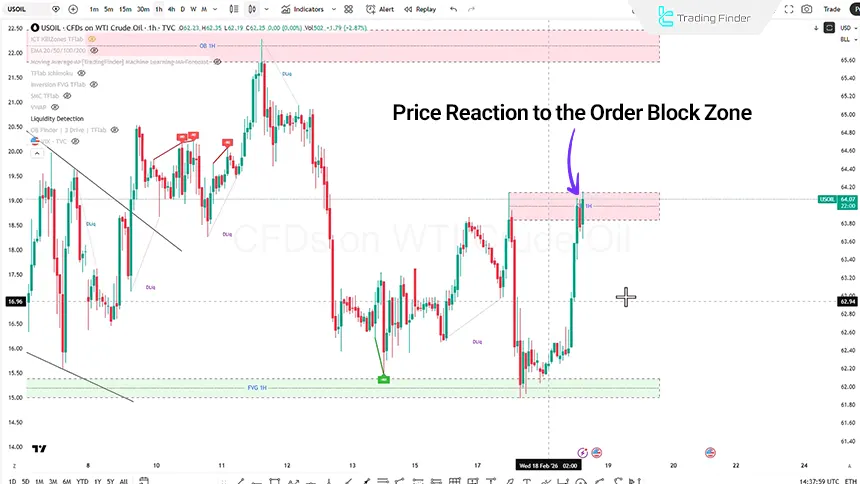
Analysis of US Crude Oil on the 1-Hour Timeframe
On the one-hour timeframe, after breaking the Unicorn range, price was accompanied by a bullish displacement move and is now attempting to break above the one-hour projection block range.
- In case of a candle close above the 64.17 level, there is a possibility of continued bullish movement toward the 65.42 range; this area may serve as a Buy Side Liquidity collection zone;
- If price reaches the CP and Order Block ranges and signs of weakness are observed, the sell scenario may be activated.
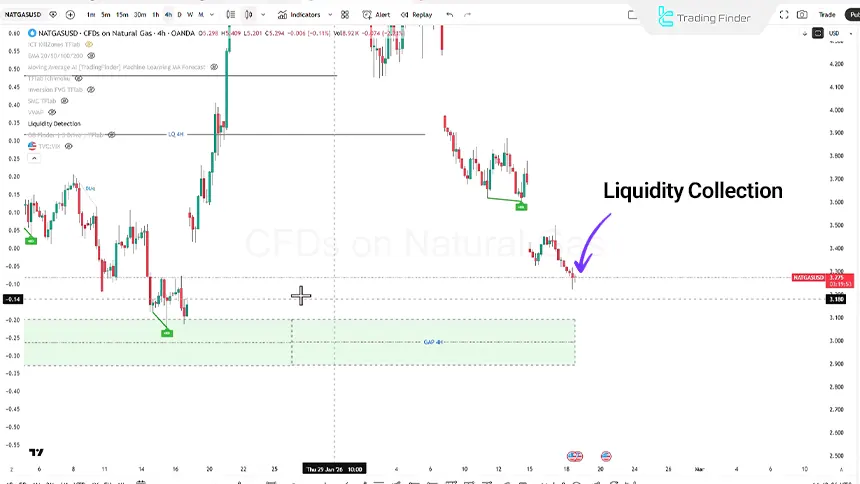
Analysis of US Natural Gas on the 4-Hour Timeframe (H4)
On the 4-hour timeframe, natural gas, after collecting Buy Side Liquidity, faced selling pressure and reacted to a highly significant level. This reaction may merely be a short-term bullish correction until entering the Breaker Block Pattern, Balanced Price Range, followed by a potential continuation of the bearish trend.
- If selling pressure increases in the futures market and short contracts expand, the likelihood of intensifying the bearish trend will rise.
- In this scenario, the 2.886 level can be considered as the next price target.
Fundamental Geopolitical Factors Affecting US Oil and Natural Gas
The closure of the Chinese market, as one of the largest oil importers and consumers, until next Monday may lead to reduced liquidity depth and increased aggressive movements. Under such conditions, volatility will be more influenced by geopolitical risks.
Additionally:
- Reduced tensions in the Middle East;
- A decline in oil pricing;
- And rising US 10-year Treasury yields.
These factors can be considered as confirmations for the continuation of the oil’s bearish trend.
Conclusion
The oil market is currently in a Buy Side Liquidity absorption phase; however, technical signals including divergences and Order Block zones may provide the groundwork for a trend reversal.
Price behavior around the 64.17 and 65.42 levels for light crude and the 2.886 level for natural gas will be decisive. At the same time, geopolitical developments and US Treasury yields play a key role in confirming or weakening bearish scenarios.


