


Key Points:
- Global gold spot on the 4-hour timeframe continues to maintain a bullish bias; however, the reaction to the gap area and the 50% retracement level indicates that the market has entered a momentum evaluation phase;
- On the 1-hour timeframe, the registration of a bullish market structure break followed by bearish Displacement reflects a serious confrontation between buyers and sellers; in case of momentum weakness, a pullback to the Order Block or gap is possible;
- On the 15-minute timeframe, following a bearish Displacement during the Asian session, the market enters a range.
In today’s analysis, the focus of the gold market is on price behavior relative to previous swings and the manner in which the daily candle closes. The dominant scenario is still assessed as bullish, but its validity depends on confirmed closes at key levels.
On lower timeframes, signs of Liquidity Grab and the possibility of a short-term correction are also observed.
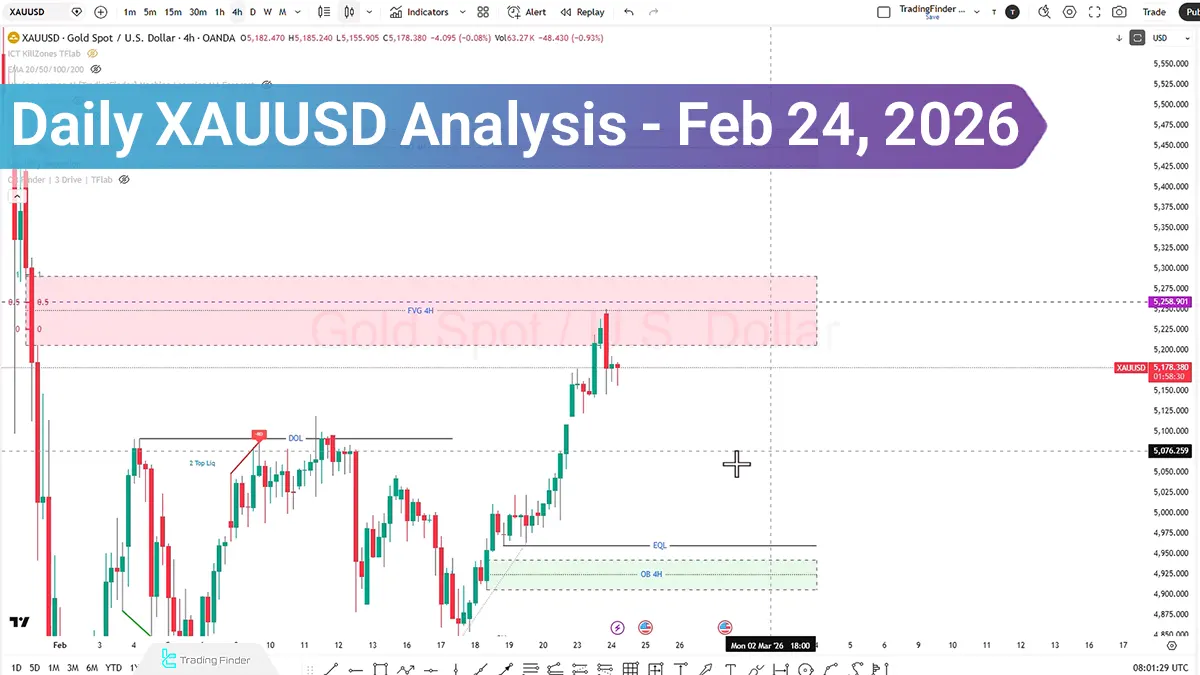
XAUUSD Analysis on the 4-Hour Timeframe (H4)
On the four-hour timeframe, following a bullish Displacement move, price entered the gap area and, after reacting to the 50% level, encountered selling pressure.
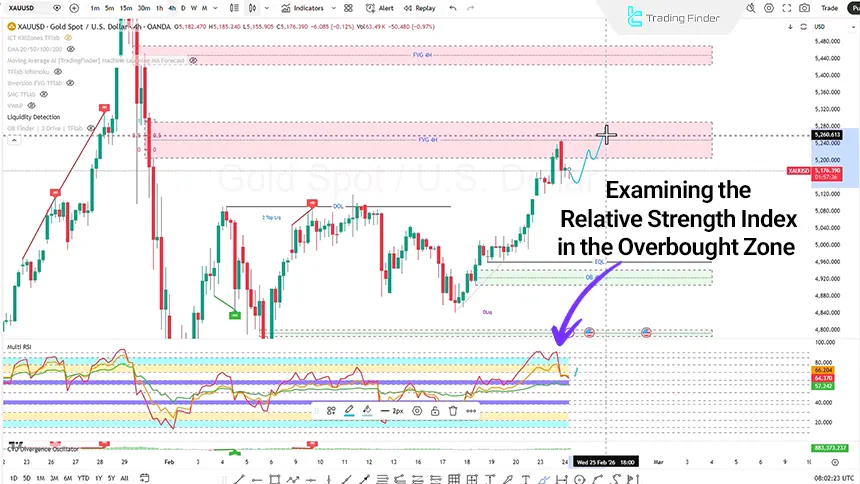
An examination of the Relative Strength Index (RSI) indicator in the form of Multi RSI shows that price has entered a high-potential zone. This condition may lead to two different interpretations:
- If the Multi RSI fails to enter the overbought zone, the likelihood of price entering a corrective phase and engaging in liquidity collection increases;
- If price moves upward again, enters the high-potential zone, and ultimately reaches the overbought level, this behavior could indicate strong momentum.
Entering the overbought zone under these conditions would more likely signal a gradual bullish move.
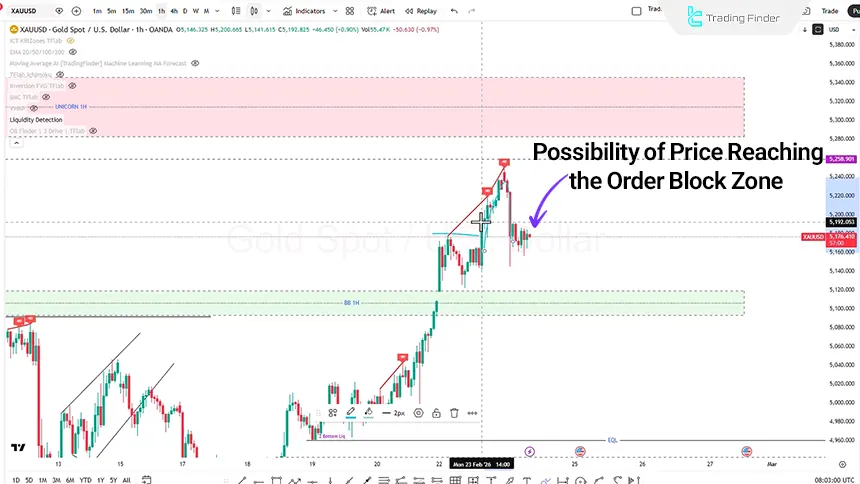
XAUUSD Analysis on the 1-Hour Timeframe (H1)
On the one-hour timeframe, after a period of compression, price moved aggressively upward and registered a market structure break. This move was accompanied by the formation of a gap, but subsequently the CP zone was broken with a bearish Displacement.
If price lacks sufficient momentum to continue the upward move:
- A pullback to the Order Block area or the gap zone is possible;
- If weakness in the bullish trend is observed and a market structure shift occurs, price may move downward to collect sell-side liquidity;
- The formation of a Head and Shoulders pattern or a Quasimodo (QM) pattern is possible, which could signal the end of the bullish trend.
In this scenario, the correction could extend to the Pin Bar candle area at the $540 level and even to the $5000 zone.
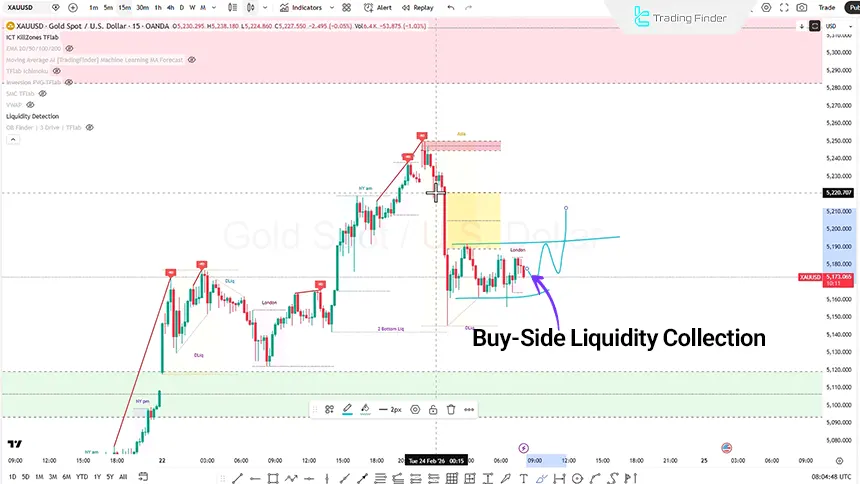
XAUUSD Analysis on the 15-Minute Timeframe (M15)
On the 15-minute timeframe, with the start of the Asian session, gold experienced a bearish Displacement and selling pressure, entering a ranging area. Within this zone:
- After a liquidity collection, there is potential for an upward move and entry into the Fair Value Gap;
- If weakness in the upward movement is identified, the probability of a downward move and sell-side liquidity collection arises;
- If the move is accompanied by strong momentum and full-body candles, it may indicate the continuation of the short-term bullish trend in the market.
Conclusion
The overall structure of gold on higher timeframes remains inclined to the upside, but the validity of this bias depends on confirmed closes at key levels, particularly the $5100 zone.
On lower timeframes, signs of liquidity collection and the possibility of a short-term correction are visible; however, as long as the bullish structure is not meaningfully violated, the market focus remains on bullish trend-continuation scenarios.


