


Key Points:
- Bitcoin entering a contraction phase simultaneously with deleveraging in the derivatives market indicates increasing selling pressure;
- A nearly 15% drop in open interest and the Relative Strength Index positioning in the oversold zone strengthen the likelihood of a continued downtrend;
- The break below the $65,000 level, triggering stop-losses, has confirmed the short-term bearish market structure;
- If negative sentiment persists, the $63,500, $62,000, and $60,000 zones may be considered as liquidity targets.
Following the collection of Sell Side Liquidity, Bitcoin has faced significant selling pressure and, simultaneously with a major liquidation, has entered a contraction phase. Deleveraging in the derivatives market along with declining volatility suggests that the market is awaiting the next catalyst to determine a new structural move.
On-chain Data and Bitcoin Derivatives Market Overview
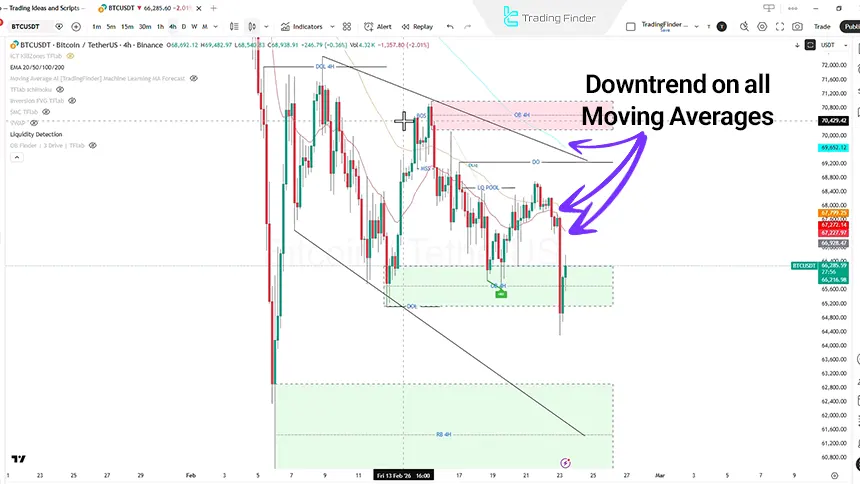
Based on on-chain data, Bitcoin has entered a contraction phase, which may be driven by deleveraging in the derivatives market.
A nearly 17% decline in Moving Averages, alongside reduced trading leverage, indicates a market phase shift from consolidation to selling pressure.
In the derivatives market, open interest has declined by approximately 15%, confirming deleveraging and the exit of high-risk capital from the market. Meanwhile, the Funding Rate remaining in positive territory suggests a reduction in the inflow of new leveraged positions.
Market Volatility and Liquidity Conditions
Market volatility has dropped sharply over the past two days, and this volatility compression typically occurs before an explosive move.
Amid intensified whale selling and rising macroeconomic risks, Bitcoin has moved below the $65,000 level, with this breakdown triggering stop-losses and amplifying selling pressure.
According to the Fear & Greed Index tool, the crypto market is currently positioned within the Extreme Fear zone, reducing investors’ risk appetite.
Additionally, liquidity in the market has declined, with the stablecoin market cap over a 60-day period falling below $3 trillion, levels last observed during the 2022 market bottom.
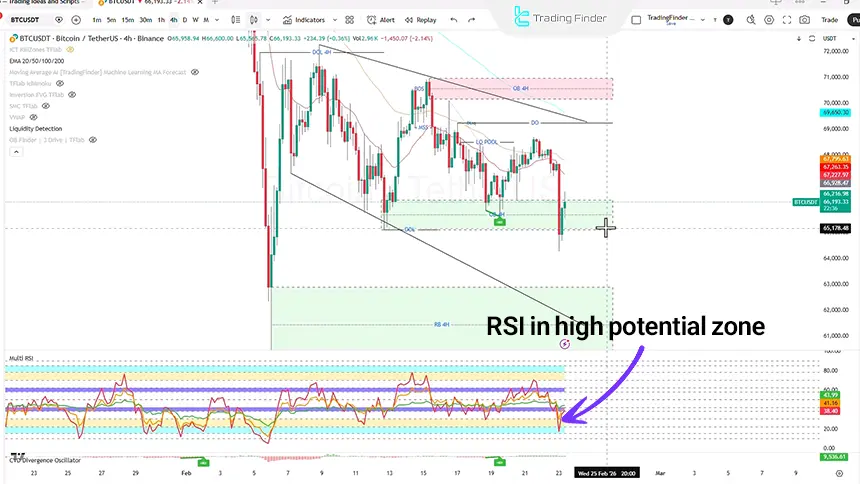
The Relative Strength Index (RSI) has risen from 22.6 to 38.9, indicating a gradual exit from oversold conditions; however, recent selling pressure has pushed the RSI back into the oversold zone, which may signal a continuation of the bearish trend.
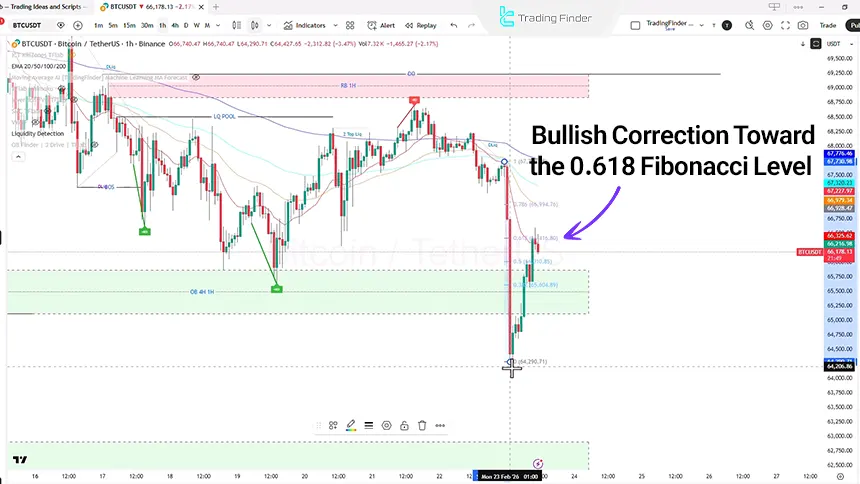
BTC Analysis on the 1-Hour Timeframe
On the 1-hour timeframe, the price decline has been accompanied by bearish momentum, and the current correction has extended only to the 0.618 Fibonacci ratio.
This behavior may indicate the end of the short-term correction and the continuation of the downtrend.
If weakness in the bullish move is identified, entry into a sell position may become feasible, in which case price could target lower liquidity zones.
Conclusion
The current Bitcoin market structure still shows a tendency toward continuation of the downtrend, although deleveraging in the derivatives market may provide room for short-term bullish corrections.
Price reaction to the $67,263 and $60,000 levels, alongside prevailing liquidity conditions, will play a decisive role in determining the next directional move from a momentum perspective.


