


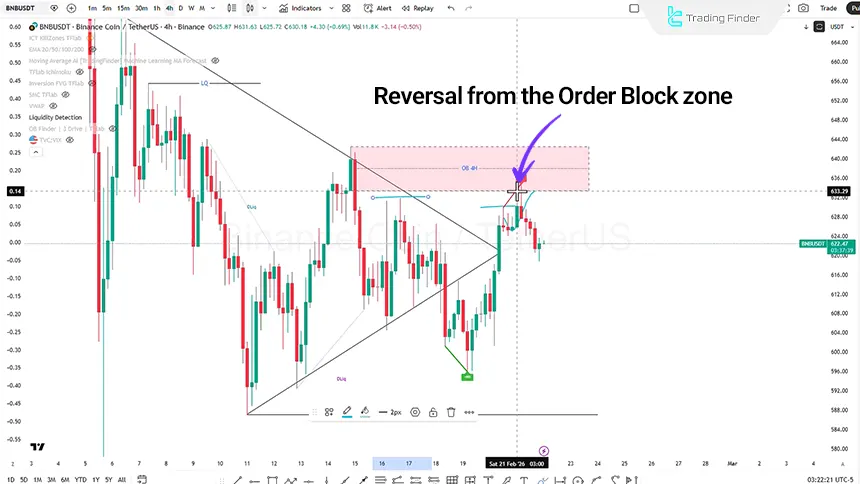
In the four-hour timeframe analysis, Binance Coin, following a bullish move, first gathered buy-side liquidity and then entered the Order Block zone. In this area, it became possible to define a trading position within the Order Block range, such that the trader could place the stop-loss behind the zone and consider a 1:1 or 1:2 risk-to-reward ratio for this setup.
Key Points:
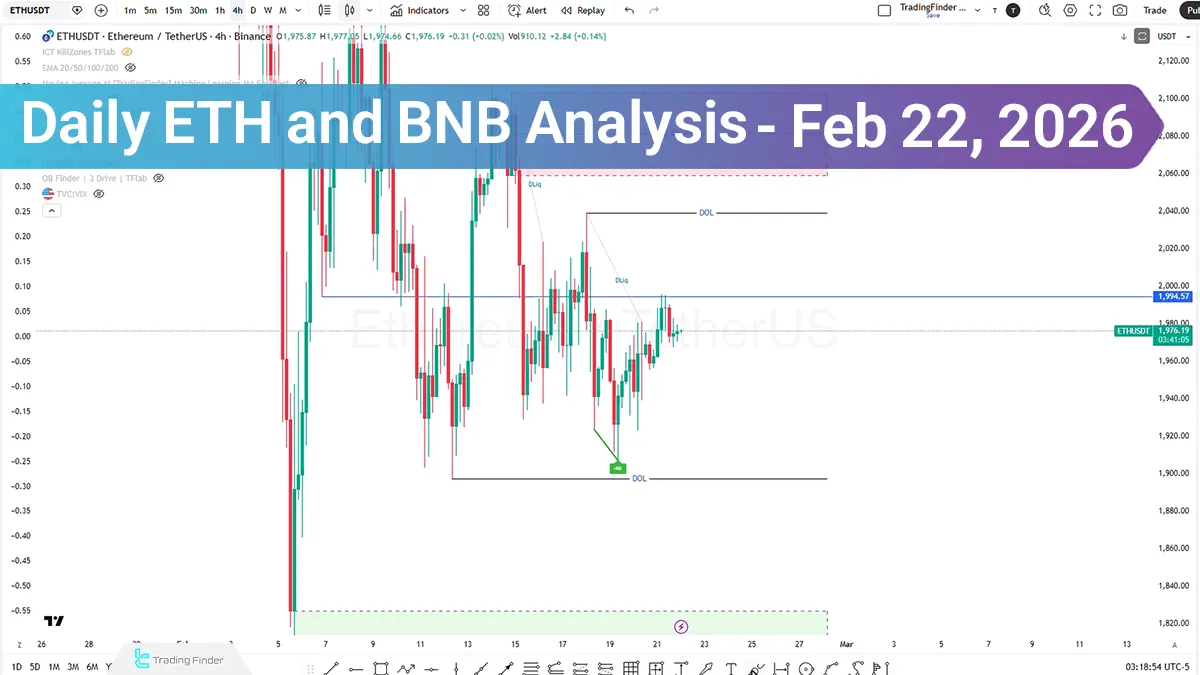
- In ETH, in the event of a lower close and confirmation of a bearish structure, the probability of a move toward sell-side liquidity collection increases; after the formation of a lower low and MSS, a corrective buy scenario can be considered;
- In the case of increased liquidity and a positive bias, the $2038 level is identified as a bullish target; a reaction to the upper Order Block and the formation of a CHoCH can activate a renewed sell scenario;
- On the 1-hour timeframe of BNB, following a range breakout and negative divergence, the liquidity target will be the DOL zone;
- In both assets, the final direction depends on the quality of the close within Order Block zones, the strength of momentum, and price behavior relative to liquidity clusters; risk management in this decision-making phase is of high importance.
On February 22, 2026, both Ethereum and Binance Coin experienced an initial bullish move in line with the previous scenario and collected part of the buy-side liquidity. However, candlestick behavior and price reaction to key areas, including Order Block zones and Draw on Liquidity, indicate that the market has entered a new decision-making phase.
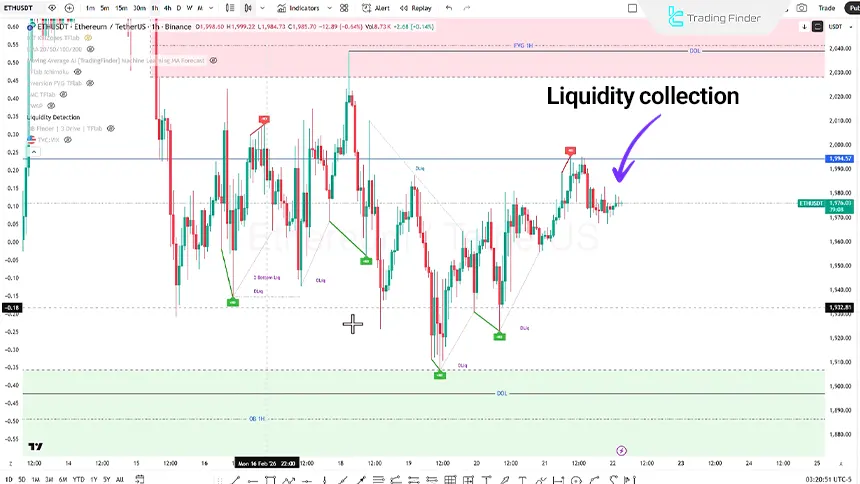
Analysis of ETH on the 1-Hour Timeframe (H1)
On the 1-hour timeframe, the price structure can be examined based on Smart Money concepts and the ICT style. The use of the Liquidity Detection indicator shows that:
- Wherever liquidity has been identified, price has been drawn toward it;
- After liquidity collection, the primary move has continued;
- Currently, sell-side liquidity lies below the price, which can act as a price magnet.
Under these conditions, after the formation of a lower low and identification of a structural shift, it will be possible to consider a Buy position by placing the stop-loss behind the recent swing. The targets of this scenario will be higher levels and buy-side liquidity.
Analysis of Binance Coin on the 4-Hour Timeframe (H4)
Following the price reaction and decline from this zone, the formation of a Pin Bar candlestick on the four-hour structure is observed, indicating a decrease in selling pressure and an increase in market demand. This candlestick behavior may reflect the market’s entry into a short-term bullish corrective phase.
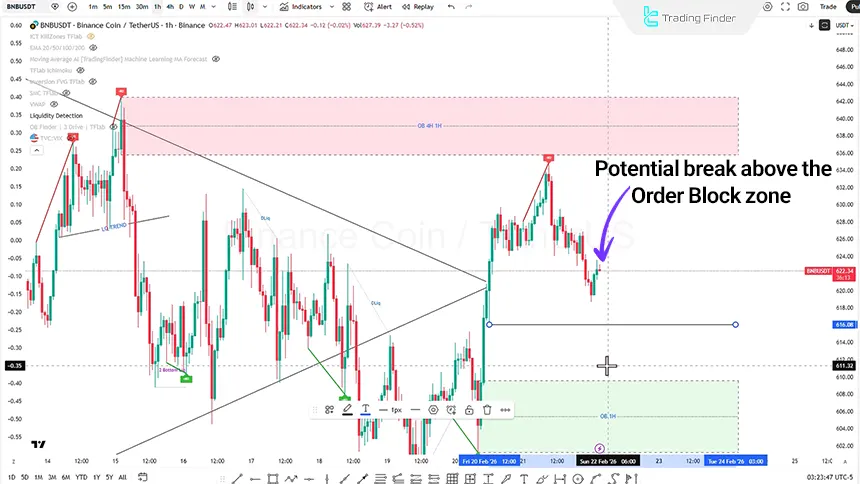
Analysis of BNBUSDT on the 1-Hour Timeframe (H1)
On the 1-hour timeframe, after a range and the formation of liquidity on both sides of the market, price breaks out upward with an Aggressive Move. The scenarios to consider are as follows:
- The possibility of breaking above the Order Block exists;
- Buy-side liquidity may be collected;
- The continuation of the bearish trend within the larger structure may occur.
Additionally, in the event of increased selling pressure from this zone, price may move directly downward.
Conclusion
In both Ethereum and BNB, price behavior is forming around liquidity and market structure dynamics.Ethereum is positioned between sell-side liquidity collection and targeting the $2038 level, while Binance Coin is fluctuating between a short-term correction and continuation of the bearish trend.
The final direction of the move will depend on how price closes in key zones and its reaction to Order Blocks; therefore, risk management and monitoring momentum on lower timeframes carry increased importance.


