


Key Points:
- The GBP/USD currency pair is in a liquidity accumulation phase, and the reaction to the Order Block and FVG will determine the short-term direction;
- On the 1-hour timeframe, following a Liquidity Sweep and reaction to the 50% Order Block level, selling pressure has increased, and the dominant scenario is a continuation of the corrective bearish move with a limited pullback;
- On the 15-minute timeframe, the Lower High / Lower Low structure and the concentration of liquidity above the market strengthen the probability of bearish distribution during the London session;
- The bullish scenario is conditional upon collecting Sell Side Liquidity and the formation of a market structure shift during the New York session;
- Employment Change data and the Average Earnings Index may create temporary volatility; however, if released in line with forecasts, the market will likely only capture liquidity on both sides.
Under current conditions, price behavior in the GBP/USD symbol is influenced more than anything by the liquidity structure and the upcoming economic calendar data. The release of two key data points, including Employment Change and the Average Earnings Index, may generate temporary volatility.
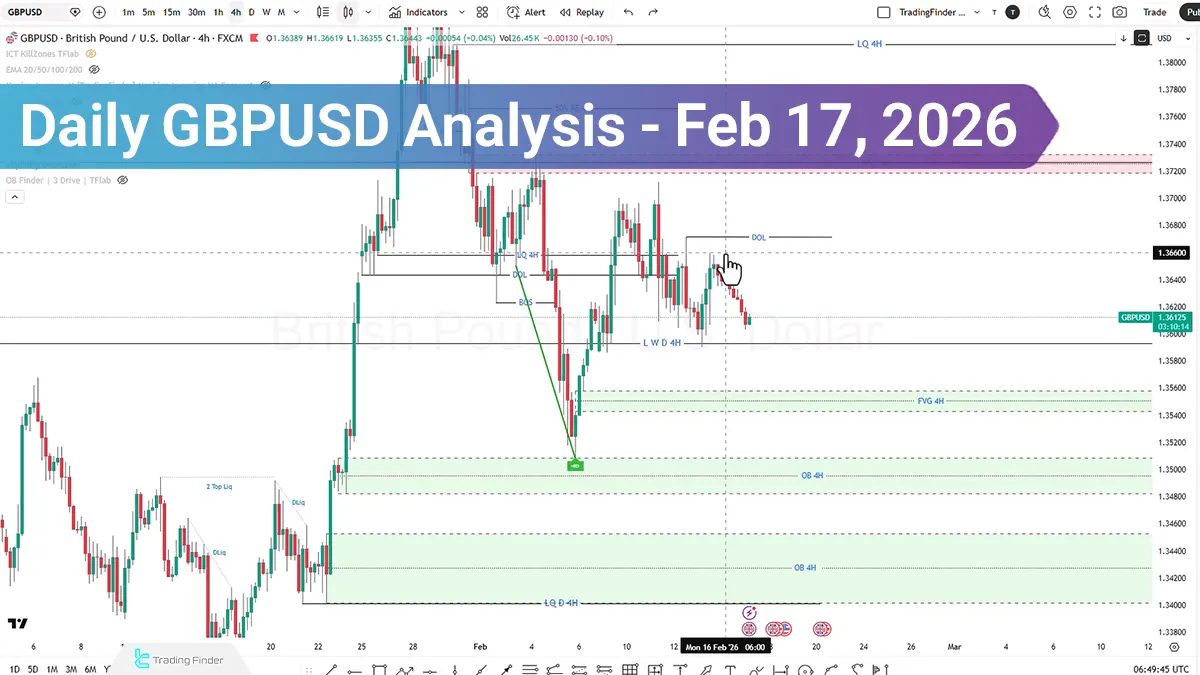
From a technical perspective, the reaction to Order Block zones and the Fair Value Gap will determine the short-term direction.
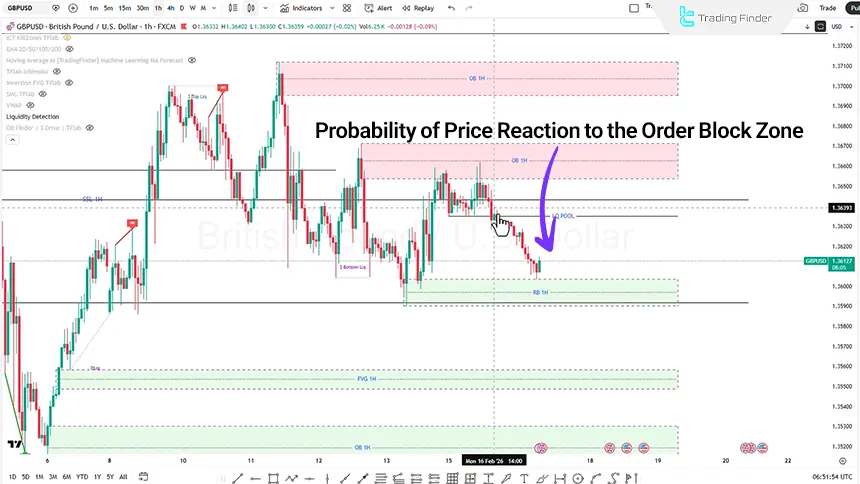
Daily GBP/USD Analysis on the 1-Hour Timeframe (H1)
On the 1-hour timeframe, after executing a Liquidity Sweep and collecting liquidity, price reacted to the 50% Order Block level and then entered a bearish phase. This downward movement subsequently reached the Rejection Block zone, indicating the presence of supply in this area.
Based on the current structure:
- After reacting to the Order Block, price has entered a corrective phase;
- There is a possibility of continuation of the bearish move with a limited pullback;
- If selling pressure is confirmed, further downside continuation can be expected.
Additionally, if price moves downward and collects sell-side liquidity, signs of weakness in the bearish structure will become significant. If a market structure shift is observed in this area on the 1-hour timeframe, this signal can be used for for entering a Buy position.
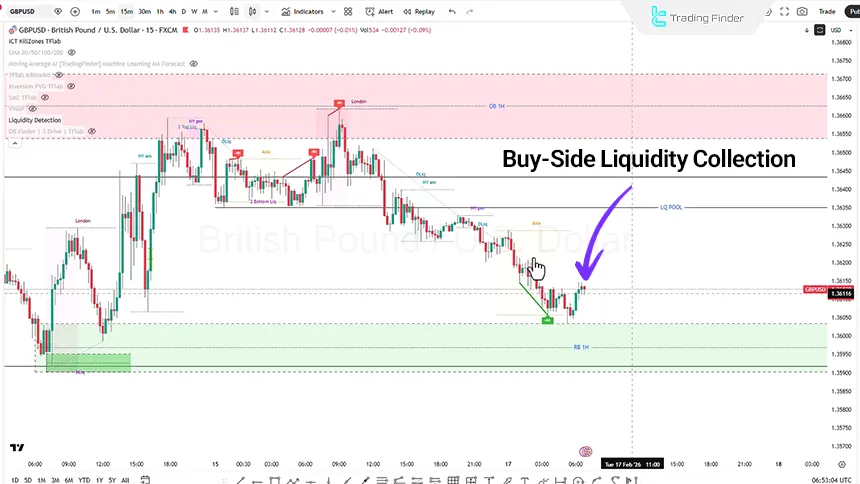
GBPUSD Analysis on the 15-Minute Timeframe (M15)
On the 15-minute timeframe, using the ICT Zone TF Lab indicator, key zones and trading sessions can be identified.
The price structure on this timeframe shows:
- The market is forming Lower Highs and Lower Lows;
- Buy-side liquidity has formed above the structure.
If during the London session, price moves upward and collects buy-side liquidity but then closes a candle again within the Asian session range, this behavior can be interpreted as a sign of bearish distribution, and if price initially moves downward and collects sell-side liquidity, especially during the New York session, the possibility of a bullish distribution phase emerges.
Fundamental Analysis of the GBP/USD Currency Pair
The release of two economic data points, including Claimant Count Change and the Average Earnings Index, may increase volatility. However, if the data is released close to forecasts, we will likely witness only limited volatility and liquidity collection.
Moreover, if the figures are released significantly higher or lower than forecasts, stronger volatility may develop. Therefore, risk management at the time of data releases is highly important, and technical scenarios must be aligned with the market’s reaction to the data.
Conclusion
The short-term structure of GBP/USD is in a liquidity accumulation phase, and price behavior around Order Block zones and the Fair Value Gap will determine the next direction.
The primary scenario is based on continued limited fluctuation and liquidity grabs on both sides of the market, unless economic data triggers a structural break and creates strong momentum. Additionally, focusing on market structure shifts, reactions to liquidity, and precise stop-loss management is key to decision-making under these conditions.


