


Key Notes:
- The GBP/USD pair remains in a dominant bearish trend, and entry into the Order Block zone may provide an opportunity to enter a sell position targeting the 1.3434 level if a Change of Character (CHoCH) is identified;
- A continued decline in the Dollar Index (DXY) toward the 96.621 level may create the groundwork for a short-term bullish correction in the pound;
- The presence of Smart Money Divergence (SMT Divergence) between GBP and EUR, with approximately 90% correlation, may signal the end of the bullish correction and continuation of the bearish trend in the market.
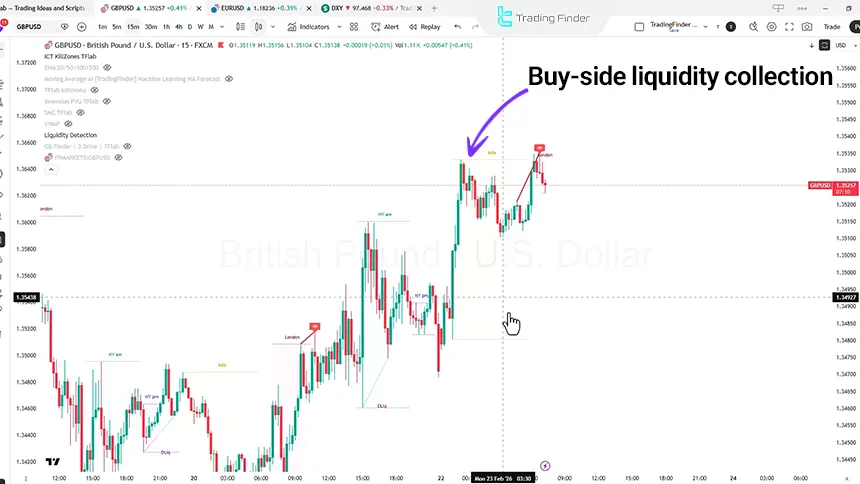
- Until a candle Close is recorded above the 1.3598 level, the market focus remains on sell positions, and the collection of Buy Side Liquidity on the 15-minute timeframe may initiate a new bearish move.
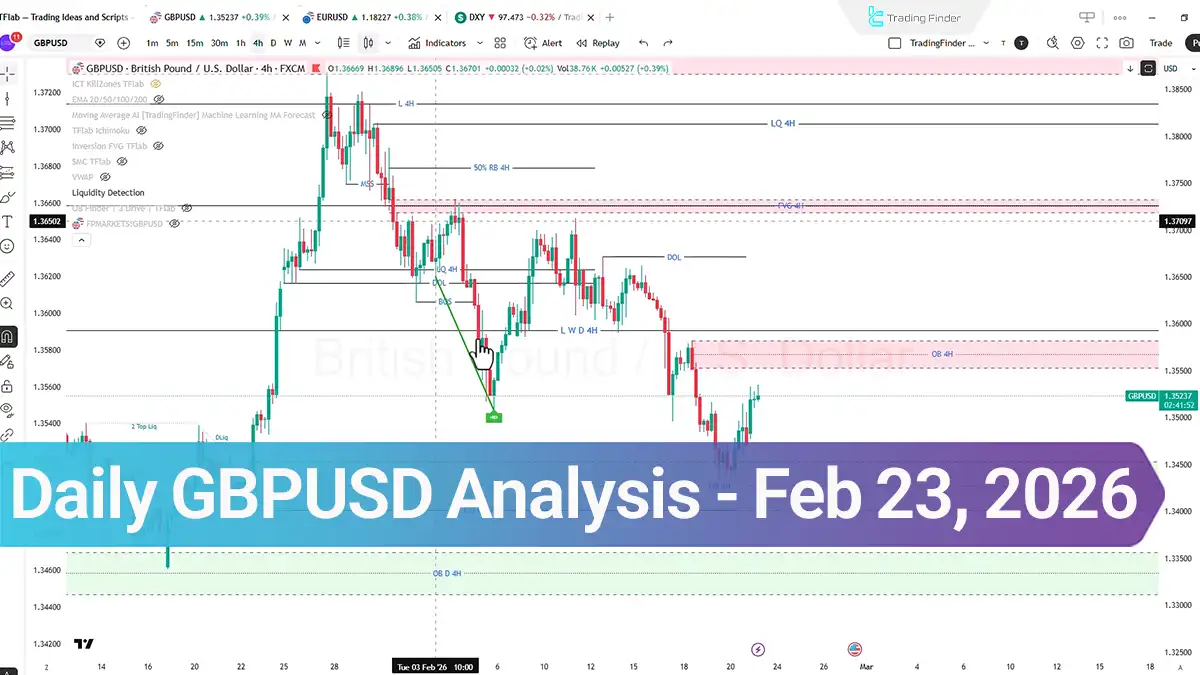
In continuation of the bearish trend, the GBP/USD price has been accompanied by increased selling pressure and has entered the Order Block zone.
With the start of Monday trading and the opening of the Asian markets, alongside the weakening of the Dollar Index (DXY), the pound has appreciated against the dollar, which may be considered a bullish correction within the prevailing bearish market trend.
GBP/USD Market Structure Analysis and Trading Scenario
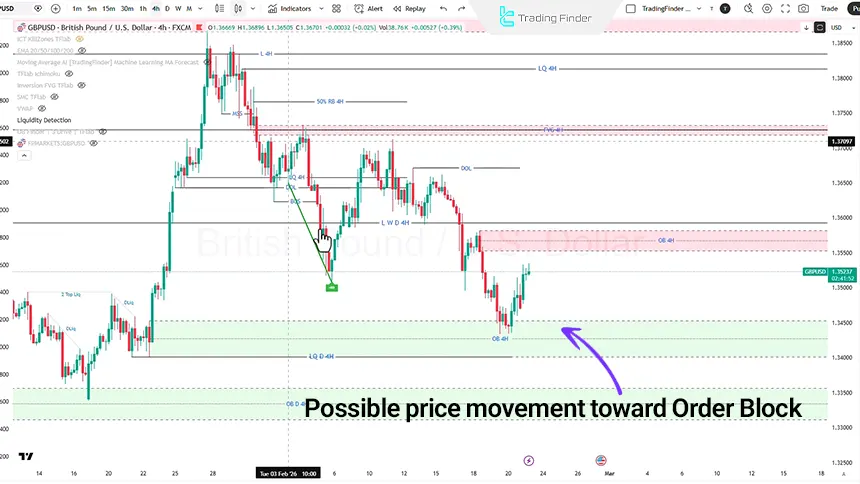
If the decline in the Dollar Index (DXY) continues, the price may enter the Order Block zone, and upon identifying weakness in the bullish trend along with a Change of Character in the market, an opportunity to enter a sell position in alignment with the bearish market trend will be provided.
In this scenario, the price target may be the Draw on Liquidity zone at the 1.3434 level.
On the other hand, fundamental factors indicate that the U.S. Supreme Court’s declaration of the tariffs imposed by Donald Trump as illegal has led to a decline in the Dollar Index at the start of the Asian trading session.
However, the DXY is expected to experience a short-term bullish correction, fill the gap zone, and then continue its bearish trend.
If the Dollar Index gains strength, it may target higher levels, which in turn could lead to a bearish move in the pound. In an alternative scenario, if the decline continues toward the 96.621 level, the pound may move toward higher levels.
GBPUSD Divergence Analysis
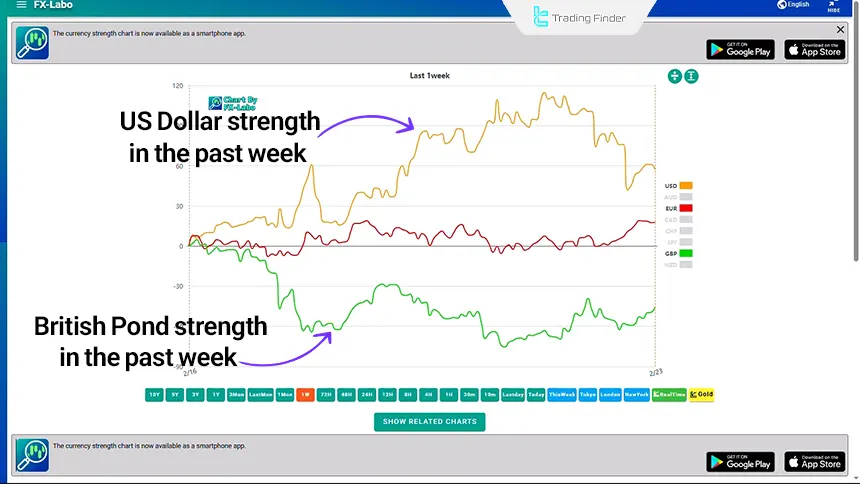
Currency strength analysis shows that over the past week, the U.S. dollar has been among the strongest currencies in the market, the euro has remained in a neutral range, and the pound has weakened.
Additionally, analysis of the Correlation between GBP and EUR indicates approximately 90% correlation between these two pairs.
Based on this correlation, a Smart Money Divergence can be identified between GBP and EUR, where GBP has recorded higher highs while EUR has registered lower highs, which may indicate the end of the bullish correction.
GBP/USD Analysis on the 1-Hour Timeframe
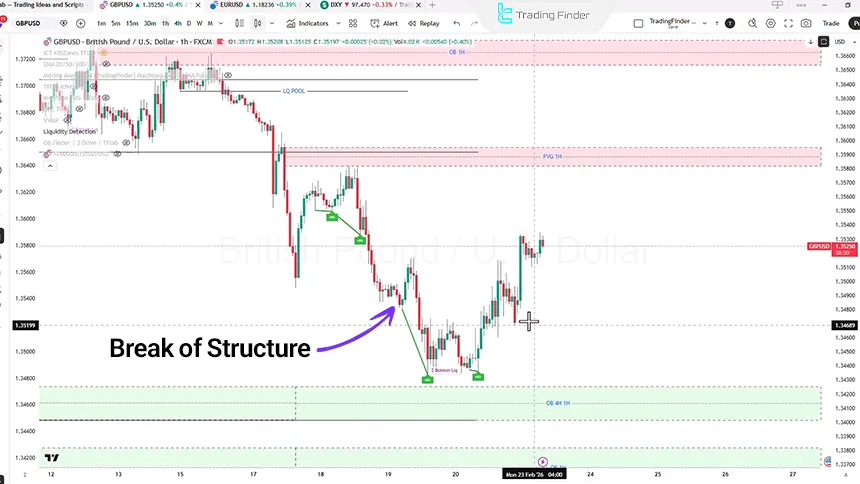
On the 1-hour timeframe, the price moved downward following a Break of Structure (BOS) and then entered a bullish corrective phase with a strong upward movement.
During this process, a Market Structure Shift (MSS) level was also broken. Under these conditions, the price may move downward and enter the Order Block zone at the 1.3489 level.
If weakness in the bullish trend is identified, the continuation of the bearish movement may become feasible.
On the other hand, if weakness appears in the bearish trend, the price may once again enter the Fair Value Gap (FVG) or Order Block zone, and upon identifying weakness in the bullish trend, a suitable opportunity to enter a sell position may arise.
Considering economic and political factors, the pound is expected to continue weakening and target lower levels during the current week. However, if the DXY declines, the pound may experience a bullish correction.
Until the price records a candle Close above the 1.3598 level, it is recommended to avoid entering buy trades and to focus on sell positions.
GBPUSD Analysis on the 15-Minute Timeframe
On the 15-minute timeframe, the price movement in the Asian session was accompanied by a strong bullish move, which, after collecting Buy Side Liquidity above the Tuesday Asia high during the London session, showed a negative divergence using the CVD Divergence indicator.
This divergence may indicate the beginning of a bearish trend in the market, providing an opportunity to enter a sell position toward the Order Block zone.
Additionally, analysis of the 15-minute timeframe of the Dollar Index (DXY) indicates a short-term bullish correction that may move upward during the London session, target the New York afternoon Kill Zone, and then move downward again.
Conclusion
The overall structure of the GBP/USD symbol still tends toward continuation of the bearish trend, while the decline in the Dollar Index may create the groundwork for short-term bullish corrections. The price reaction to the $1.3434, $1.3489, and $1.3598 levels alongside the DXY movement toward the 96.621 level may play a key role in determining the market’s next direction from a momentum and liquidity structure perspective.


