


Key Points:
- Bitcoin has entered a consolidation phase and structural compression in the market, and the price closing within the previous day’s candle indicates reduced liquidity and anticipation for the next move;
- In the 4-hour timeframe, a reaction to the FVG zone and the formation of an accumulation phase can be observed;
- The $70,000 level has acted as the primary liquidity concentration and may trigger a short-term upward move before a correction;
- In lower timeframes, if rejection occurs from the 200 moving average or the FVG, the scenario of returning to lower support levels is strengthened;
- Despite some signs of accumulation, on-chain data still confirm selling pressure; therefore, stabilization of bullish momentum is essential for continued growth.
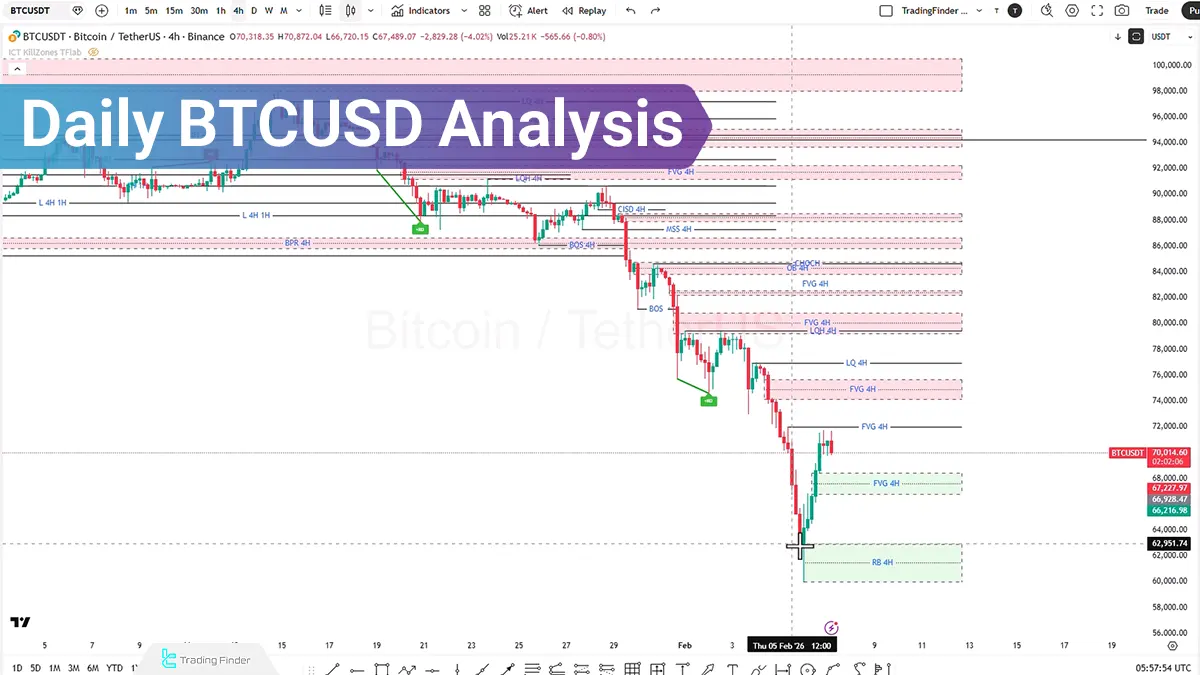
In yesterday’s trading session, Bitcoin experienced reduced liquidity and entered a Consolidation phase, with the price closing within the range of the previous day’s candle. This behavior indicates a reduction in supply and temporary compression in the market structure.
The primary short-term market scenario depends on how Sell Side Liquidity or Buy Side Liquidity is collected and the type of candle Close within the current range.
Meanwhile, on-chain data also indicate the continuation of selling pressure; however, signs of an Accumulation phase can be observed in some indicators.
Bitcoin Analysis in the 4-Hour Timeframe (H4)
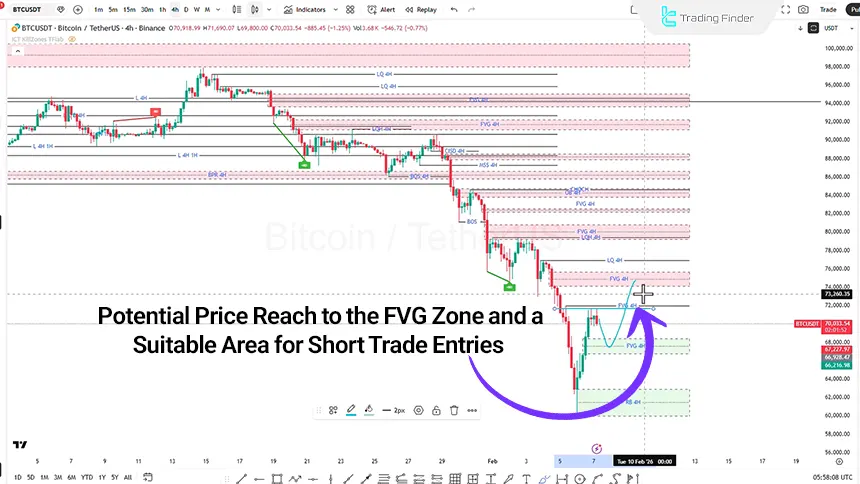
In the 4-hour timeframe, the expected bearish move has materialized, and the price has reacted to the Fair Value Gap area, placing the market in an Accumulation phase.
The likely scenario in this timeframe:
- There is a possibility of a bullish move to collect Buy Side Liquidity;
- If liquidity increases, the price may target higher levels and react to the Liquidity Pool area.
After observing weakness in the bullish trend, including declining Momentum or failure to hold above resistance levels, the scenario of entering a Sell position can be considered.
Conditions for entering a Sell position:
- Collection of liquidity and the price closing again within the consolidation range;
- Increased bullish momentum, reaching the FVG area, and observing signs of structural weakness in the continuation of the move.
BTC Analysis in the 1-Hour Timeframe (H1)
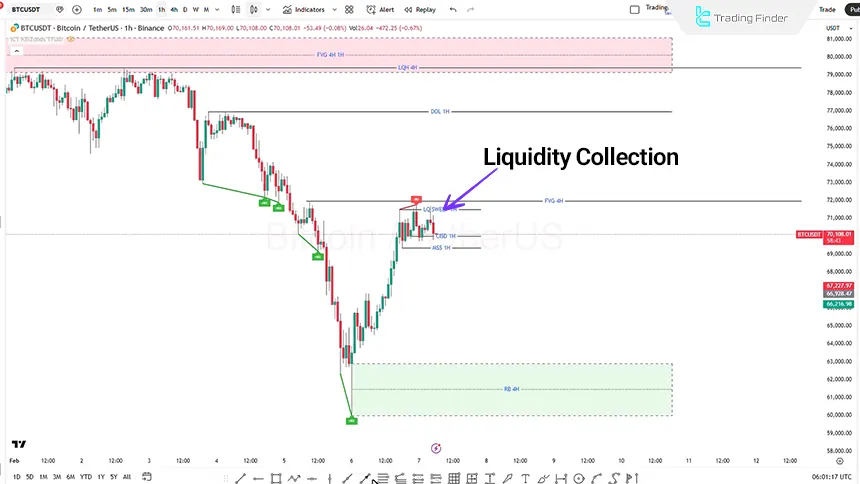
In the 1-hour timeframe, the price reacted to the 2 to 2.5 target according to the projection and is now in an accumulation phase.
- Key levels in the 1-hour timeframe analysis are as follows:
- Potential reaction to the Fair Value Gap (FVG) at $70,619;
- Reaction to the 200 moving average as dynamic resistance;
- Collection of Buy Side Liquidity around $70,000;
If bullish momentum increases, the following scenario will unfold:
- Collection of liquidity at $70,000;
- Reaction to the resistance zones at $72,000 and $74,500.
However, if rejection occurs from the 200 moving average or the FVG, the probability of returning to lower levels increases.
BTCUSD Analysis in the 15-Minute Timeframe (M15)
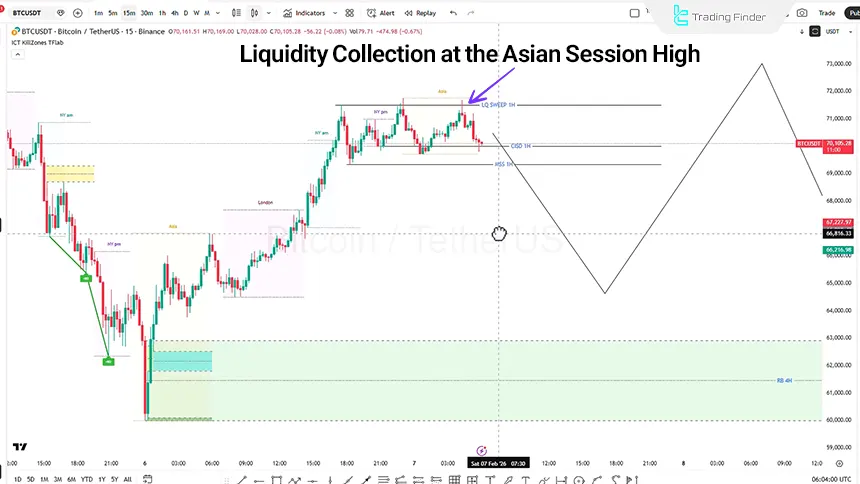
According to data from the CoinGlass platform in the 15-minute timeframe, Buy Side Liquidity is concentrated at the $70,000 level.
Additionally, an upward price movement may lead to the collection of this liquidity and then a reaction to the Fair Value Gap (FVG), creating conditions for entering a Sell position upon observing momentum weakness. In this scenario, the target could be the market’s previous Swing Low.
Conclusion
Bitcoin’s short-term structure is in a consolidation and accumulation phase, while on-chain data continue to confirm selling pressure.
Moreover, the concentration of liquidity around the $70,000 level may trigger a short-term bullish move for liquidity collection.
However, as long as on-chain data do not exit the negative phase and bullish momentum is not stabilized, the corrective scenario and a retest of lower support levels remain valid.


