


Key Points:
- After sweeping Buy Side Liquidity and returning to the Close range, Bitcoin is showing signs of weakening short-term bullish momentum;
- On the 1-hour timeframe, entry into an Order Block and the formation of a bullish Pin Bar are observed; if new structural lows form along with a bullish confirmation candle, the long scenario with an R/R of approximately 1:2 will be activated;
- In the event of increasing bearish momentum and the formation of strong selling candles, the probability of targeting Sell Side Liquidity and lower levels will strengthen;
- Reduced liquidity due to the closure of traditional markets may lead to choppy movements or fake breakouts; therefore, risk management is of high importance in this phase;
- Smart Money data indicates that institutional leverage has reached a range that was observed in the 2013, 2017, and 2021 cycles simultaneously with the onset of major bear markets; however, the current risk appetite index is higher than in previous periods.
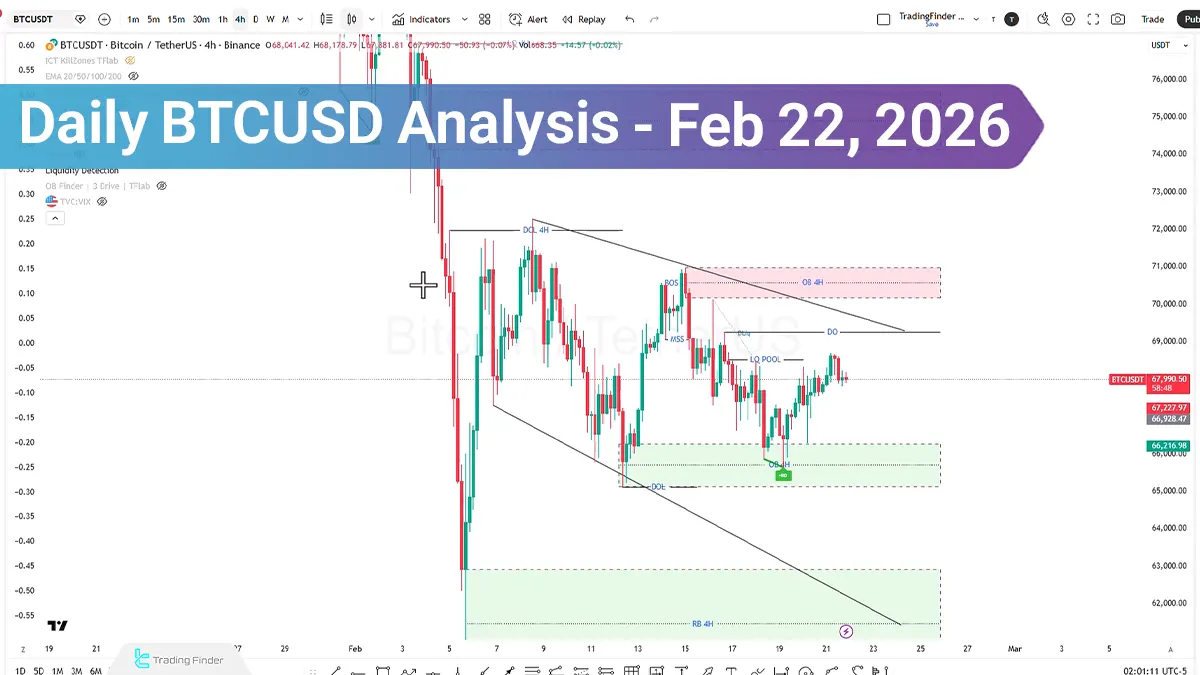
On February 22, 2026, Bitcoin’s price, after moving upward in line with the projected scenario, swept Buy Side Liquidity and once again returned to the Close range.
This behavior may signal a weakening of short-term bullish momentum. Considering the closure of certain financial markets and the potential decline in liquidity, the scenario of increasing selling pressure and targeting lower levels remains under consideration.
Alongside technical analysis, Smart Money data also provides important signals regarding the behavior of major market participants.
Bitcoin Analysis on the 1-Hour Timeframe (H1)
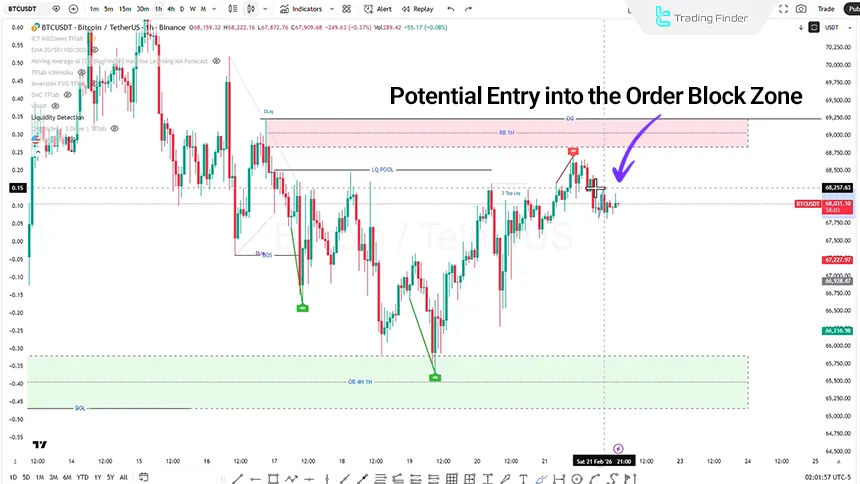
On the one-hour timeframe, price experienced a sharp move and then entered a pullback phase. This corrective movement led price into the Order Block zone and subsequently formed a bullish Pin Bar.
This structure may indicate the market’s attempt to continue the bullish trend in the short term, provided that the following conditions are met:
- The formation of three lower lows compared to the previous swing;
- The close of a bullish candle with appropriate momentum.
If these conditions are fulfilled, entering a long position as a trading strategy with a risk-to-reward ratio of 1:2 would be worth considering. The Stop Loss should be set based on the structure of the formed lows.
Conversely, if selling pressure increases and bearish candles with strong momentum form, the probability of targeting lower levels and sweeping Sell Side Liquidity will strengthen.
Given the closure of some traditional markets, reduced liquidity may result in lower volatility. Such conditions typically lead to choppy movements or fake breakouts in the Crypto market; therefore, risk management becomes even more critical in this phase.
Bitcoin Fundamental and Sentiment Analysis
Data review shows that hedge funds and financial institutions are taking positions in Bitcoin using heavy leverage. The investment level of these groups has reached a range that has been observed only four times since 2012.
In previous cycles, similar conditions in 2013, 2017, and 2021 coincided with the beginning of major bear markets, ultimately leading to declines of more than 75 percent in Bitcoin’s price. However, the key difference in the current cycle lies in Smart Money level of risk appetite.
At present, the risk appetite index stands at 75, whereas in previous cycles this index had fallen below 50 percent. This indicates that the selling pressure scenario remains valid, but the current market structure differs from prior periods and cannot be concluded with the same certainty as in the past.
Additionally, reviewing Market Sentiment at this stage is of particular importance. The potential approval of macroeconomic policies or interest rate cuts could act as a bullish catalyst and weaken the current bearish structure. In the absence of such catalysts and with continued selling pressure, the Bitcoin bear market could enter a new phase.
Conclusion
After sweeping Buy Side Liquidity, Bitcoin has entered a short-term phase of indecision, and the lower timeframe structure shows signs of confrontation between buyers and sellers.
From a fundamental analysis perspective, Smart Money behavior and the price’s distance from the short-term holders’ average purchase price have increased the risk of continued selling pressure.
The price reaction to production cost levels, ETF average purchase prices, and changes in market momentum will determine the direction of the next phase.


