


Key Points:
- Global gold ounce, after entering the rejection block zone, is moving into a consolidation phase;
- On the 4-hour timeframe, following buy-side liquidity collection, increased selling pressure has strengthened the probability of a short-term correction toward the $4907 to $4830 zones;
- The 200-day moving average and the FVG zone are considered among the most important reaction levels that can determine the next directional move;
- On the 1-hour timeframe, a break of the $4950 level signals strengthening bullish momentum;
- In the event of intensified selling pressure, the $4763 level, as a supportive order block, could serve as a potential rejection and price reversal area.
On February 9, 2026, global gold ounce, after entering the rejection block zone, faced a short-term bearish reaction and then moved upward again. However, the closing of the recent candle without stabilization above or below the Doji candle indicates the market’s entry into a consolidation phase.
At present, scenarios of a short-term correction toward demand zones followed by continuation of the bullish trend, alongside the possibility of a deeper correction, are simultaneously being considered.
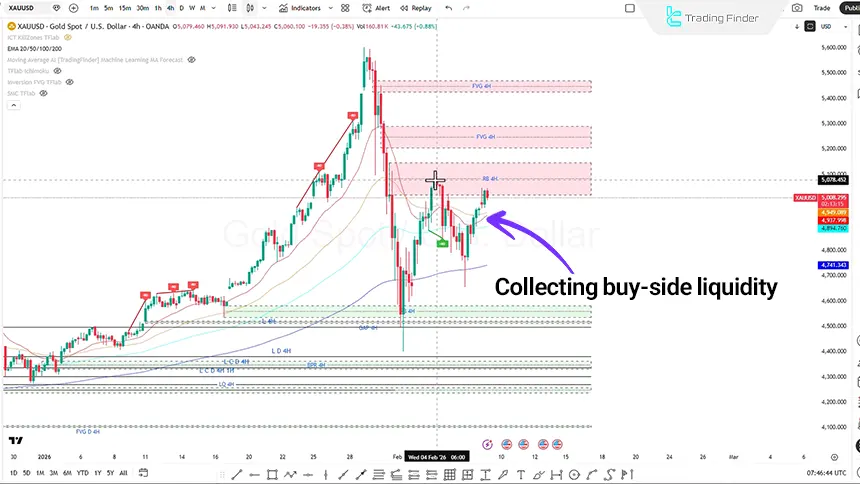
Gold Analysis on the 4-Hour Timeframe (H4)
On the 4-hour timeframe, price, after entering the rejection block zone and showing an initial reaction, has experienced a limited correction.
In the 4-hour candle, following buy-side liquidity collection, selling pressure has increased, which could set the stage for another short-term correction.
Key Price Zones:
- The range between $4907 and $4830;
- The lower zone including a Fair Value Gap along with a pin bar candle;
- The 50% level of the rejection block;
- The 200-day moving average.
The 200-day moving average holds particular importance due to the history of multiple price reactions to this level.
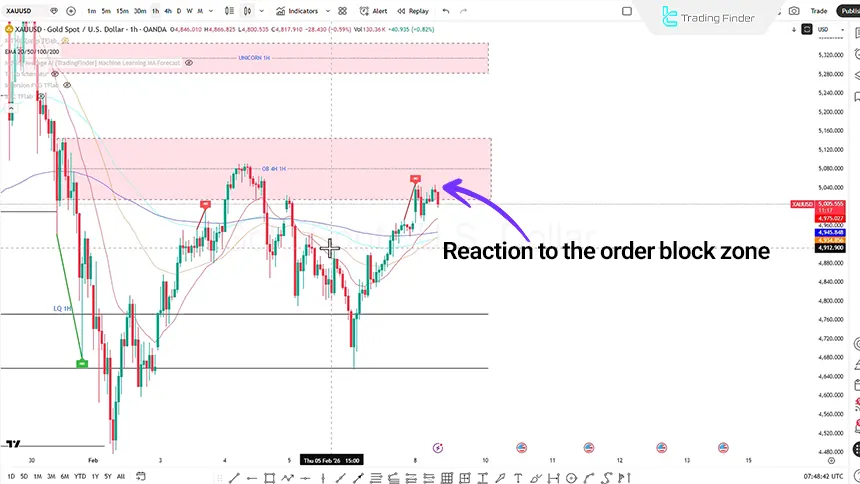
XAUUSD Analysis on the 1-Hour Timeframe (H1)
On the 1-hour timeframe, price, after breaking the structure, has moved upward and successfully surpassed the key $4950 level; a level recognized as a market structure shift and which can signal strengthening short-term bullish momentum.
However, price is expected to make a downward pullback to complete the structure and, after collecting sell-side liquidity, react to the order block zone.
Additionally, if weakness is observed in the bearish move, the long position entry scenario will be activated.
In case of increased selling pressure, there is a possibility of movement toward the order block zone at the $4763 level, which could serve as a renewed price rejection area.
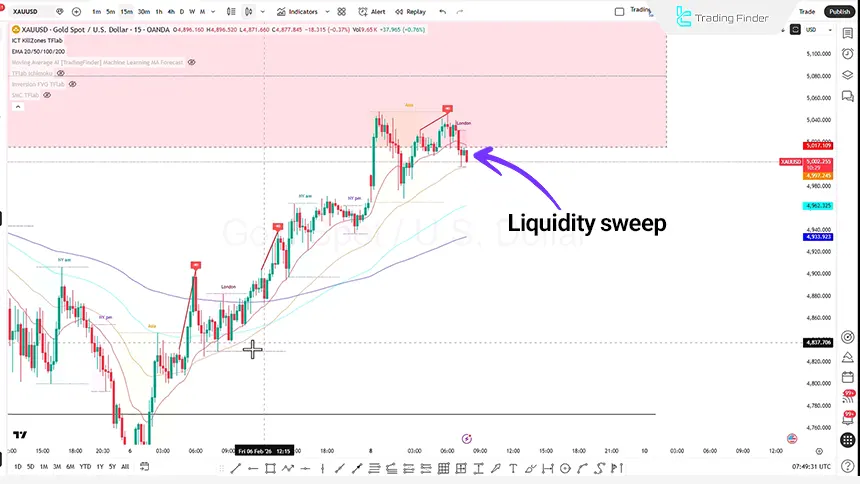
Gold Analysis on the 15-Minute Timeframe (M15)
On the 15-minute timeframe, the price movement structure during the Asia session can be interpreted as a consolidation range; the market shows a compressed trading range, which is usually a precursor to a directional move in subsequent sessions.
If, during the London session, sell-side liquidity is collected, the probability of activating a bullish distribution phase increases; under these conditions, liquidity pool analysis shows that equal highs are positioned above the current structure, which can act as a price magnet and attract price toward them.
From the perspective of technical tool confluence, the 200-day moving average is located within an order block candle zone. This overlap can function as a decision-making area.
As a result, a positive reaction and stabilization above this zone would strengthen the probability of continued bullish movement toward the equal highs.
Conclusion
The overall gold structure remains aligned with a bullish bias; however, recent candlestick behavior and the market’s entry into a consolidation phase indicate the possibility of a short-term correction before trend continuation.
The market’s main focus is on liquidity zones, the Fair Value Gap (FVG), and reactions to the 200-day moving average.
Moreover, the final direction of movement will depend on how price reacts to these levels and the quality of liquidity collection on lower timeframes.


