


Key Points:
- The GBP/USD currency pair closes with a bullish bias after collecting sell-side liquidity;
- In the 4-hour timeframe, a pullback to the 50% and 61% Fibonacci levels, along with FVG confluence, could mark the corrective high and the start of a new bearish wave; the overall market context remains tilted to the downside;
- The $1.3540 to 1.3505$ range, as a supportive order block, is considered a key zone for a conditional buy scenario targeting $1.3697;
- In the 1-hour timeframe, the formation of a Pin Bar after a stop hunt strengthens the probability of a pullback toward the $1.3556 to $1.3544 range;
- Price behavior during the London and New York sessions, as well as the manner of liquidity collection, will play a key role in confirming either a bearish distribution scenario or the continuation of the bullish correction.
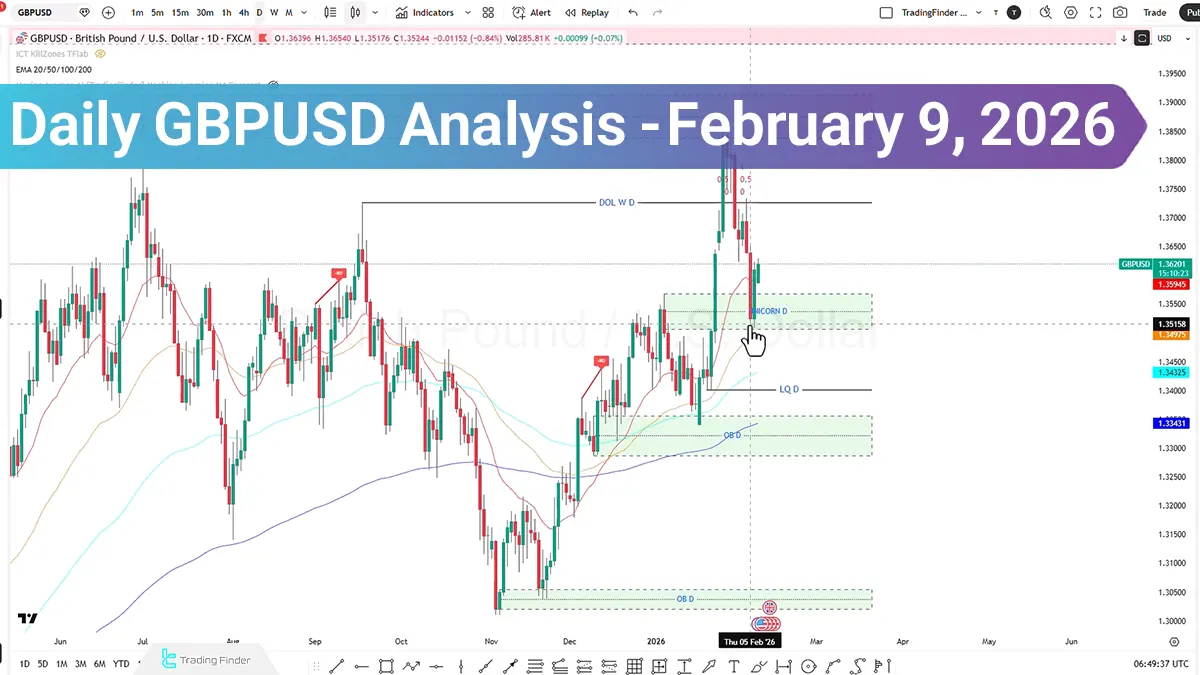
On the daily chart, the GBP/USD pair reacted to the daily Unicorn zone after collecting sell-side liquidity and displayed a bullish bias with a candle close.
Additionally, price behavior around the $1.3623 level, as a key level, will determine the short-term direction.
Alongside the technical structure, the relative weakening of the pound due to expectations regarding central bank decisions is also considered a notable fundamental factor.
GBP/USD Analysis in the 4-hour timeframe
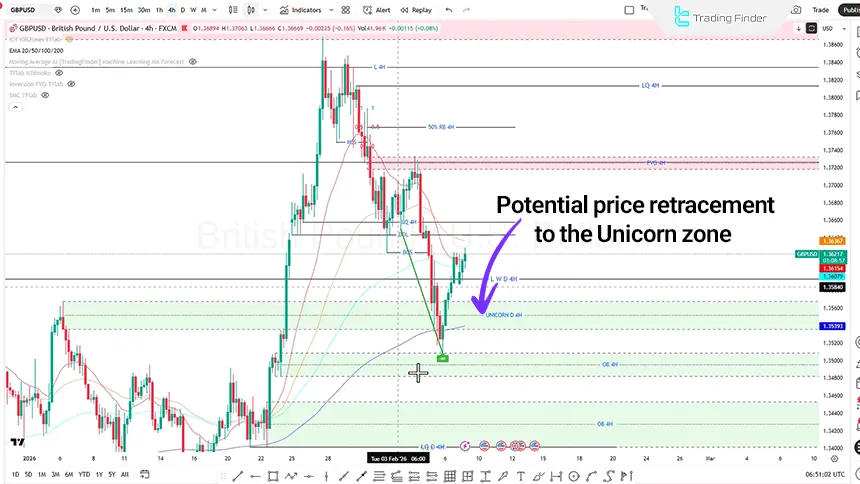
In the four-hour timeframe, after a Liquidity Sweep, price entered a bullish phase; however, upon reacting to the projected zone, it re-entered a bearish trend and targeted lower lows.
Under current conditions, if price closes above the CP zone at $1.3642, it may move toward the Fair Value Gap at $1.3550.
By examining Fibonacci ratios from the beginning of the bullish move, price has retraced to the 61% level, and the reaction zone lies within the optimal trade entry area.
Also, the overlap of the 50% level with a Fair Value Gap (FVG) around $1.3688 is observed, which could mark the corrective top and the start of a new bearish wave.
In the short-term bearish corrective scenario, price is expected to retrace to the 61% Fibonacci level, which overlaps with a Fair Value Gap. If only liquidity is collected and price closes within the consolidation range, a move toward the 50% Unicorn and the order block between $1.3540 and $1.3505 is possible.
Within this range, a conditional buy position may be considered:
- Stop loss behind the order block;
- Take profit at the Fair Value Gap at $1.3697.
However, the overall market context is still assessed as bearish.
GBPUSD Analysis in the 1-hour timeframe (H1)
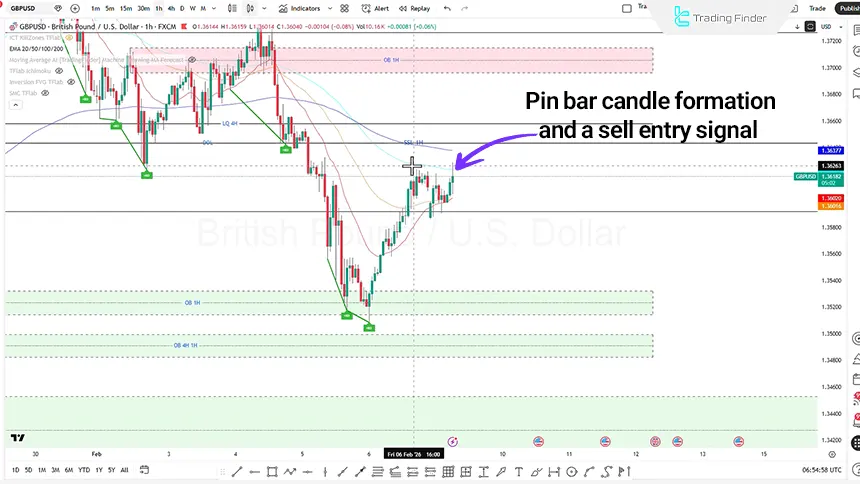
In the one-hour timeframe, price is within a consolidation range and, after a stop hunt, is forming a Pin Bar candle, which may serve as an initial signal for a short position.
Corrective targets using a 2 to 2.5 projection lie between $1.3556 and $1.3544, located within a Fair Value Gap (FVG). After reaching this area, a buy position may be considered targeting higher swings.
GBP/USD Analysis in the 15-minute timeframe (M15)
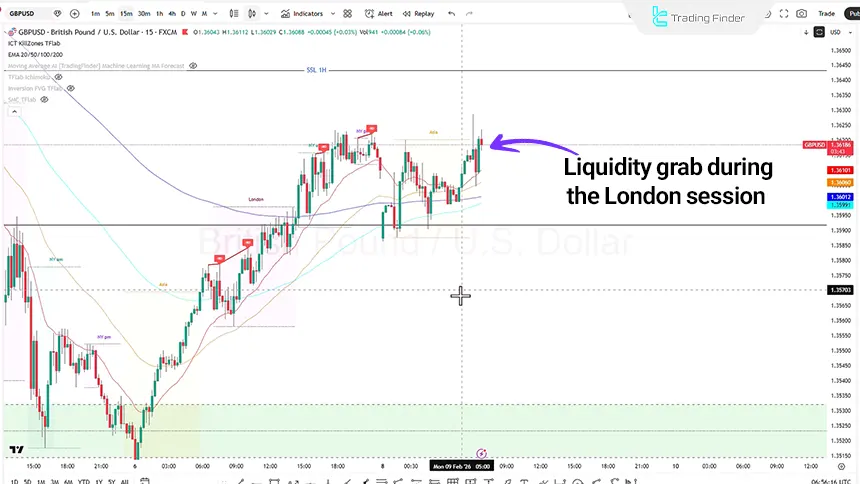
In the 15-minute timeframe, the price movement structure has formed within an Accumulation phase. If manipulation occurs during the London session, a bearish distribution phase may be expected during the New York session.
In this scenario, sell-side liquidity is first collected, and then the market enters a bearish distribution phase.
Conclusion
The overall structure of GBP/USD in the mid-term context remains tilted to the downside, although short-term bullish corrective scenarios are also active.
The $1.3623 and $1.3694 levels on the upside and the $1.3458 to $1.3413 range on the downside will be key levels determining the next price direction.
The convergence of technical signals, including RSI negative divergence, reaction to the 100-day moving average, and liquidity structure, indicates that risk management and attention to market momentum and liquidity are of high importance in trading decisions.


