


Key Points:
- Bitcoin remains in a bearish structure on February 7, 2026, with selling pressure defining the dominant market direction;
- The price reaction at the key $60,000 level has only produced a short-term bullish correction, with no signs of a trend reversal;
- A move into the Fair Value Gap (FVG) zone around $75,000 may provide a suitable area to evaluate short positions and target lower price levels;
- ETF data, the Fear & Greed Index in extreme fear territory, and corporate treasury conditions all confirm weak demand and dominant negative sentiment;
- As long as price fails to reclaim higher key levels, market focus remains on sell-side scenarios and targeting sell-side liquidity.
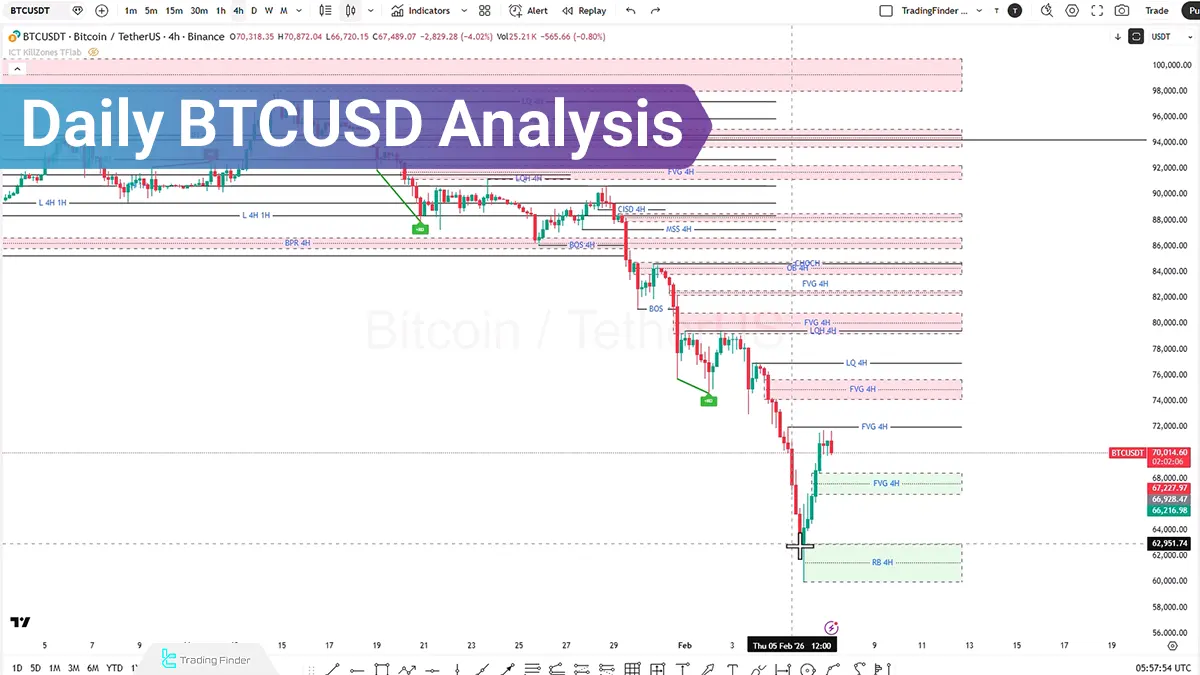
On February 7, 2026, Bitcoin remains in a broader downtrend, with selling pressure shaping the dominant price structure.
A price reaction has been recorded at the key $60,000 level, forming a short-term bullish correction in this area.
Continuation of this correction may occur with the objective of collecting buy-side liquidity. Additionally, price entry into the Fair Value Gap zone around $75,000 is considered a suitable area for evaluating short-selling strategies and targeting lower market levels.
Under current conditions, market focus remains on sell-side scenarios, and entering long positions is not considered a priority.
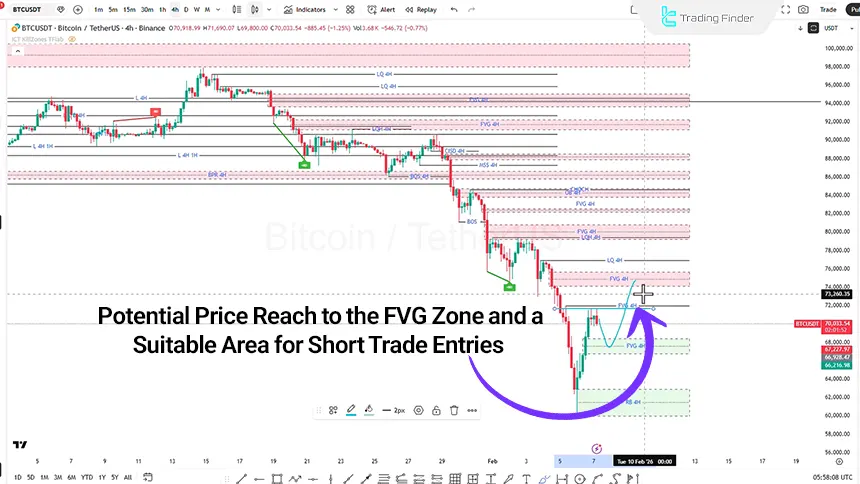
Bitcoin Analysis on the 4-Hour Timeframe (H4)
On the 4-hour timeframe, market focus remains on bearish scenarios, and long positions are not prioritized. The overall price structure continues to show bearish bias, with liquidity behavior reinforcing this view.
Analysis of Bitcoin exchange-traded funds (Bitcoin ETFs) provides a clear picture of market sentiment. After recording a positive net inflow of $561 million over three days, capital inflows failed to stabilize.
Subsequently, net outflows of $272 million, $544 million, and finally $434 million were recorded. This sequence highlights rising fear in the market and a significant decline in bullish conviction.
Review of the Fear & Greed Index tool confirms that the market is positioned in extreme fear. A reading of 8 underscores ongoing downside pressure and the dominance of negative sentiment.
Analysis of corporate Bitcoin treasury holdings further reinforces supply-side pressure. Among 41 companies holding Bitcoin reserves, 31 are currently at a loss, while only 10 or 11 remain in profit. This statistical distribution weakens the sustainability of new liquidity entering the market.
Examination of whale orders and large orders on the 15-minute timeframe shows that buy-side volume remains lower than sell-side volume. This order flow behavior can be used as key reference zones for evaluating short trade entries.
Price levels at $72,000, $73,000, and the $75,000 area are identified as key zones for evaluating short positions. Meanwhile, the $60,000 level lacks sufficient validity for long entries in this structure.
On lower levels, the $55,000 zone and subsequently the $50,000 level are identified as areas with significant concentrations of large whale orders, making them potential downside targets for the market.
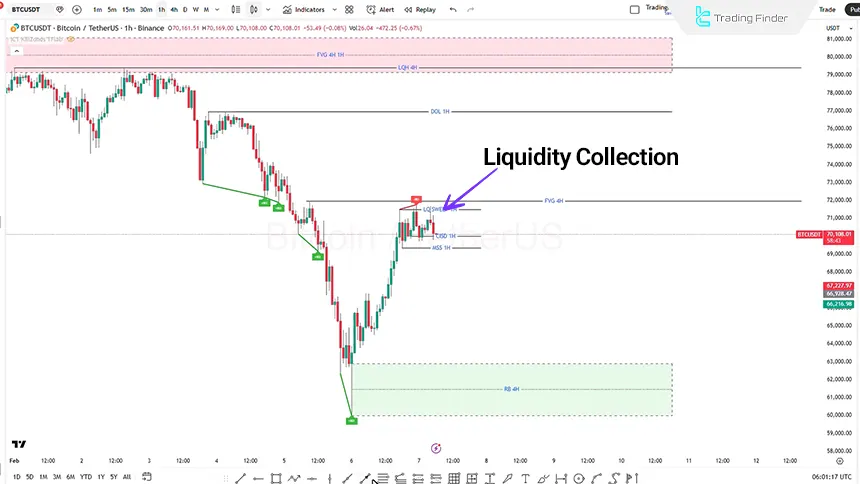
BTC Analysis on the 1-Hour Timeframe (H1)
On the 1-hour timeframe, continuation of bearish price movement is observed. After the formation of a manipulation move and a liquidity sweep, price pulls back into the order block zone.
This structure creates favorable conditions for using this area as a short trade entry zone.
In this scenario, placing the stop loss behind the swing high or above the $72,000 level is considered logical. Price targets may be defined using a 1:1 or 1:2 risk-to-reward ratio.
Additionally, the manipulation leg zone between $64,896 and $65,590 (leg 4 to 4.5) is identified as a primary market target.
Intermediate manipulation leg zones at $67,930 and $73,140 are also highlighted as mid-range price targets.
After liquidity collection, if a bullish correction forms with increasing momentum and bullish displacement, higher levels may be used as new trade entry zones.
Within this structure, the Drawn Liquidity zone at $76,199 is identified as a key market level.
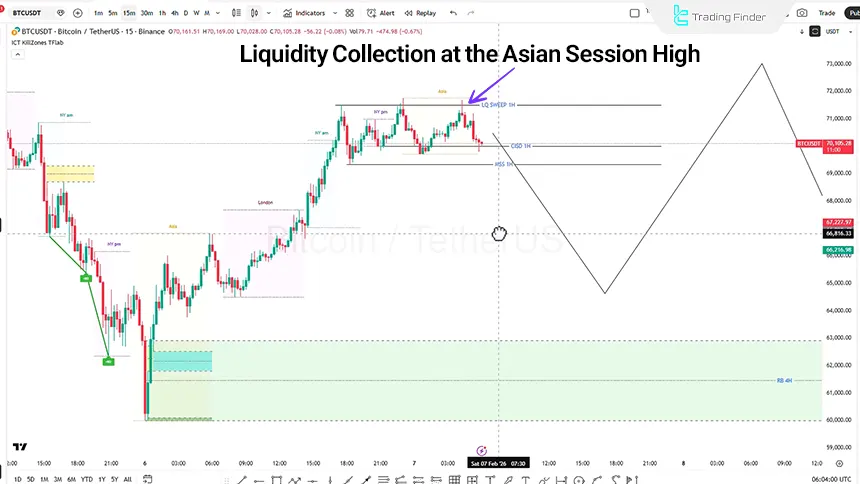
BTCUSD Analysis on the 15-Minute Timeframe (M15)
On the 15-minute timeframe, Bitcoin price action following the formation of a short-term high is accompanied by buy-side liquidity collection at the Asian session high.
This behavior aligns with a higher-timeframe liquidity sweep and represents a sign of weakening bullish momentum in the short-term market structure.
Price rejection from the liquidity high and candle closes confirm a market structure shift on the 1-hour timeframe.
This structural shift keeps the bearish scenario active on the 15-minute timeframe and increases the probability of continued corrective movement to the downside.
Within the evolving structure, sell-side liquidity located in the lower portion of the chart is identified as the next market target. Reaching this zone may be accompanied by increased bearish acceleration and facilitate further downside continuation.
Conclusion
Bitcoin price behavior on February 7 confirms continuation of the bearish structure alongside short-term corrective moves. Buy-side liquidity collection at higher levels and negative price reactions around equilibrium zones continue to direct the primary market path toward targeting sell-side liquidity.
The alignment of structure shifts on lower timeframes with weakening bullish momentum preserves the validity of bearish scenarios.
As long as price fails to reclaim key levels and stabilize above order blocks, analytical focus remains on temporary corrections, liquidity management, and sustained downside pressure.


