


Key Points:
- Ethereum and BNB remain in a bearish structure, with selling pressure defining the primary price direction;
- In Ethereum, a negative reaction to the 20-period moving average, ETF capital outflows, and the Fear & Greed Index reinforce the bearish scenario;
- A daily close below key Ethereum levels increases the probability of price moving toward lower zones such as the FVG around $1600 or the $1500 support;
- BNB shows bearish displacement and weak momentum, placing lower targets such as $524 and $500 within reach, while pullbacks are considered selling opportunities only;
- Until a confirmed structural shift and reclaim of key levels occurs, bullish corrections in both assets remain temporary, and market focus stays on sell-side scenarios.
On February 7, 2026, Ethereum and BNB remain in a bearish structure, with selling pressure determining the dominant price path.
Price reactions to key levels, ETF flows, and momentum behavior across multiple timeframes define short-term and mid-term trading scenarios.
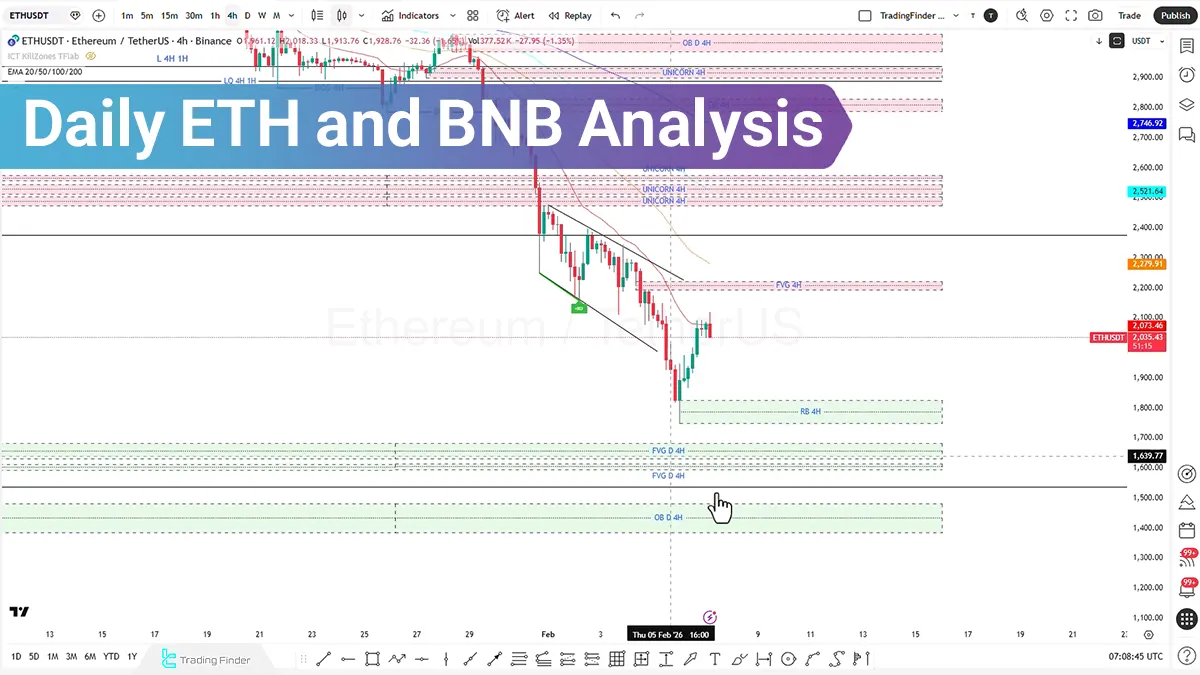
Ethereum (ETH) Analysis on the 4-Hour Timeframe (H4)
On the 4-hour timeframe, Ethereum price recorded a short-term bullish correction after reacting to the $1800 level. However, continuation of this move was accompanied by a liquidity sweep and a negative reaction to the 20-period moving average.
This behavior signals a return to the bearish path and sustained selling pressure.
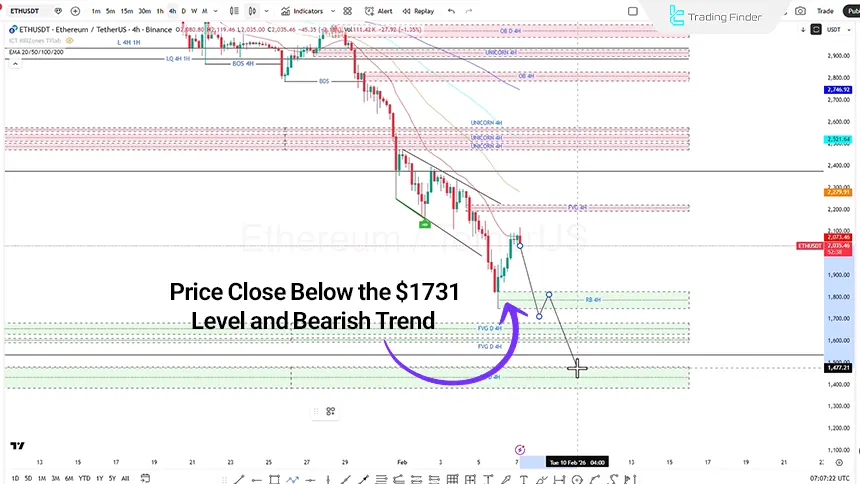
A price close below the $1731 level activates continuation of the downtrend and opens the path toward lower targets such as the $1500 support or the Fair Value Gap near $1600. Price reaction within these zones will play a decisive role in determining the next market phase.
Review of Ethereum exchange-traded funds (Ethereum ETFs) shows clear signs of weakening sentiment. Recorded net inflows of $10 million and $91 million were followed by a net outflow of approximately $80 million.
The recent dominance of outflows over inflows reinforces the presence of extreme fear in the market.
Analysis of the Fear & Greed Index confirms that the market remains in extreme fear territory. Stabilization of the index at level 8 highlights increasing selling pressure and heightened trader caution.
These conditions raise the likelihood that institutional participants will focus on lower price levels for potential long exposure.
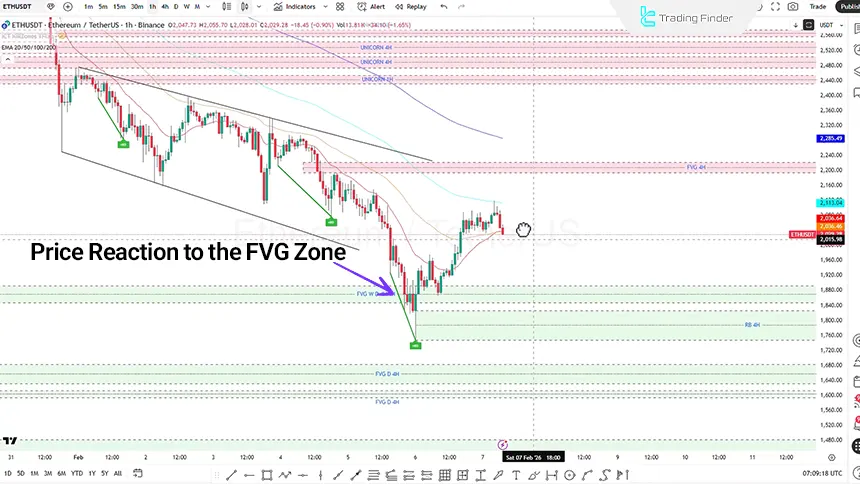
ETH Analysis on the 1-Hour Timeframe (H1)
On the 1-hour timeframe, downside price movement continues, with a recorded reaction to the weekly Fair Value Gap (optimized on the 4-hour and 1-hour timeframes).
This reaction resulted in a limited bullish correction, but lacked sufficient momentum to trigger a market structure break or a Change of Character.
A price close below the $2028 level provides a suitable area to evaluate short trade entries. In this structure, price targets based on manipulation legs are defined between $1997 and $1977 as the leg 2 to 2.5 zone.
The $1916 to $1895 range is identified as the leg 4 to 4.5 zone.
If price enters the rejection block and signs of weakness appear in the bearish trend, a short-term bullish correction may form. However, this scenario runs counter to the dominant trend, and primary focus remains on trades aligned with the bearish structure.
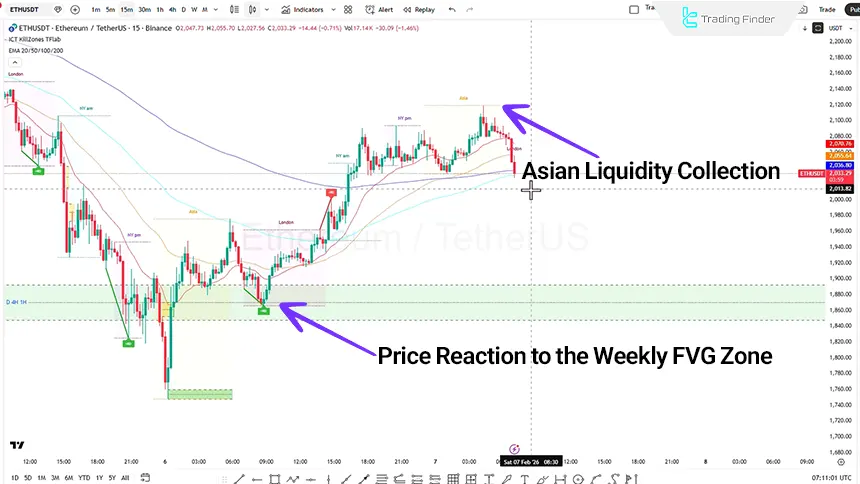
Eth Analysis on the 15-Minute Timeframe (M15)
On the 15-minute timeframe, price structure reflects an accumulation phase accompanied by New York session liquidity collection.
As a result, downside price movement during the London session continues, reinforcing the short-term bearish structure.
Price reaching the overlapping FVG and order block zones during the London and New York sessions creates an area for potential reaction. Within this zone, the probability of a limited bullish correction and formation of a distribution phase during the New York session increases.
Conversely, continued bearish movement supported by momentum activates price entry into the order block near $1801, creating conditions to evaluate long positions with a 1:1 or 1:2 risk-to-reward ratio.
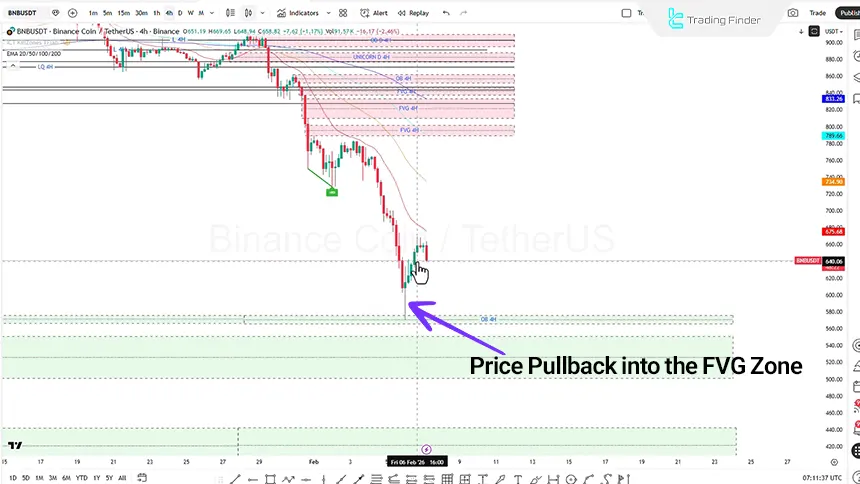
Binance Coin (BNB) Analysis on the 4-Hour Timeframe (H4)
On the 4-hour timeframe, Binance Coin price moves with bearish displacement, signaling continuation of the downtrend.
Increasing selling momentum strengthens the case for targeting lower levels, while RSI analysis confirms entry into a high-potential bearish zone, validating continuation of the bearish trend.
Within this structure, the $524 level followed by $500 are identified as the next downside targets.
Price pullbacks into the FVG or order block zones are considered suitable areas for evaluating short positions and targeting lower levels.
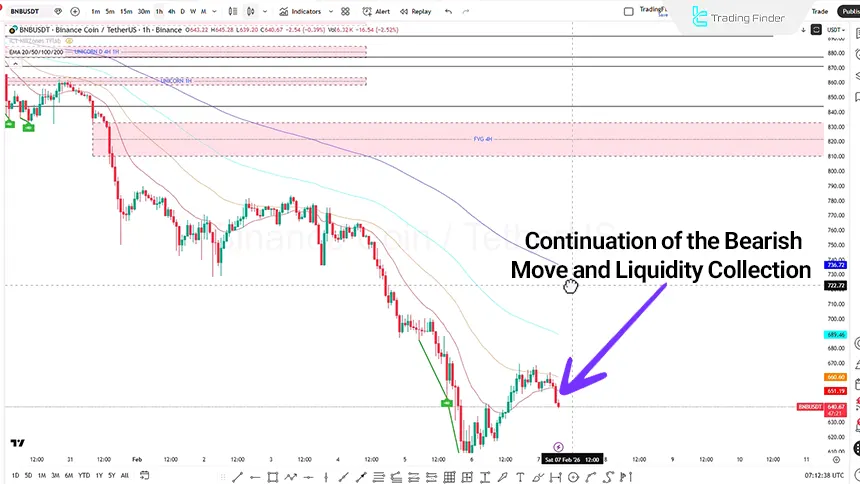
BNBUSDT Analysis on the 1-Hour Timeframe (H1)
On the 1-hour timeframe, Binance Coin shows strong bearish displacement, firmly establishing the market structure in a downtrend.
Consecutive breaks of support levels and price positioning below key moving averages reflect dominant selling pressure.
Price rejection from upper Fair Value Gap and order block zones reinforces the bearish scenario.
Failure to reclaim these zones keeps downside continuation and sell-side liquidity targeting highly probable.
In the current structure, the 4-hour order block located in the lower portion of the chart is identified as a potential reaction zone. Entry into this area may lead to reduced bearish momentum and a short-term correction.
However, unless a meaningful structural shift occurs, such reactions are viewed strictly as corrective moves.
The dominant scenario on this timeframe remains price holding below FVG zones and continued selling pressure.
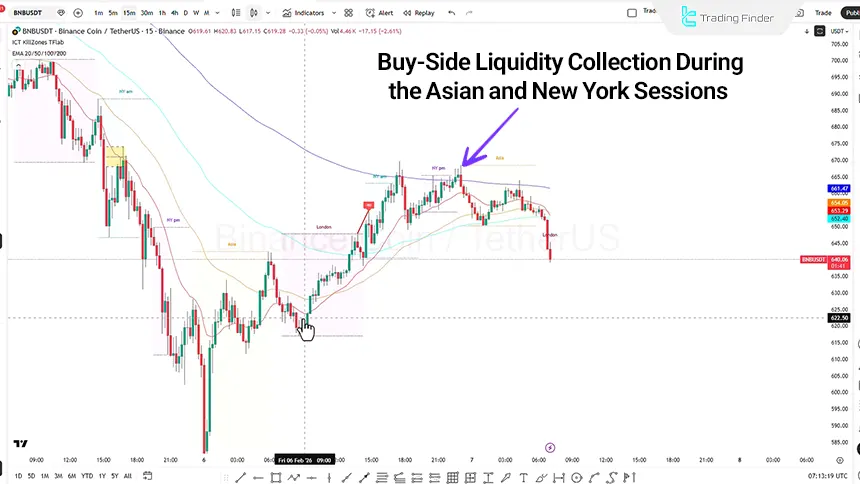
BNB Smart Chain Analysis on the 15-Minute Timeframe (M15)
On the 15-minute timeframe, Binance Coin price action following a short-term corrective phase shows lower highs and declining bullish momentum.
Failure to hold above short-term moving averages reflects weakness in the bullish structure.
Price reactions to upper zones during the Asian and New York sessions were accompanied by buy-side liquidity collection, followed by a downside reversal.
This behavior defines a distribution phase within the short-term market structure.
In a corrective scenario, price pullbacks into short-term FVG or order block zones may reveal weakening bearish momentum.
Such moves are considered limited corrections within the broader downtrend, and until a meaningful structural change occurs, the bearish scenario remains valid.
Conclusion
Price structure across multiple timeframes for Ethereum and Binance Coin confirms continuation of the bearish market phase, accompanied by limited and short-lived bullish corrections.
Dominant selling pressure, failure to reclaim key zones, and negative reactions to Fair Value Gap and order block areas place bearish scenarios at the forefront.
For Binance Coin, bearish displacement and structural breaks across the 4-hour, 1-hour, and 15-minute timeframes confirm sustained selling pressure. Weak bullish momentum, declining buyer interest, and price behavior below equilibrium zones keep market focus on sell-side liquidity targeting.
Overall, until price in both assets successfully stabilizes above key zones and a meaningful market structure shift is confirmed, trading scenarios aligned with the bearish trend carry higher validity. Trade management remains centered on liquidity, momentum, and reactions around structural zones.


