


Key Points:
- The NZD/USD currency pair, after collecting Buy Side Liquidity, failed to hold above previous swings, and the close within the shadow of the weekly candle is a sign of selling pressure;
- On the daily timeframe, the formation of two consecutive Pin Bars and the RSI’s inability to enter overbought territory increase the probability of a bearish correction toward support levels, including 0.5864;
- On the 4-hour timeframe, the reaction to the Order Block and the formation of a Pin Bar have made the correction scenario at the beginning of the week more likely; the reaction to the Rejection Block will determine the continuation of the move;
- On the 1-hour timeframe, failed breakouts of the highs and potential MSS signs have increased the probability of a short-term reversal;
- The structural weakness of NZD against the short-term strengthening of USD and the contradictory condition of the U.S. Dollar Index have made the final direction dependent on price behavior in the FVG and Order Block zones.
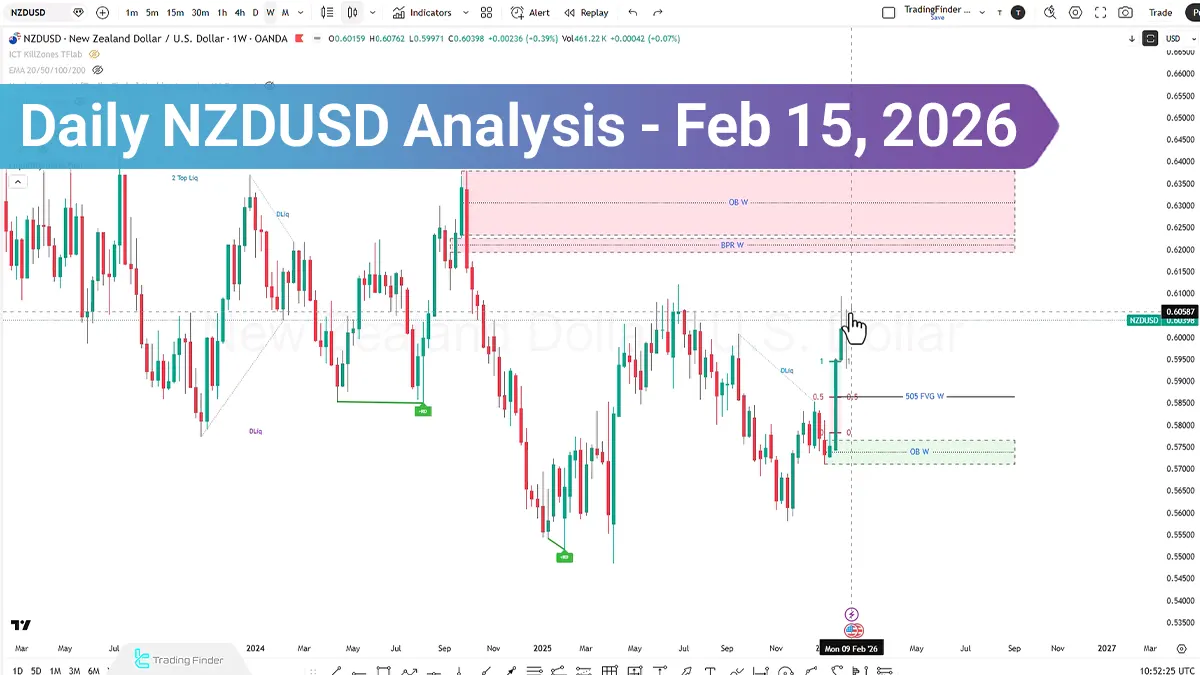
The NZDUSD, despite an initial bullish start, failed to hold above the previous week’s swings and ultimately closed within the shadow of the prior weekly candle.
This price behavior occurred after collecting Buy Side Liquidity and left signs of selling pressure in the market structure. At the same time, analysis of the Relative Strength Index (RSI) and currency strength data directs the dominant scenario toward a conditional bearish correction; however, price reaction to key levels will determine the final path.
NZD/USD Analysis on the Daily Timeframe
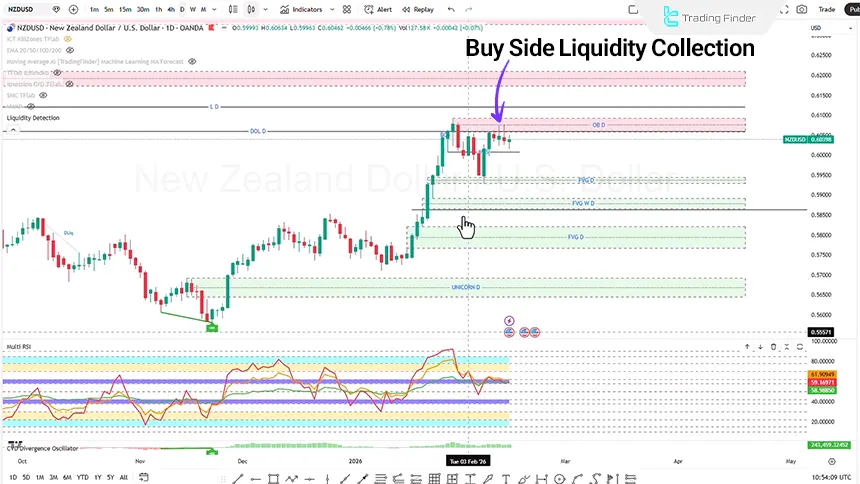
On the daily timeframe, price moved with bullish momentum and collected Buy Side Liquidity around the 0.6064 level. However, subsequently:
- The formation of two consecutive Pin Bar candles was observed;
- The candle closes indicated increasing selling pressure;
- Price failed to enter the overbought zone in the RSI.
This behavior shows that despite bullish potential, the market is facing active supply. If the bearish move continues, a correction toward 50% of the swing candle in the form of a Swing Failure Pattern is possible. In such conditions:
- If weakness in the bearish trend is observed;
- And a reversal is confirmed at support zones;
- One may look for a buy position with a stop loss behind the swing and a Risk to Reward ratio of 1:1 or 1:2.
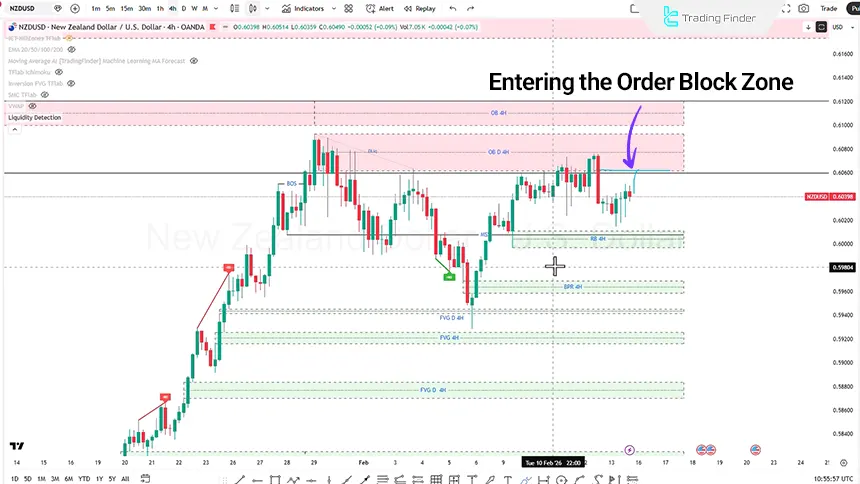
NZDUSD Analysis on the 4-Hour Timeframe (H4)
On the four-hour timeframe, price, after a short-term correction within the Fair Value Gap (FVG), entered the Order Block zone with bullish momentum.
- First scenario: If price initially moves downward and after collecting liquidity enters the Rejection Block zone and weakness in the bearish trend is observed, the buy scenario targeting higher swings (Liquidity Pool) can be considered;
- Second scenario: If at the beginning of the week price enters the Order Block zone and signs of weakness in the bullish trend appear, a sell position with a stop loss behind the Order Block and a target at Sell Side Liquidity zones is possible.
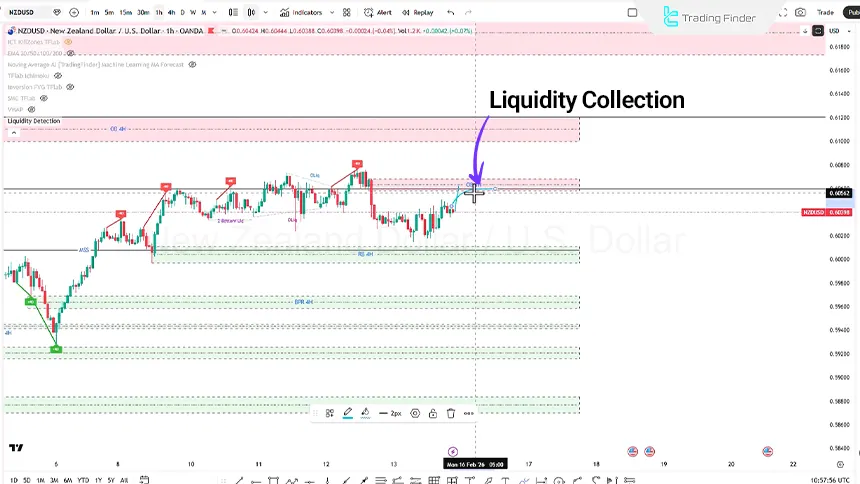
NZD/USD Analysis on the 1-Hour Timeframe (H1)
On the one-hour timeframe, after collecting liquidity, price reacted to the Fair Value Gap (FVG) zone and moved upward again. However:
- Price failed to close above the shadows of previous candles;
- Each attempt to break the high merely resulted in a stop hunt and price reversal;
- Signs of a potential Market Structure Shift (MSS) are forming.
Additionally, if a bearish move occurs at the start of Monday and Sell Side Liquidity is collected, and if a Market Structure Shift (MSS) and seller weakness are observed, a buy position with a stop loss behind the swing or Order Block and a target at bullish swings can be considered.
Conversely, if price breaks the one-hour Order Block with buying pressure, continuation of the bullish move toward the four-hour Order Block around the 0.61 level is possible.
Analysis U.S. Dollar Index (DXY)
The U.S. Dollar Index (DXY) is currently in an overall bearish structure, but in the short term, signs of strengthening momentum are observed. This duality in behavior increases the importance of simultaneously analyzing the macro structure and short-term data.
- The New Zealand Dollar (NZD) is in a downward trend;
- The U.S. Dollar (USD) has gained strength over the past 48 hours;
- In the last 24 hours, USD strength over NZD has also been evident.
However, it should be noted that the U.S. Dollar Index (DXY) remains in a bearish trend. If selling pressure intensifies in this index, a move toward the 95.994 level is possible.
Conclusion
The weekly structure of NZD/USD, after collecting Buy Side Liquidity, shows signs of weakness in continuing the bullish trend. The Relative Strength Index being in the overbought zone and the formation of daily Pin Bars reinforce the correction scenario toward 0.5864.
However, price reaction to FVG and Order Block zones on lower timeframes will be decisive. The final market direction depends on the interaction between price structure, Liquidity, Momentum, and the behavior of the Dollar Index.


