


Key Points:
- Litecoin, after five consecutive weeks of selling pressure, has entered a liquidity accumulation phase; however, the weekly structure and the RSI positioning within the bearish zone continue to reinforce the scenario of further downside;
- On the daily timeframe, price is in a consolidation phase, and a move into the FVG zone could present a potential opportunity for a sell scenario if momentum weakness is observed;
- The 57.51$ level is identified as a key resistance; stabilization above it could open the path toward the 59.85$ zone;
- On the 4-hour timeframe, there is a possibility of a short-term bullish move to collect buy-side liquidity, followed by a rejection from the EMA 50, which could activate the continuation of the bearish trend;
- On the 1-hour timeframe, structural weakness and repeated reactions to the MA 200 indicate that sufficient bullish momentum to change the dominant trend has not yet formed.
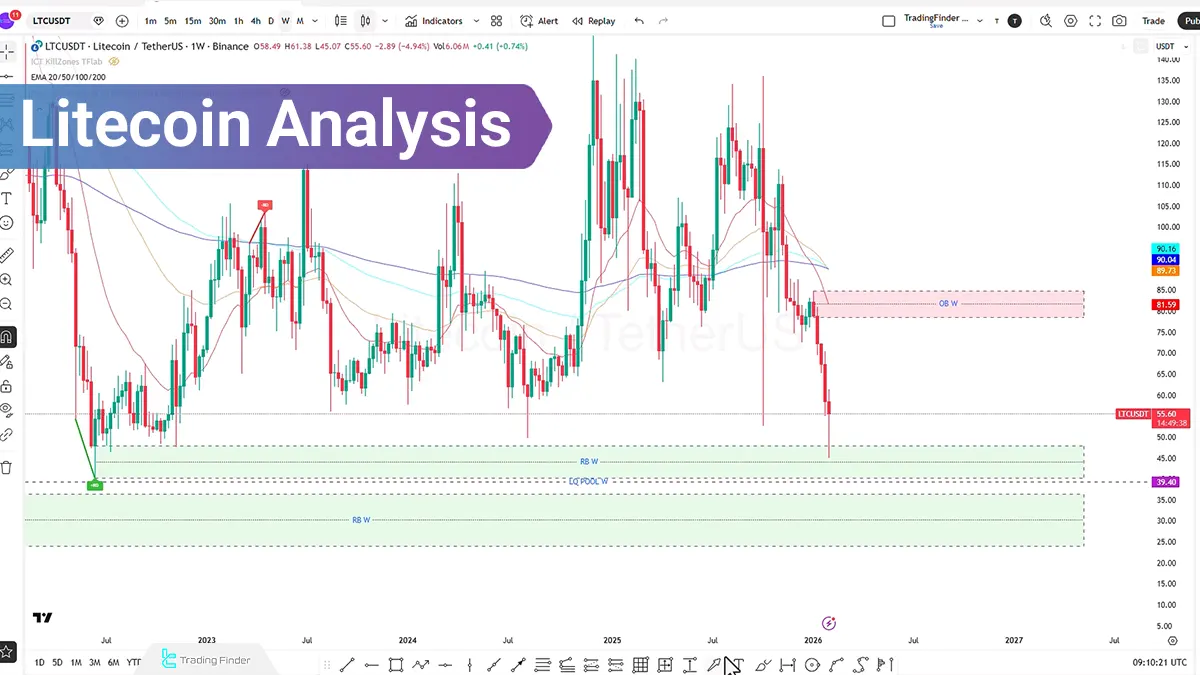
On February 8, 2026, the Litecoin symbol, after five consecutive weeks of selling pressure, entered a liquidity accumulation phase in lower zones.
Price reaction to liquidity areas and the RBW zone on the weekly timeframe, alongside the Relative Strength Index (RSI) being positioned in a high-potential bearish zone, indicates that the dominant market scenario remains inclined toward the continuation of the downtrend.
However, on lower timeframes, signs of attempts to collect buy-side liquidity are observed, which may trigger short-term corrections.
Litecoin Analysis on the Daily Timeframe (D)
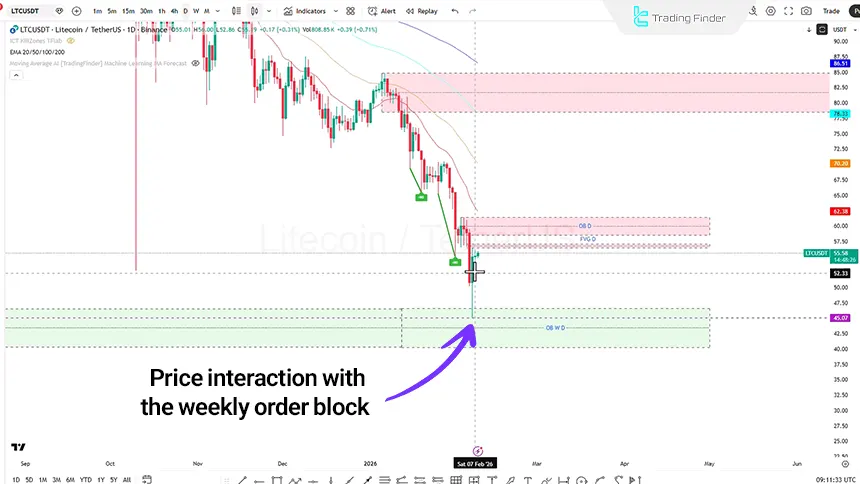
On the daily timeframe, the price reaction to the weekly order block that has been optimized on the daily chart is observable. Over the past day, the price failed to close either above or below the previous day’s candle and has entered a consolidation phase.
With the start of the new day, price is attempting to collect buy-side liquidity, and there is a possibility of entering the Fair Value Gap (FVG) zone.
- Dominant Bearish Scenario: If the price enters the FVG zone and signs of weakness in the bullish structure are observed, this area can be considered a potential zone for a sell position;
- Conditional Bullish Scenario: If momentum increases and a close above the $57.51 level is achieved, the price can move into the next order block at the $59.85 level. This zone can serve as an area to evaluate a new trading strategy based on candlestick behavior.
LTC Analysis on the 4-Hour Timeframe (H4)
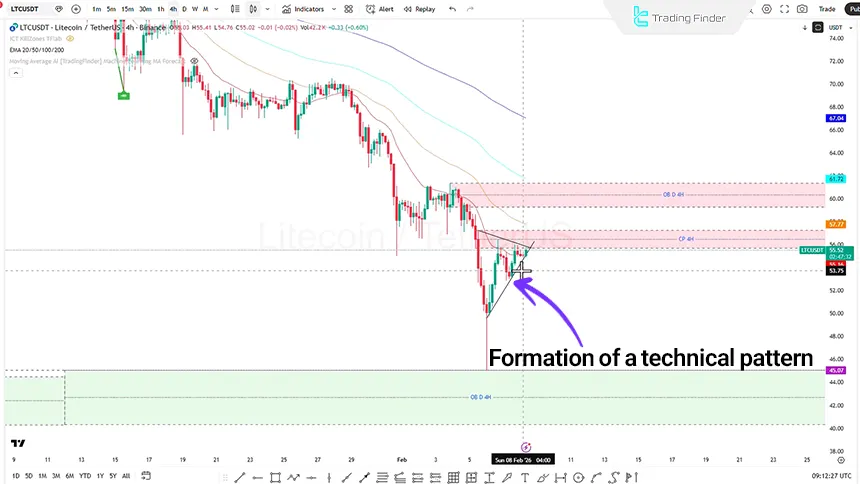
On the 4-hour timeframe, price is oscillating within a pattern, and it is expected that it will first move upward to collect buy-side liquidity and then react to the 50-period Exponential Moving Average (EMA 50).
In the event of a rejection from this moving average, the probability of re-entering a bearish phase and moving toward sell-side liquidity (increases.
In the bullish scenario, if momentum strengthens, price may enter the optimized daily order block on the 4-hour timeframe and react to the 100-period Exponential Moving Average (EMA 100). Within this area, a Unicorn zone is also present, which is considered a key resistance.
Additionally, an overlap between the overbought zone of the AI Moving Average indicator and the EMA 50 on the 4-hour timeframe is observed, which could set the stage for a sell opportunity in line with the dominant trend.
LTCUSDT Analysis on the 1-Hour Timeframe (H1)
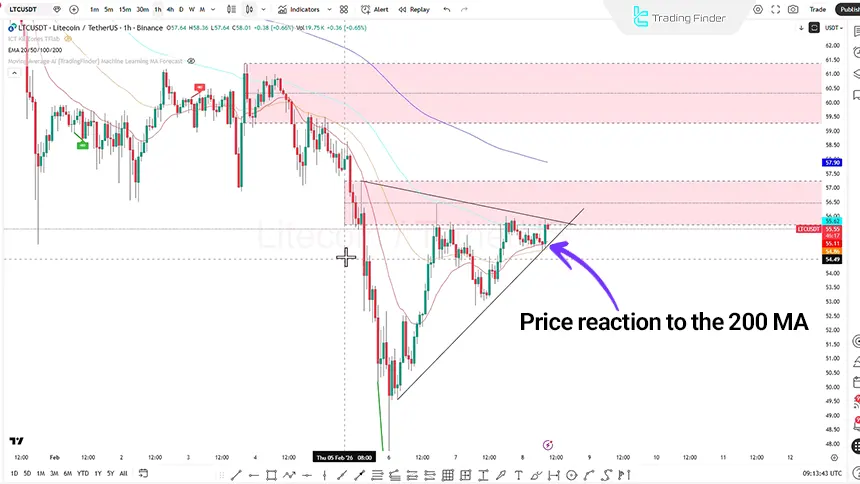
On the 1-hour timeframe, movement details indicate that there is insufficient momentum to continue the bullish trend, and price is accompanied by structural weakness.
The 200-period moving average acts as a key resistance level, and in recent encounters, price has entered a bearish phase after reacting to this level. This behavior indicates the validity of the MA 200 within the short-term market structure.
Conclusion
The weekly structure of Litecoin remains under the dominance of selling pressure, and the RSI being positioned in the bearish zone reinforces the dominant scenario of a continued downward trend.
On lower timeframes, attempts to collect buy-side liquidity are visible; however, as long as valid closes above key levels such as $57.51 are not established, these movements can primarily be evaluated as short-term corrections.
Overall, price behavior around liquidity zones and reactions to moving averages will be decisive in determining the short-term market direction.


