


Key Points:
- The EUR/USD pair has entered a compression phase after the previous bullish scenario failed to materialize and is now showing bullish tendencies at the start of the new session;
- On the 4-hour time frame, entering the BPR and Order Block zones could lead to the collection of Buy Side Liquidity followed by a corrective phase; weakness in momentum and a break of structure would activate the bearish scenario;
- On the 1-hour time frame, the Multi RSI being in the overbought zone indicates temporary momentum strength; however, the formation of divergence or failure to sustain RSI at higher levels could signal a bearish reversal;
- On the 15-minute time frame, price behavior during the London session may determine the direction of the New York session.
In recent trading activity, the EUR/USD pair failed to confirm yesterday’s bullish scenario, entered a phase of consolidation, and is now attempting to move higher at the start of the new trading session. The market’s primary focus is on price reaction to structural zones such as BPR, Order Block, as well as the behavior of the US Dollar Index.
At the same time, analyzing the Relative Strength Index (RSI) and market structure can provide important confirmations for the upcoming scenarios.
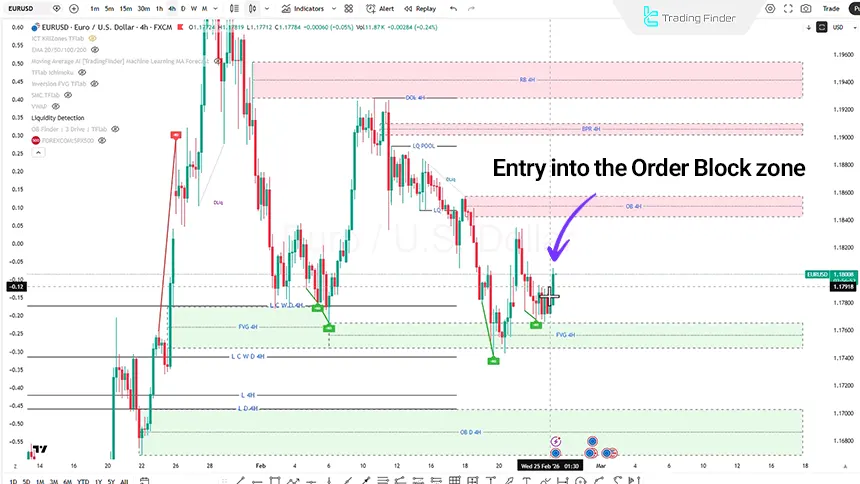
Daily EUR/USD Analysis on the 4-Hour Time Frame (H4)
Yesterday, it was expected that price would move upward to collect Buy Side Liquidity; however, the market entered a compressed range and this scenario was not fully activated. Now, with the start of the new session, price has once again shown bullish tendencies.
If buying pressure increases, price may:
- Enter the Balanced Price Range (BPR);
- React to the Order Block zone;
- Collect Buy Side Liquidity;
- And then enter a corrective or bearish phase.
Conversely, if weakness is observed in the bullish trend and a break of structure and change of character occur, the likelihood of a bearish move and the collection of Sell Side Liquidity increases, making lower price targets accessible.
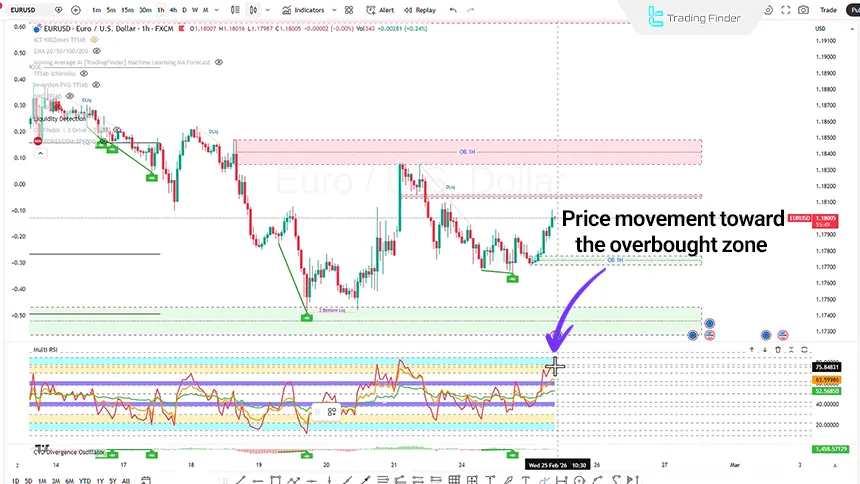
EURUSD Analysis on the 1-Hour Time Frame (H1)
On the one-hour time frame, using the Multi Relative Strength Index indicator, price has entered the Overbought zone and a high-potential area. Under normal conditions, this situation may indicate the continuation of bullish momentum.
However, the following two scenarios can be examined:
- Maintaining momentum and stabilization of the Relative Strength Index (RSI) at higher levels;
- Potential continuation of the bullish move and access to higher liquidity zones;
- Failure of the Relative Strength Index (RSI) to reach the overbought zone;
- Formation of Divergence during the bullish trend;
- Confirmation for entering sell positions.
In such conditions, the stop loss can be placed behind the structural zone or behind the last swing, with the initial target being Sell Side Liquidity.
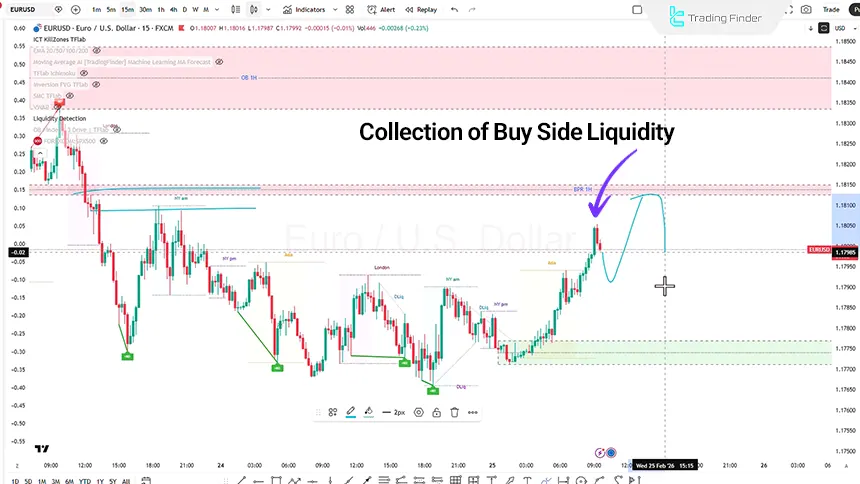
EUR/USD Analysis on the 15-Minute Time Frame (M15)
On the 15-minute time frame, price has moved upward with an aggressive impulse. However, price behavior during the London session will be decisive.
If Buy Side Liquidity is collected during the London session and price re-enters a consolidation phase, it is possible that during the New York session we may witness a bearish Distribution Move. In this scenario, price reaction to structural zones and signs of weakness in bullish momentum are of key importance.
Conclusion
The current EUR/USD structure is positioned within a sensitive zone where reaction to the BPR and Order Block areas will determine the next direction. The behavior of the Relative Strength Index and the formation of divergence are among the most important variables influencing the upcoming scenarios.
Continuation of bullish momentum or a break of market structure will determine the next price movement.


