


Key Points:
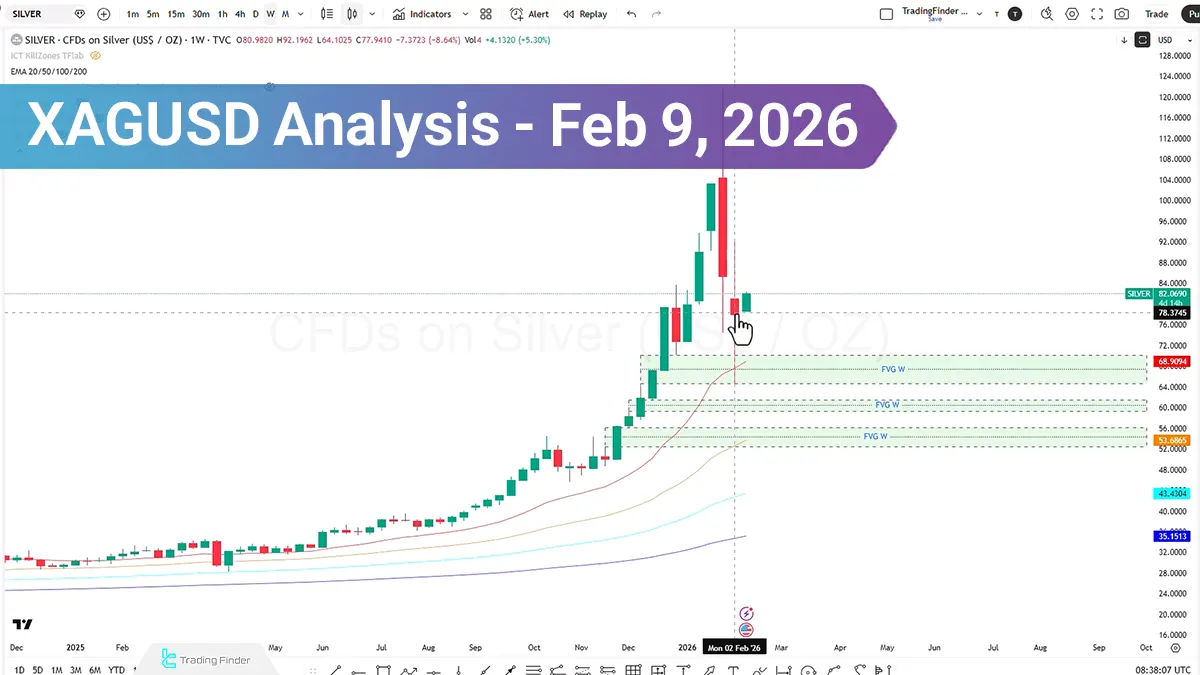
- Silver, after collecting sell-side liquidity, has closed within the previous weekly candle; this type of close indicates a short-term bullish bias;
- On the daily timeframe, failure to stabilize below the previous swing low and the potential formation of a Morning Star pattern have strengthened the end-of-correction scenario;
- consolidation above $93.3674 could confirm further upside continuation;
- On the 4-hour timeframe, reaction to the order block and the formation of a compression structure (potential diamond pattern) place the market on the verge of a sharp move;
- On the 1-hour timeframe, a break of structure without stabilization and a return to the consolidation zone indicate seller weakness; the market focus is on collecting buy-side liquidity before the next move;
- On the 15-minute timeframe, negative RSI divergence and signs of price manipulation during the London session increase the probability of a short-term bearish rotation and filling of the daily gap.
The silver market, after experiencing selling pressure and collecting sell-side liquidity, has shown a meaningful reaction to the 20-day moving average and ultimately closed within the previous weekly candle.
This type of candle close indicates a short-term bullish bias.
Additionally, the collection of buy-side liquidity and closing within the shadow of last week’s candle could activate a bearish reversal scenario. Below, the market structure across different timeframes is examined.
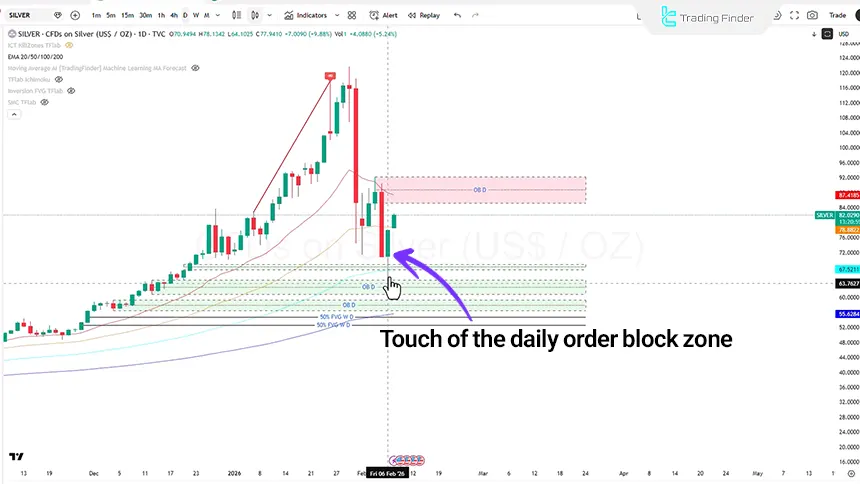
Silver Analysis on the Daily Timeframe (D1)
On the daily timeframe, after a stop hunt, price failed to stabilize below the previous swing low and returned to the prior range.
At present, if today’s candle closes positively, there is potential for the formation of a Morning Star pattern, which could signal the end of the bearish trend and the beginning of a bullish phase.
Price is currently entering the daily Order Block zone. This area may cause a short-term price correction. However:
- If price closes above the order block at the $93.3674 level, the probability of bullish continuation and targeting higher levels increases;
- Failure to stabilize above this level could result in consolidation within this range and a return to lower levels.
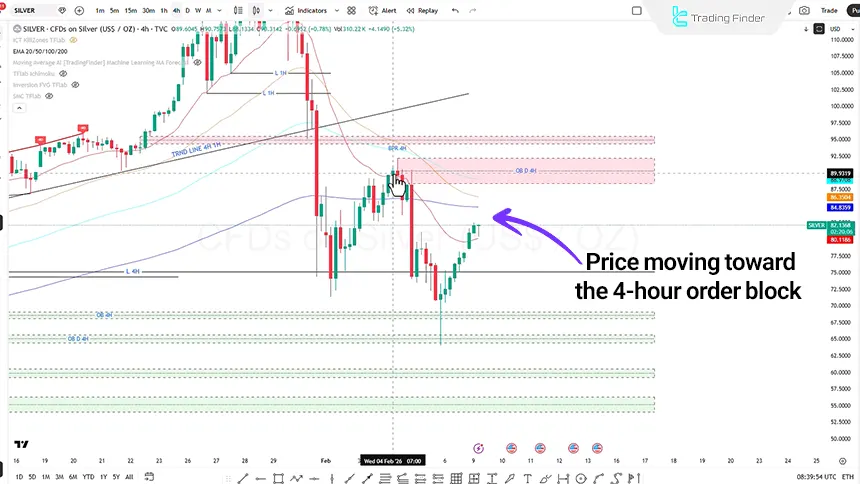
XAGUSD Analysis on the 4-Hour Timeframe (H4)
On the 4-hour timeframe, after a short-term correction, price entered the Fair Value Gap zone but failed to stabilize within a bearish trend.
Following a Liquidity Sweep, a reaction to the daily order block, which had been optimized on the 4-hour timeframe, is observed, and price re-enters a consolidation phase.
Within this structure, the possibility of forming a diamond pattern also exists; as price forms higher highs and lower lows; if price closes within the range and completes the structure, the following scenarios are likely:
Short-Term Bearish Scenario:
- Price movement toward the FVG zone;
- Potential rejection from this zone and bullish return;
- In case of increased selling pressure, entry into the range of a single order block candle and the shadow of a pin bar candle.
In these areas, if weakness in bearish momentum is observed, the scenario of entering a buy position with proper risk management can be considered.
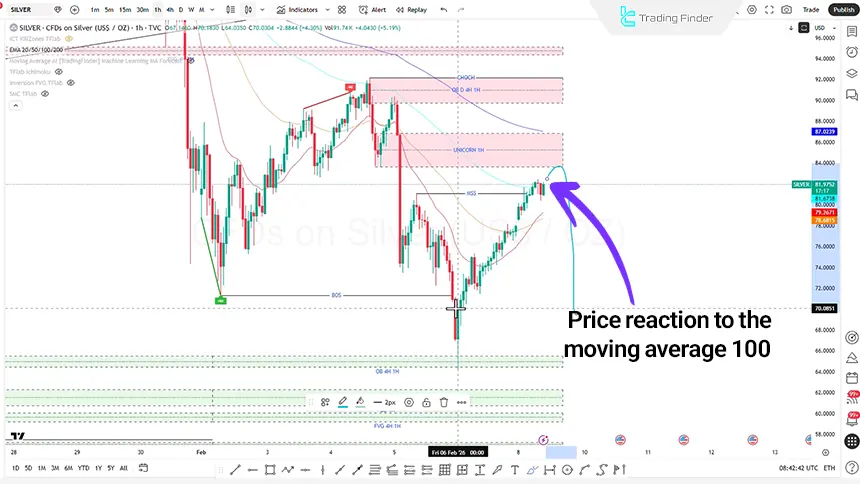
Silver Analysis on the 1-Hour Timeframe (H1)
On the 1-hour timeframe, a market structure break has occurred, initially considered a bearish confirmation, but price failed to stabilize and a trend break formed.
Additionally, a renewed reaction to the order block and return to the consolidation zone indicate weakness in the continuation of the bearish move.
After the occurrence of a Market Structure Shift and reaction to the 100-day moving average, the following scenario can be examined:
- Price movement toward collecting buy-side liquidity;
- Reaction to the 1-hour Unicorn zone;
- Then re-entry into a bearish phase.
If a Market Structure Shift break is observed along with seller weakness, the scenario of entering a buy position targeting hourly liquidity can be evaluated.
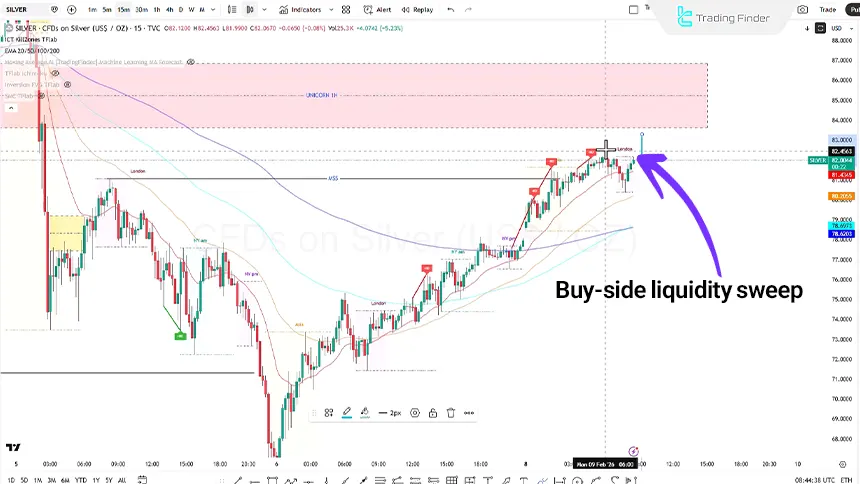
XAGUSD Analysis on the 15-Minute Timeframe (M15)
On the 15-minute timeframe, price behavior during the Asian session indicates an accumulation phase, and during the London session, signs of price manipulation are observed.
Potential Scenario:
- Collection of buy-side liquidity;
- Reaction to the Unicorn zone;
- Bearish move to fill the daily gap;
- Entry into the order block at the $72.8821 level.
In this area, if weakness in the bearish trend is observed, the scenario of entering a buy position targeting higher swings can be considered.
Additionally, on the 15-minute timeframe, negative divergence is observed in the Relative Strength Index; price has formed higher highs while RSI has formed a lower high.
This divergence may provide a warning of a short-term rotation from bullish to bearish.
Conclusion
The overall silver structure on lower timeframes shows signs of weakness in the continuation of the bearish trend and the formation of positive divergences; however, stabilization above the 92-point level remains the main condition for a macro phase shift.
The presence of a daily gap and accumulated liquidity on both sides of the market strengthens range-bound scenarios. At present, price behavior within order block zones and reactions to liquidity pools will determine the market’s medium-term direction.


